nutsinee.kijbunchoo@LIGO.ORG - posted 23:56, Tuesday 11 August 2015 (20456)
A Visualized Violin Mode Monitor
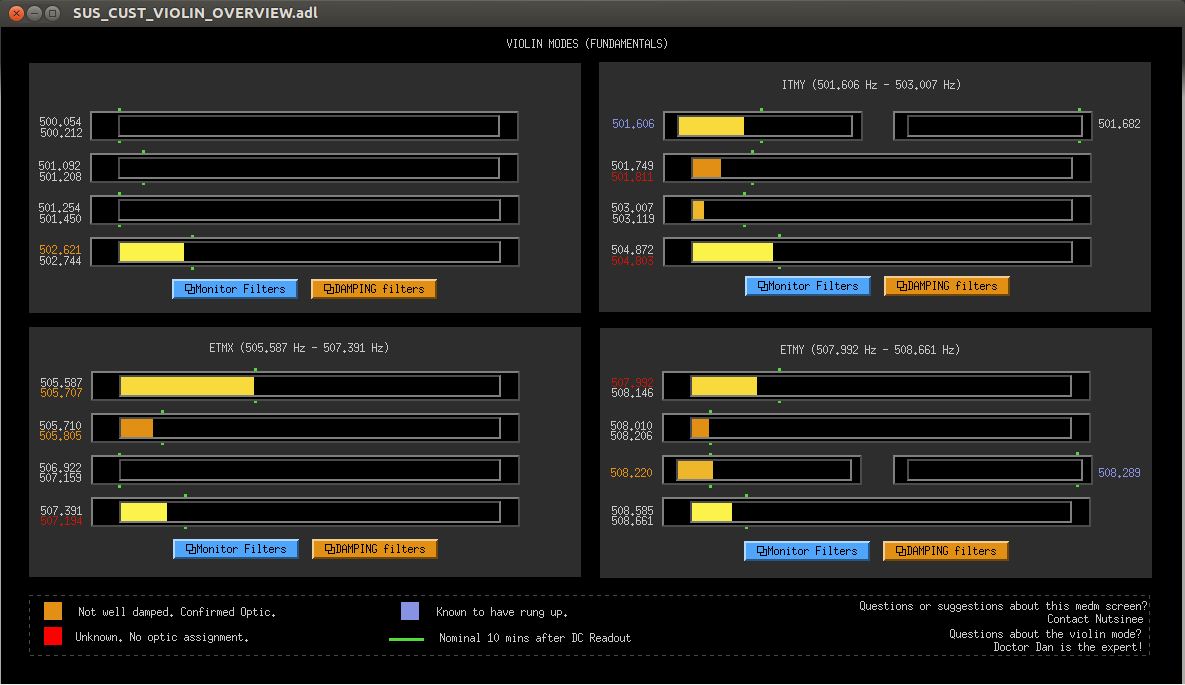
Locates at SITEMAP > SUS > VIOLINS. This monitor simply turns the log RMS output of the violin monitor into a bar chart. One bar chart monitors two frequencies due to the lack of filter bank space (only those that have known to cause trouble get its own narrow BP filter). Low value is 0 and high is 4. The green marks indicate the violin (RMS) amplitudes after 10 minutes of a lock stretch. Healty violin modes shouldn't go pass the green marks and some should get better as time passes. More fine-tuning can be done but it's good for now. I will put in the first harmonics once we know more about them.
Images attached to this report