Craig, Jenne, Kiwamu,
We did a VCO calibration for the ALS diff vco in the last Friday when the interferometer was suffering from high wind. The new result suggests that the VCO calibration stays the same as the one for ER7 by 0.6%.
The new coefficient is 0.11847 +/- 9.3e-05 [cnts @ DIFF_PLL_CTRL_INMON / Hz @ DIFF VCO frequency read by the timing comparator ].
The attached below shows the fitting result:
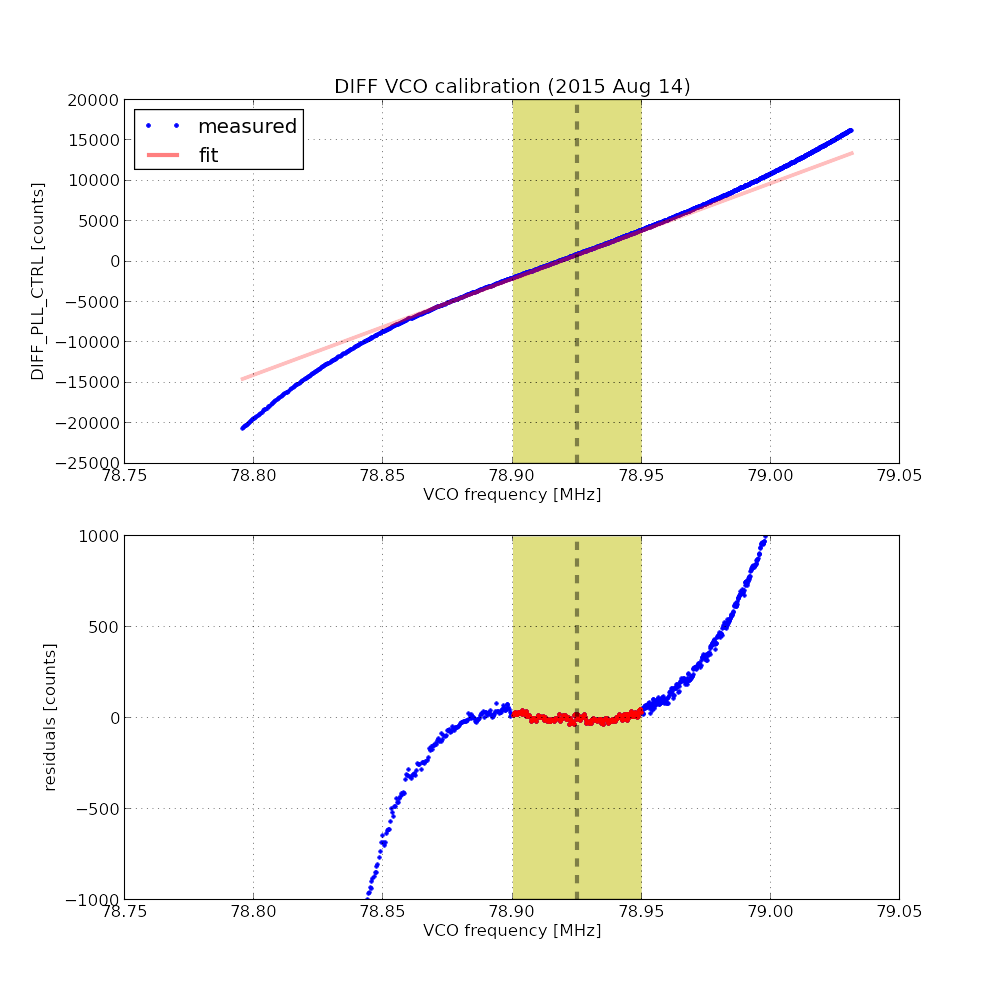
The measurement method is the same as the previous one which is described in this alog (alog 18711). One difference is that we used the INMON as opposed to OUTPUT because we did not want to rely on the filter shape of the chain which contains the zpk([[40], [1.6]) which is supposed to cancel the low noise VCO circuit. The sweep was as slow as 255 [Hz/ sec]. The fitting uses a frequency region where the linearity was found to be good (as indicated in the plot as yellow shaded region).
The analysis code, data and figure are saved in SVN as follows:
/ligo/svncommon/CalSVN/aligocalibration/trunk/Runs/ER8/H1/Scripts/ALSDiff/vco_calibration_fitting.py
/ligo/svncommon/CalSVN/aligocalibration/trunk/Runs/ER8/H1/Measurements/ALSDiff/2015-08-14_vco_sweep_v2.txt
/ligo/svncommon/CalSVN/aligocalibration/trunk/Runs/ER8/H1/Results/ALSDiff/2015-08-14_VCO_calibration_v2.pdf
/ligo/svncommon/CalSVN/aligocalibration/trunk/Runs/ER8/H1/Results/ALSDiff/2015-08-14_VCO_calibration_v2.png
I made another measurement which is an improved version of the last measurement.
The improvements are:
- The measurement is focused on the linear region. So it now has finer data points.
-
Instead of continuous sweep in the VCO frequency, I did discrete steps in order to let the frequency comparator and VCO settle.
- After each frequency step, I waited such that the frequency stays there for 5 seconds which should be long enough for the VCO and comparator
The fitted coefficient this time is lower that the last measurement by 0.4 %, presumably because of the improvements which should get rid of systematic biases.
Coefficient = 0.11802 +/- 4.92e-05 (0.042 %) in [cnts / Hz]
Here is a plot showing the data along with the fitting line:
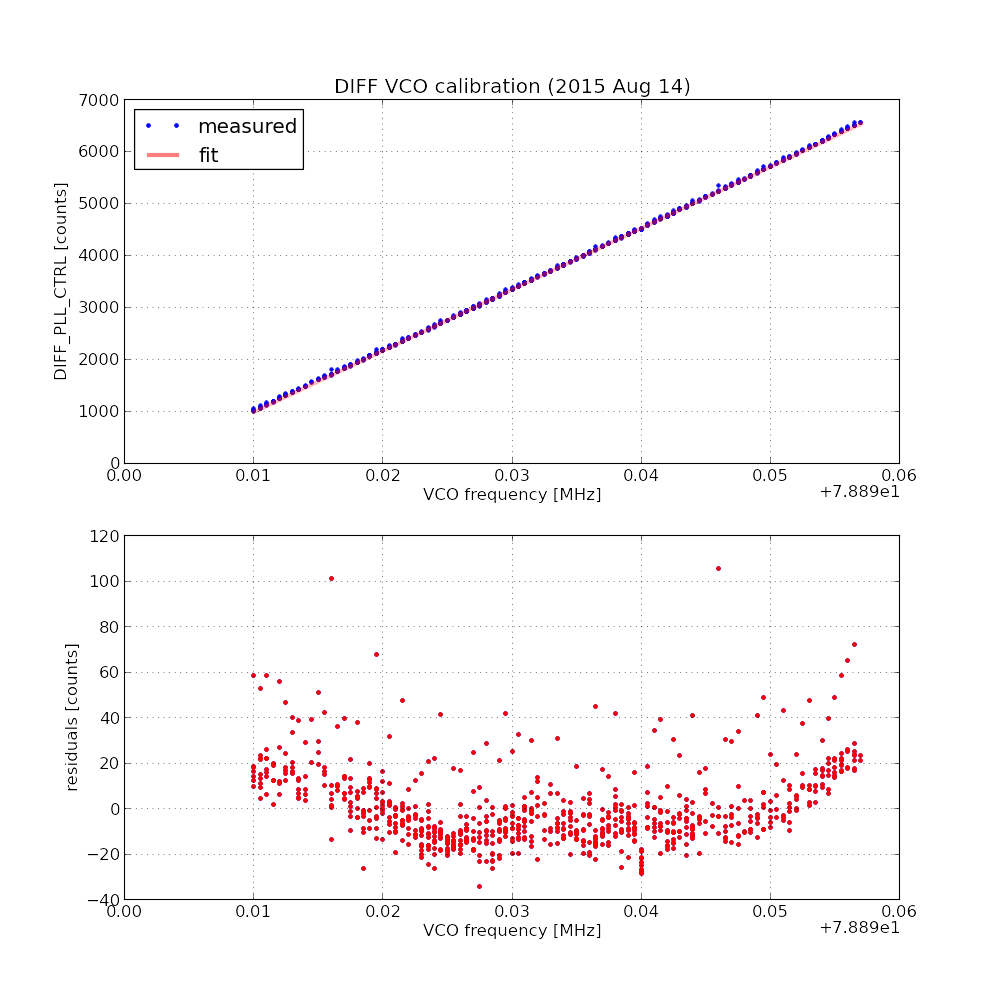
Looking at the residuals, there seem to be two components -- majorities are on the wavy trend while there are scattered points which tend to have high values. I believe that the ones having high values are due to the impulse response of the VCO and comparator which deviated every time when I made a discrete steps. As shown, they tend to pull up the interception while they don't seem to affect the slop so much. Since the quantity we care is the slope of the fitting line, I think the data is good enough.
As usual, the data, script and figures are checked in to the SVN. They can be found at:
/ligo/svncommon/CalSVN/aligocalibration/trunk/Runs/ER8/H1/Measurements/ALSDiff/2015-08-18_vco_steps.dat
/ligo/svncommon/CalSVN/aligocalibration/trunk/Runs/ER8/H1/Scripts/ALSDiff/2015-08-18_vco_calibration_fitting.py
/ligo/svncommon/CalSVN/aligocalibration/trunk/Runs/ER8/H1/Results/ALSDiff/2015-08-18_VCO_calibration.pdf
/ligo/svncommon/CalSVN/aligocalibration/trunk/Runs/ER8/H1/Results/ALSDiff/2015-08-18_VCO_calibration.png