Jeff, Evan
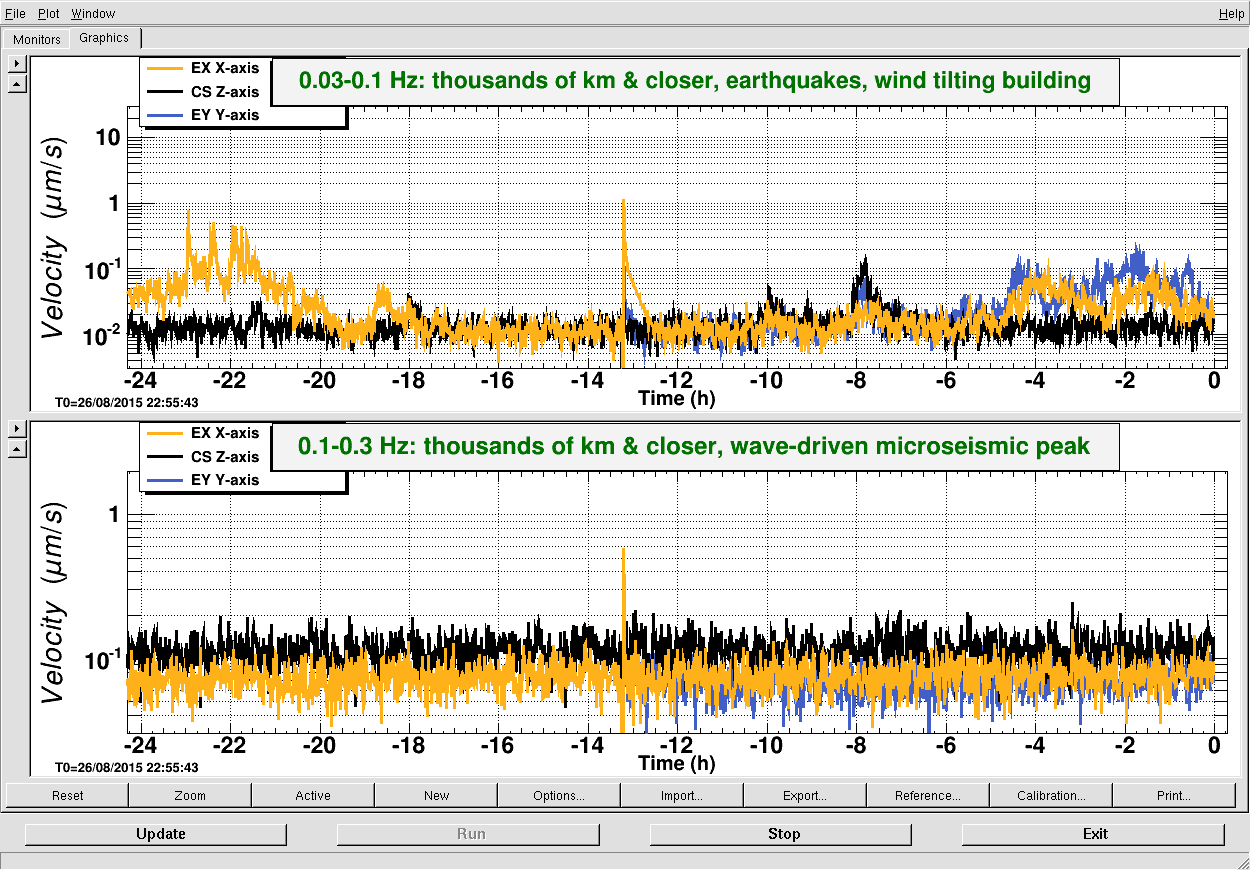
There is now a new DMT viewer template for viewing the BLRMS of the corner and end-station STSs. It is userapps/isc/h1/scripts/Seismic_FOM_STS.xml.
This is meant to replace the Guralp DMT viewer template.
Right now it only displays the lowest two BLRMS (0.03 to 0.1 Hz and 0.1 to 0.3 Hz).
[As an aside, the frequency bands implied by the channel names in DMT viewer don't seem to match up with the front-end channels. For example, the front-end EX-X channels are named as follows:
H1:ISI-GND_STS_ETMX_X_BLRMS_100M_300M
H1:ISI-GND_STS_ETMX_X_BLRMS_10_30
H1:ISI-GND_STS_ETMX_X_BLRMS_1_3
H1:ISI-GND_STS_ETMX_X_BLRMS_300M_1
H1:ISI-GND_STS_ETMX_X_BLRMS_30_100
H1:ISI-GND_STS_ETMX_X_BLRMS_30M_100M
H1:ISI-GND_STS_ETMX_X_BLRMS_3_10
while the DMT channels are named as follows:
H1:ISI-GND_STS_ETMX_X_DQ_0p03-0p1Hz_48h
H1:ISI-GND_STS_ETMX_X_DQ_0p1-0p2Hz_48h
H1:ISI-GND_STS_ETMX_X_DQ_0p2-0p35Hz_48h
H1:ISI-GND_STS_ETMX_X_DQ_0p35-1Hz_48h
H1:ISI-GND_STS_ETMX_X_DQ_1-3Hz_48h
Are these BLRMS distinct from what's being computed in the frontend?]
What was wrong with the old plot?
The STS is more sensitive than the Güralp in the frequency band where we typically watch for earthquakes (30 mHz to 100 mHz).
Looks like we should keep the old plot then, since everyoe already knows it.