nairwita.mazumder@LIGO.ORG - posted 19:53, Sunday 30 August 2015 - last comment - 23:29, Wednesday 16 September 2015(21035)
Following up of the "Bumbling line" on ETMX seismic channels
Nairwita Mazumder, Rich Abbott

A few days back Jim noticed  (alog ) that the "Bumbling line" which varies over a large frequency range is again back on ETMX seismic channels . This was first noticed on March and disappeared before ER7 and again was seen from 4th August. One can see the lines at all the horizontal and vertical sensors on ETMX.

I have attached a pdf containing some follow up work done during Rich's recent visit to LHO. The first plot in the pdf is the spectrogram of ETMX GS13 on 26th August. It can be seen that there are multiple wandering lines having a fixed offset.  We were suspecting that some magnetometers at the End X might be the culprit (as we could not find any correlation between temperature fluctuation  with the line ).

The second and third plots are the spectrum of H1:PEM-EX_MAG_EBAY_SEIRACK_Z_DQ and H1:ISI-ETMX_ST2_BLND_Z_GS13_CUR_IN1_DQ for 2nd August and 26th August respectively. The red one is for 2nd August when the bumbling line could not be found and the blue one is the recent data (26th August). It is clear that the peaks appearing on  ISI-ETMX_ST2_BLND_Z_GS13 after 3rd August are correlated with the peaks of the spectrum (which also appeared around the same time) of SEIRACK magnetometer .

The plots on the second page shows the coherence between GS13 and the magnetometers in the VEA and SEIRACK. It looks like  the magnetometer on the SEI rack has stronger coherence with GS13 sensors than the magnetometer located at VEA .  I have marked two points (blue and red cross)  in the coherence plots to highlight two of the many peaks.
Non-image files attached to this report

Comments related to this report
Adding to Nairwita's comments, the signal seen in the GS13 spectra is also present in the magnetometer data. This being the case, it's most likely that the harmonic series points to an electromagnetic artifact associated with the HEPI pump variable frequency drive. The fact that the same signature does not exist at the other end station (I assume this to be true, but have not verified) may point to an enhanced susceptibility in the X-end electronics for some reason. No reason to panic much yet, but duly noted.
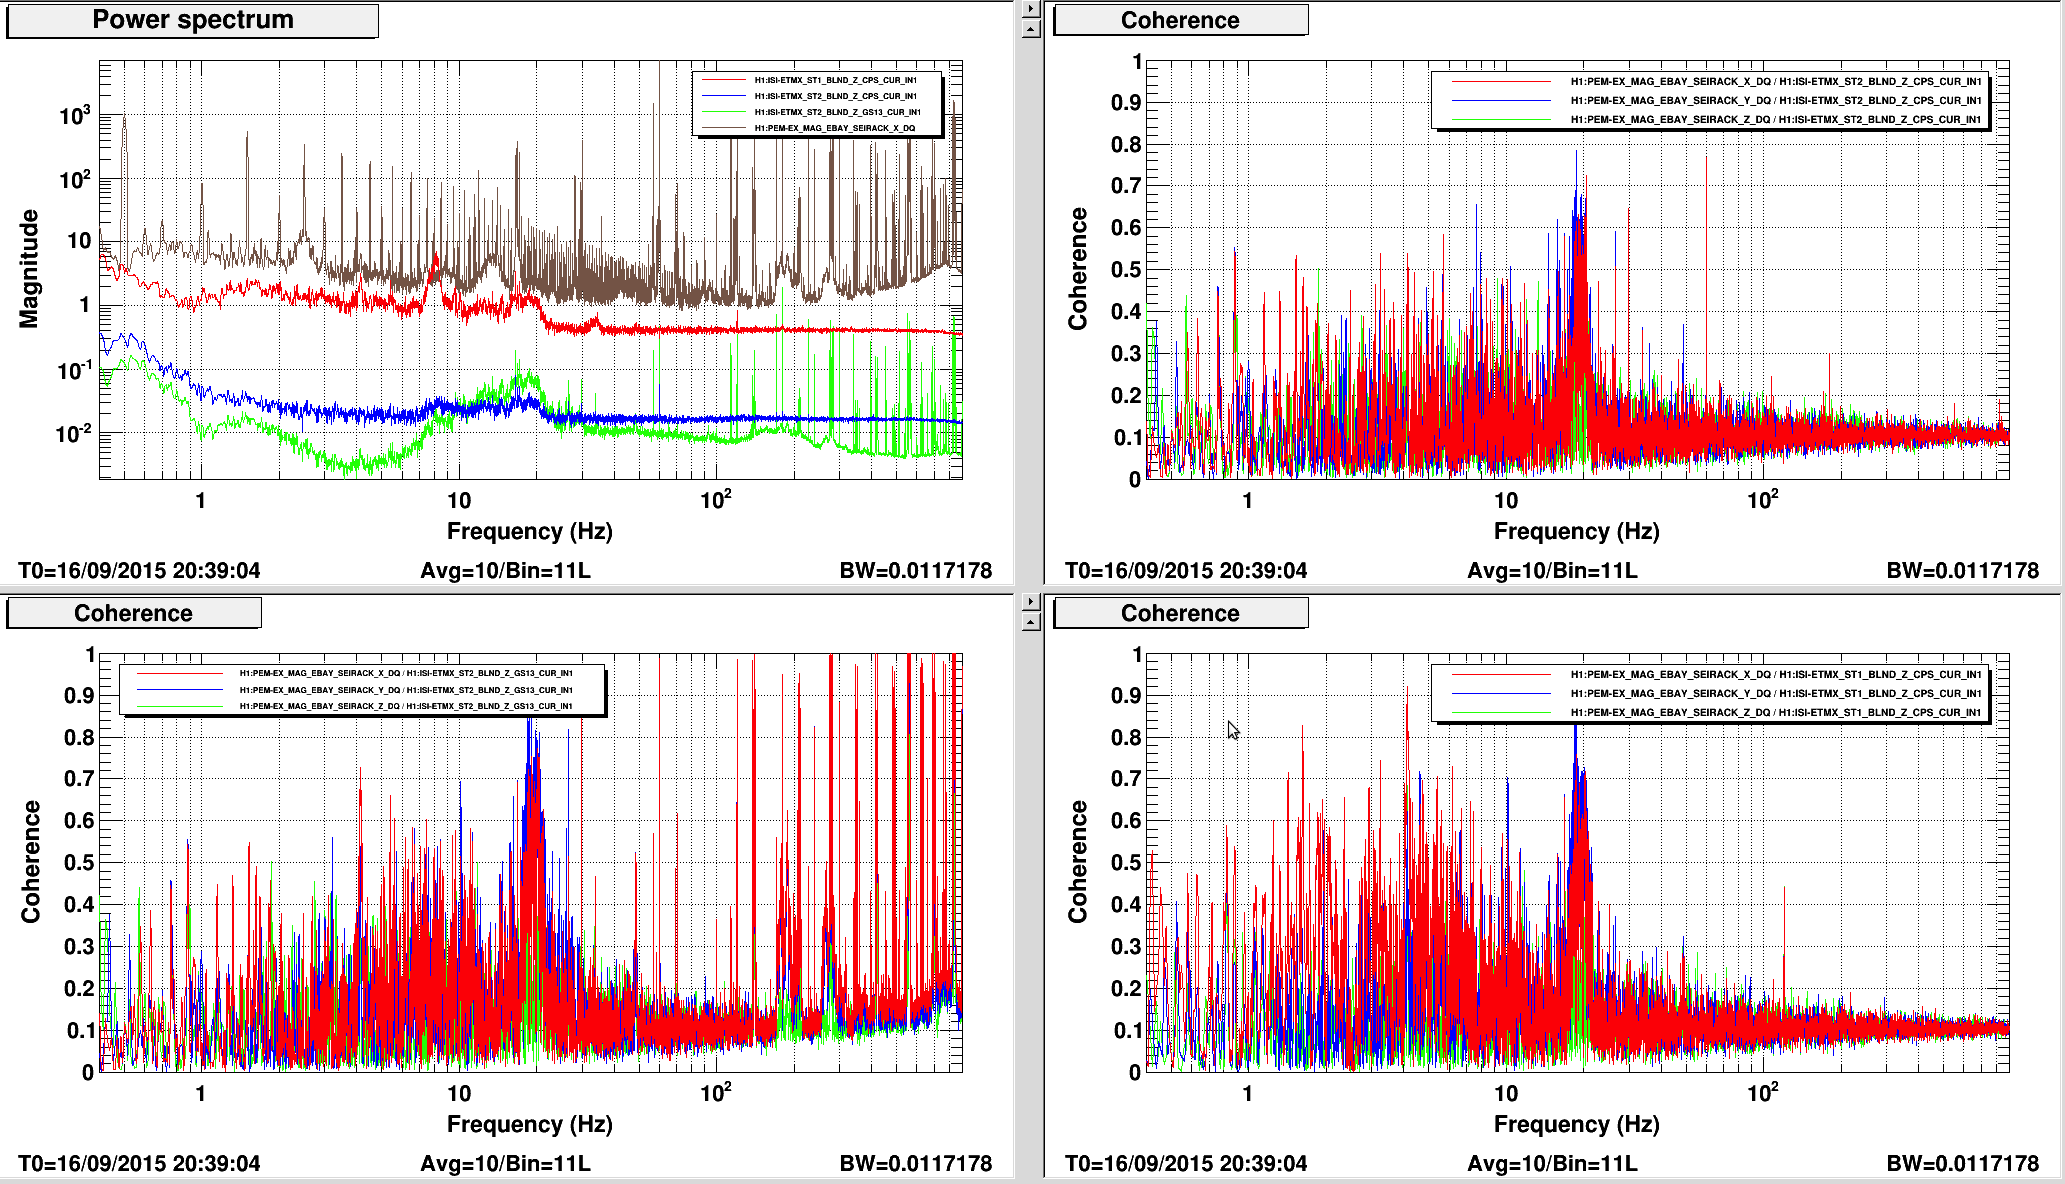
I have attached the coherence plots computed between PEM-EX_MAG_SEIRACK and GS13 , ST1 CPS and ST2 CPS over the frequency range 0.4Hz-900Hz to check the following two points:
(1) If there exists any coherence between CPS and the Magnetometer at frequency above 256 Hz
(2) What the low frequency  behavior is

I can be seen that the coherence between CPS and the magnetometer above ~25Hz is pretty low compared to GS13, but them have relatively high coherence with PEM-EX_MAG_SEIRACK near 20Hz .
Images attached to this comment