Jeffrey K, Kiwamu I, Darkhan T
Overview
In this alog we present a summary of H1 SUS ETMY PUM coil driver electronics measurements (LHO alog 20846) analysis. PUM coil driver circuit consist of switchable low-pass filter and acquisition circuits (DCC D070483). Fitted zeros and poles of these circuits are given in Table 1:
Table 1. H1:SUSETMY-PUM driver fit summary
==================================================================================================================================
LP1 Acq=0 Acq=1 PUM total in state 3 (nominal)
( z : p ) [Hz] ( z : p ) [Hz] ( z : p ) [Hz] ( z : p ) [Hz]
----------------------------------------------------------------------------------------------------------------------------------
UL ( 5.62, 21.41 : 0.50, 240.86 ) ( 11.87 : 119.62 ) ( 1.31 : 106.12 ) ( 5.62, 21.41, 11.87 : 0.50, 240.86, 119.62 )
LL ( 5.70, 21.66 : 0.50, 242.82 ) ( 11.81 : 120.07 ) ( 1.30 : 106.42 ) ( 5.70, 21.66, 11.81 : 0.50, 242.82, 120.07 )
UR ( 5.74, 21.38 : 0.50, 241.15 ) ( 11.84 : 119.68 ) ( 1.30 : 105.43 ) ( 5.74, 21.38, 11.84 : 0.50, 241.15, 119.68 )
LR ( 5.78, 21.09 : 0.50, 239.51 ) ( 12.75 : 118.38 ) ( 1.45 : 106.21 ) ( 5.78, 21.09, 12.75 : 0.50, 239.51, 118.38 )
mean ( 5.71, 21.37 : 0.50, 241.00 ) ( 11.97 : 119.56 ) ( 1.34 : 106.04 ) ( 5.71, 21.37, 11.97 : 0.50, 241.00, 119.56 )
==================================================================================================================================
Overall, uncertainties in the weighted means of fitted zero and pole frequencies for low-pass filter are under 0.15%, and for acquisition circuit are under 0.30%, complete table of uncertainties are given in tables 2 and 3.
Fitted values for low-pass filter were within ~1.5 Hz of the values we expected to have according to T1100507 (except for high frequency pole which came out to be at ~240 Hz as opposed to 250 Hz in the document).
Acquisition curcuit TFs showed roll-off (perhaps some combination of poles) after 1 kHz, and roll-off of the phase in acquisition circuit TF is noticable after 100 Hz. Since we don't understand the cause of this roll-off, we tried to elimite this effect from fitting of known zeros and poles (from T1100507) by reducing fitting range to [0.1 80.0] Hz. The results were mostly at the expected frequencies except for high frequency poles: in state 1 we got a pole at ~119 Hz as opposed to 110 Hz suggesed by the document, and in state 2 we got a pole at ~106 Hz as opposed to 80.5 Hz from the document.
Fitted zero-pole-gain models of UIM, PUM, ESD drivers' electronics TFs will be implemented in DARM OLG TF model for ER8/O1. In fact, models of PUM coil-driver electronics TFs from this analysis have been already implemented in DARM OLG TF model for ER8/O1 (see LHO alog 21250).
Details
In this analysis we used measurements of the H1 SUS ETMY drivers from Aug. 24, 2015 (LHO alog 20846). The measured transfer functions between excitation and readout signals, apart from driver itself, include also frequency dependent effects from IOP upsampling, digital anti-imaging, analog anti-imaging, and analog anti-aliasing filters given in the diagram below (also explained in LHO alog comment 21127):
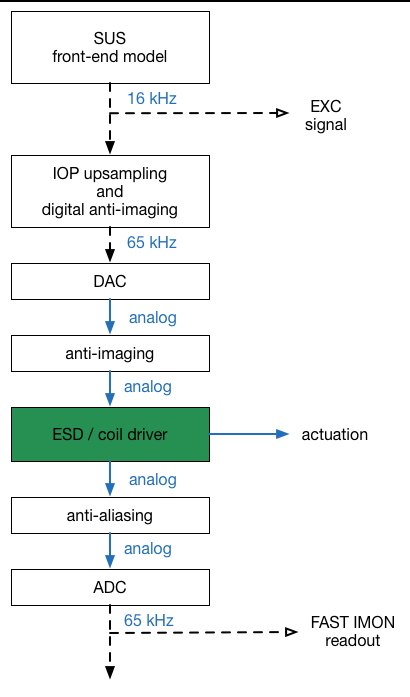
Assuming that the FAST IMON does not have a frequency dependent effects and dividing out the IOP digital anti-imaging, the analog anti-imaging and ani-aliasing filter TFs from the measurements, should give us the PUM coil-driver electroinics TFs for each of the quadrants in 4 different opereating states. Idially the PUM coil driver electronics (DCC D070483) transfer functions in 4 operating states should correspond to a state machine diagram given in T1100507, however LISO zero-pole fitting results of the measured PUM coil driver TFs (see Table 1) did not entirely agree with the diagram.
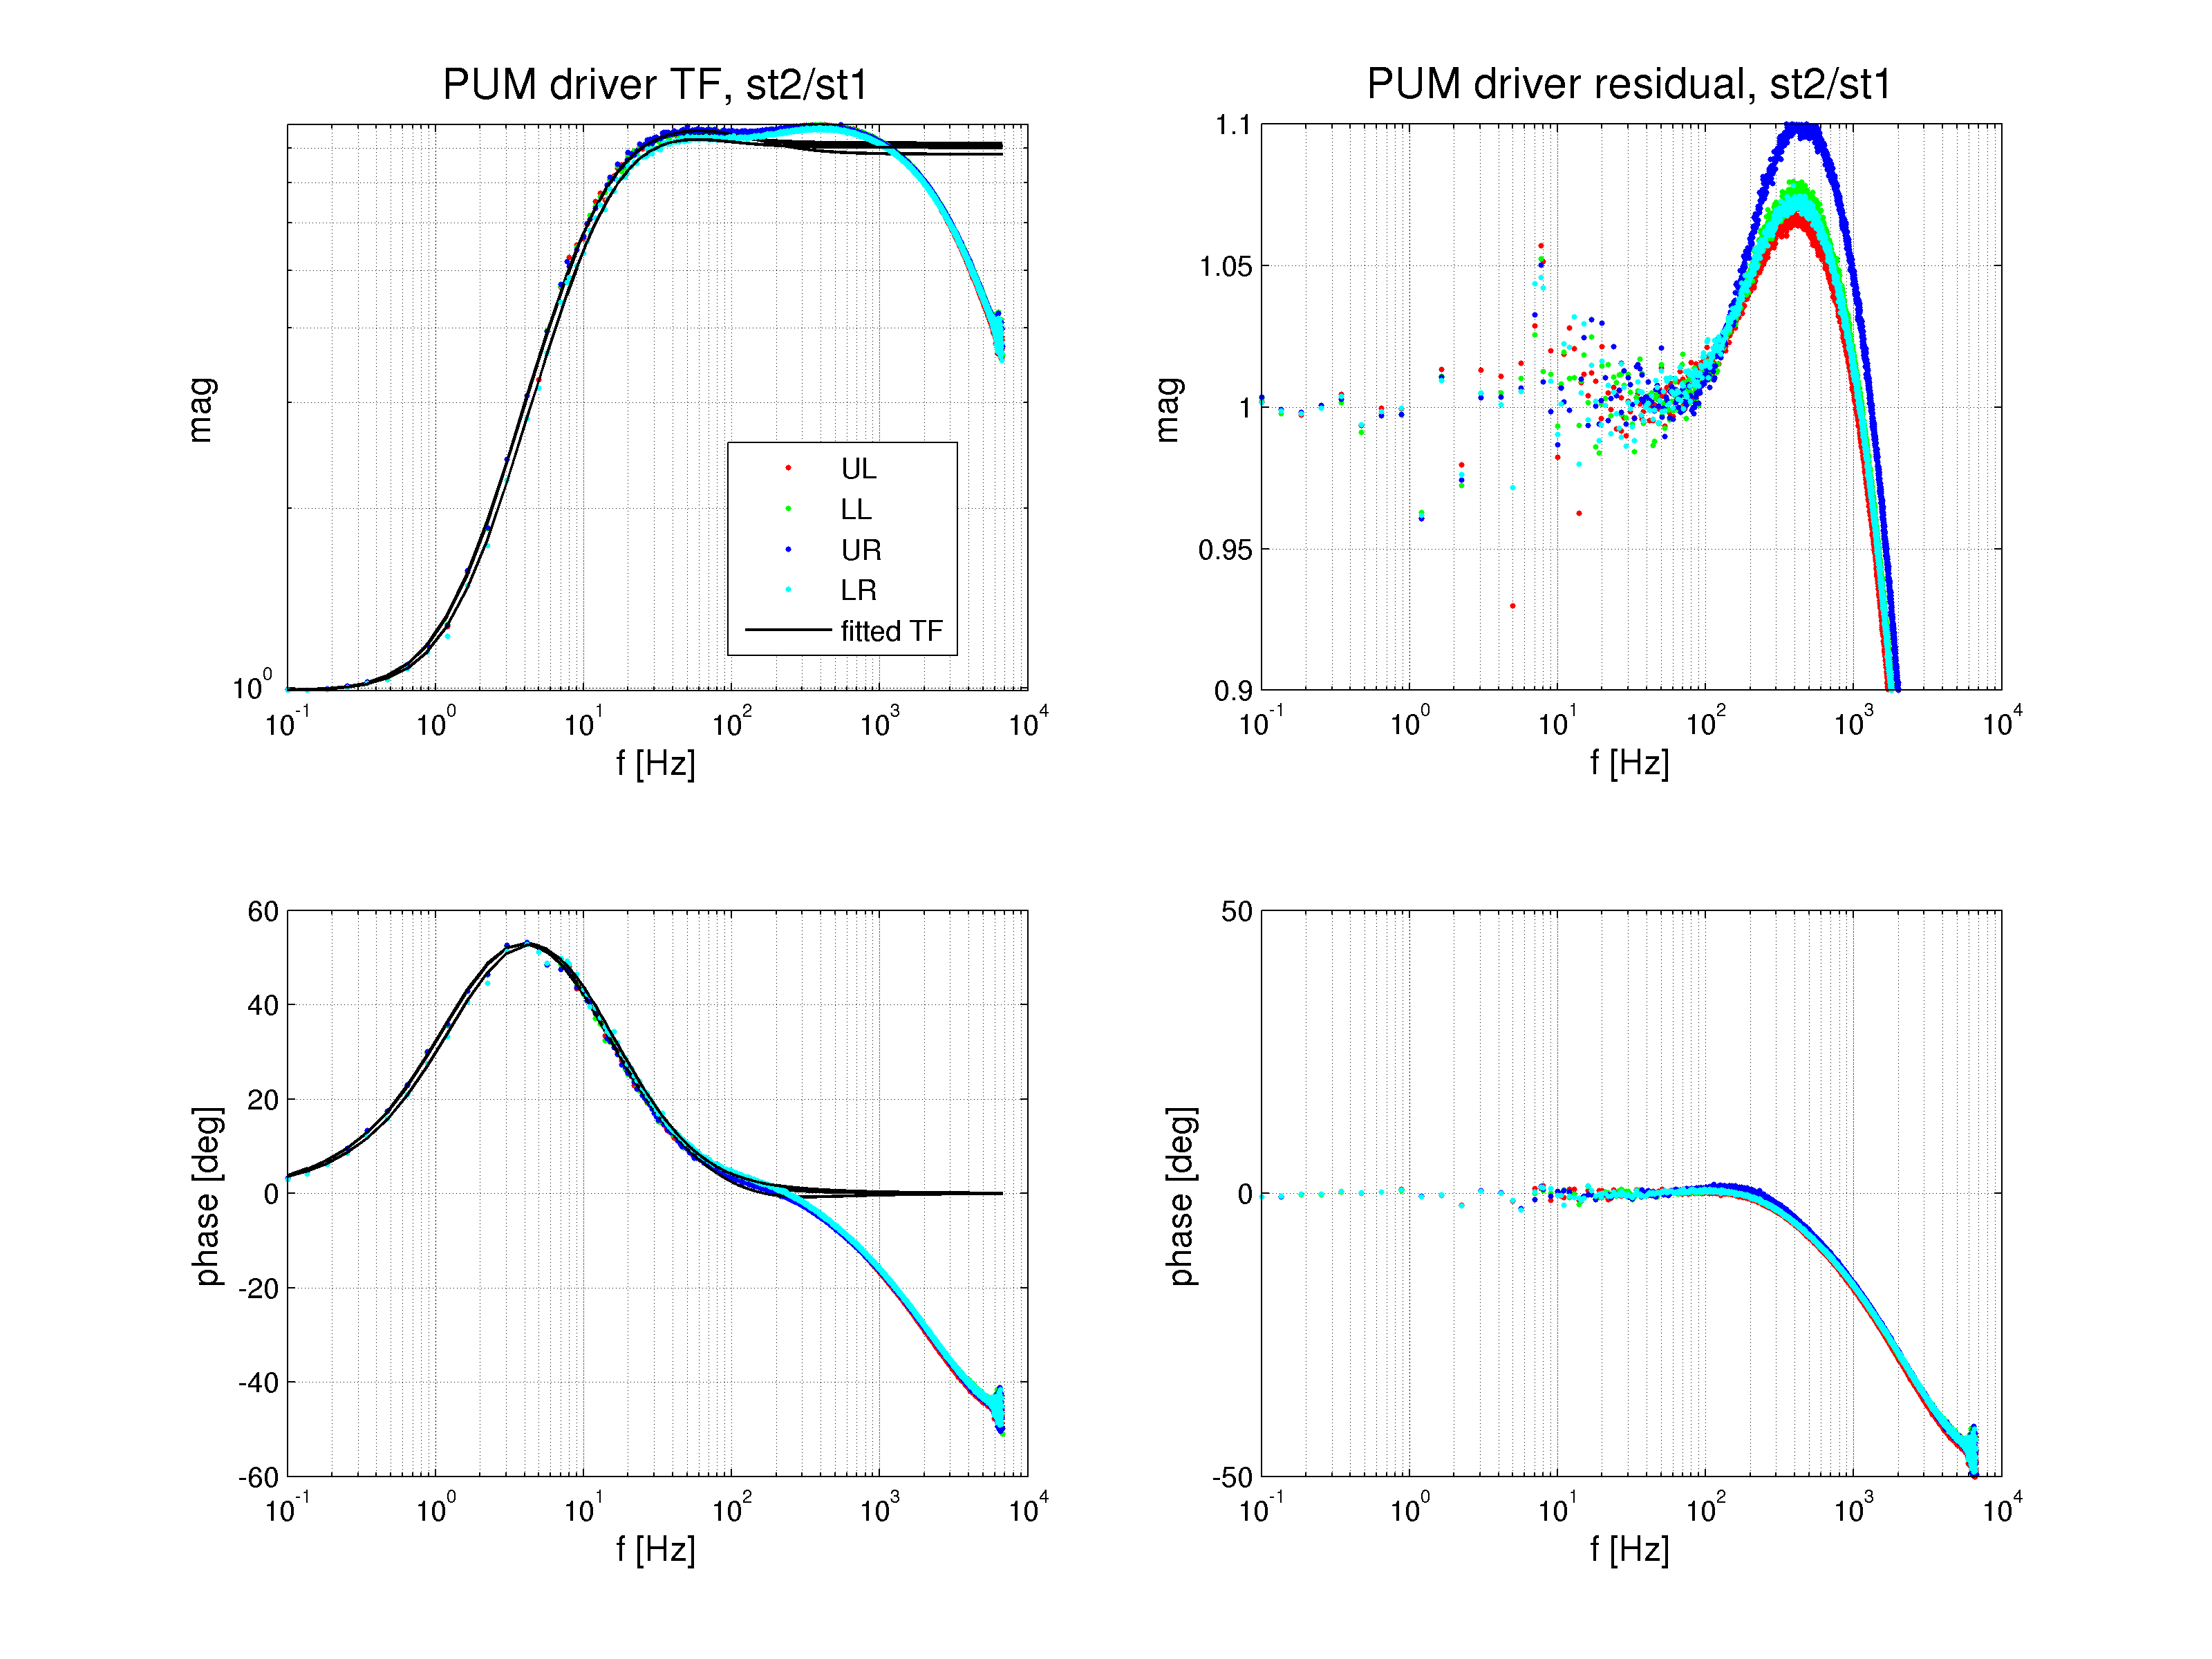
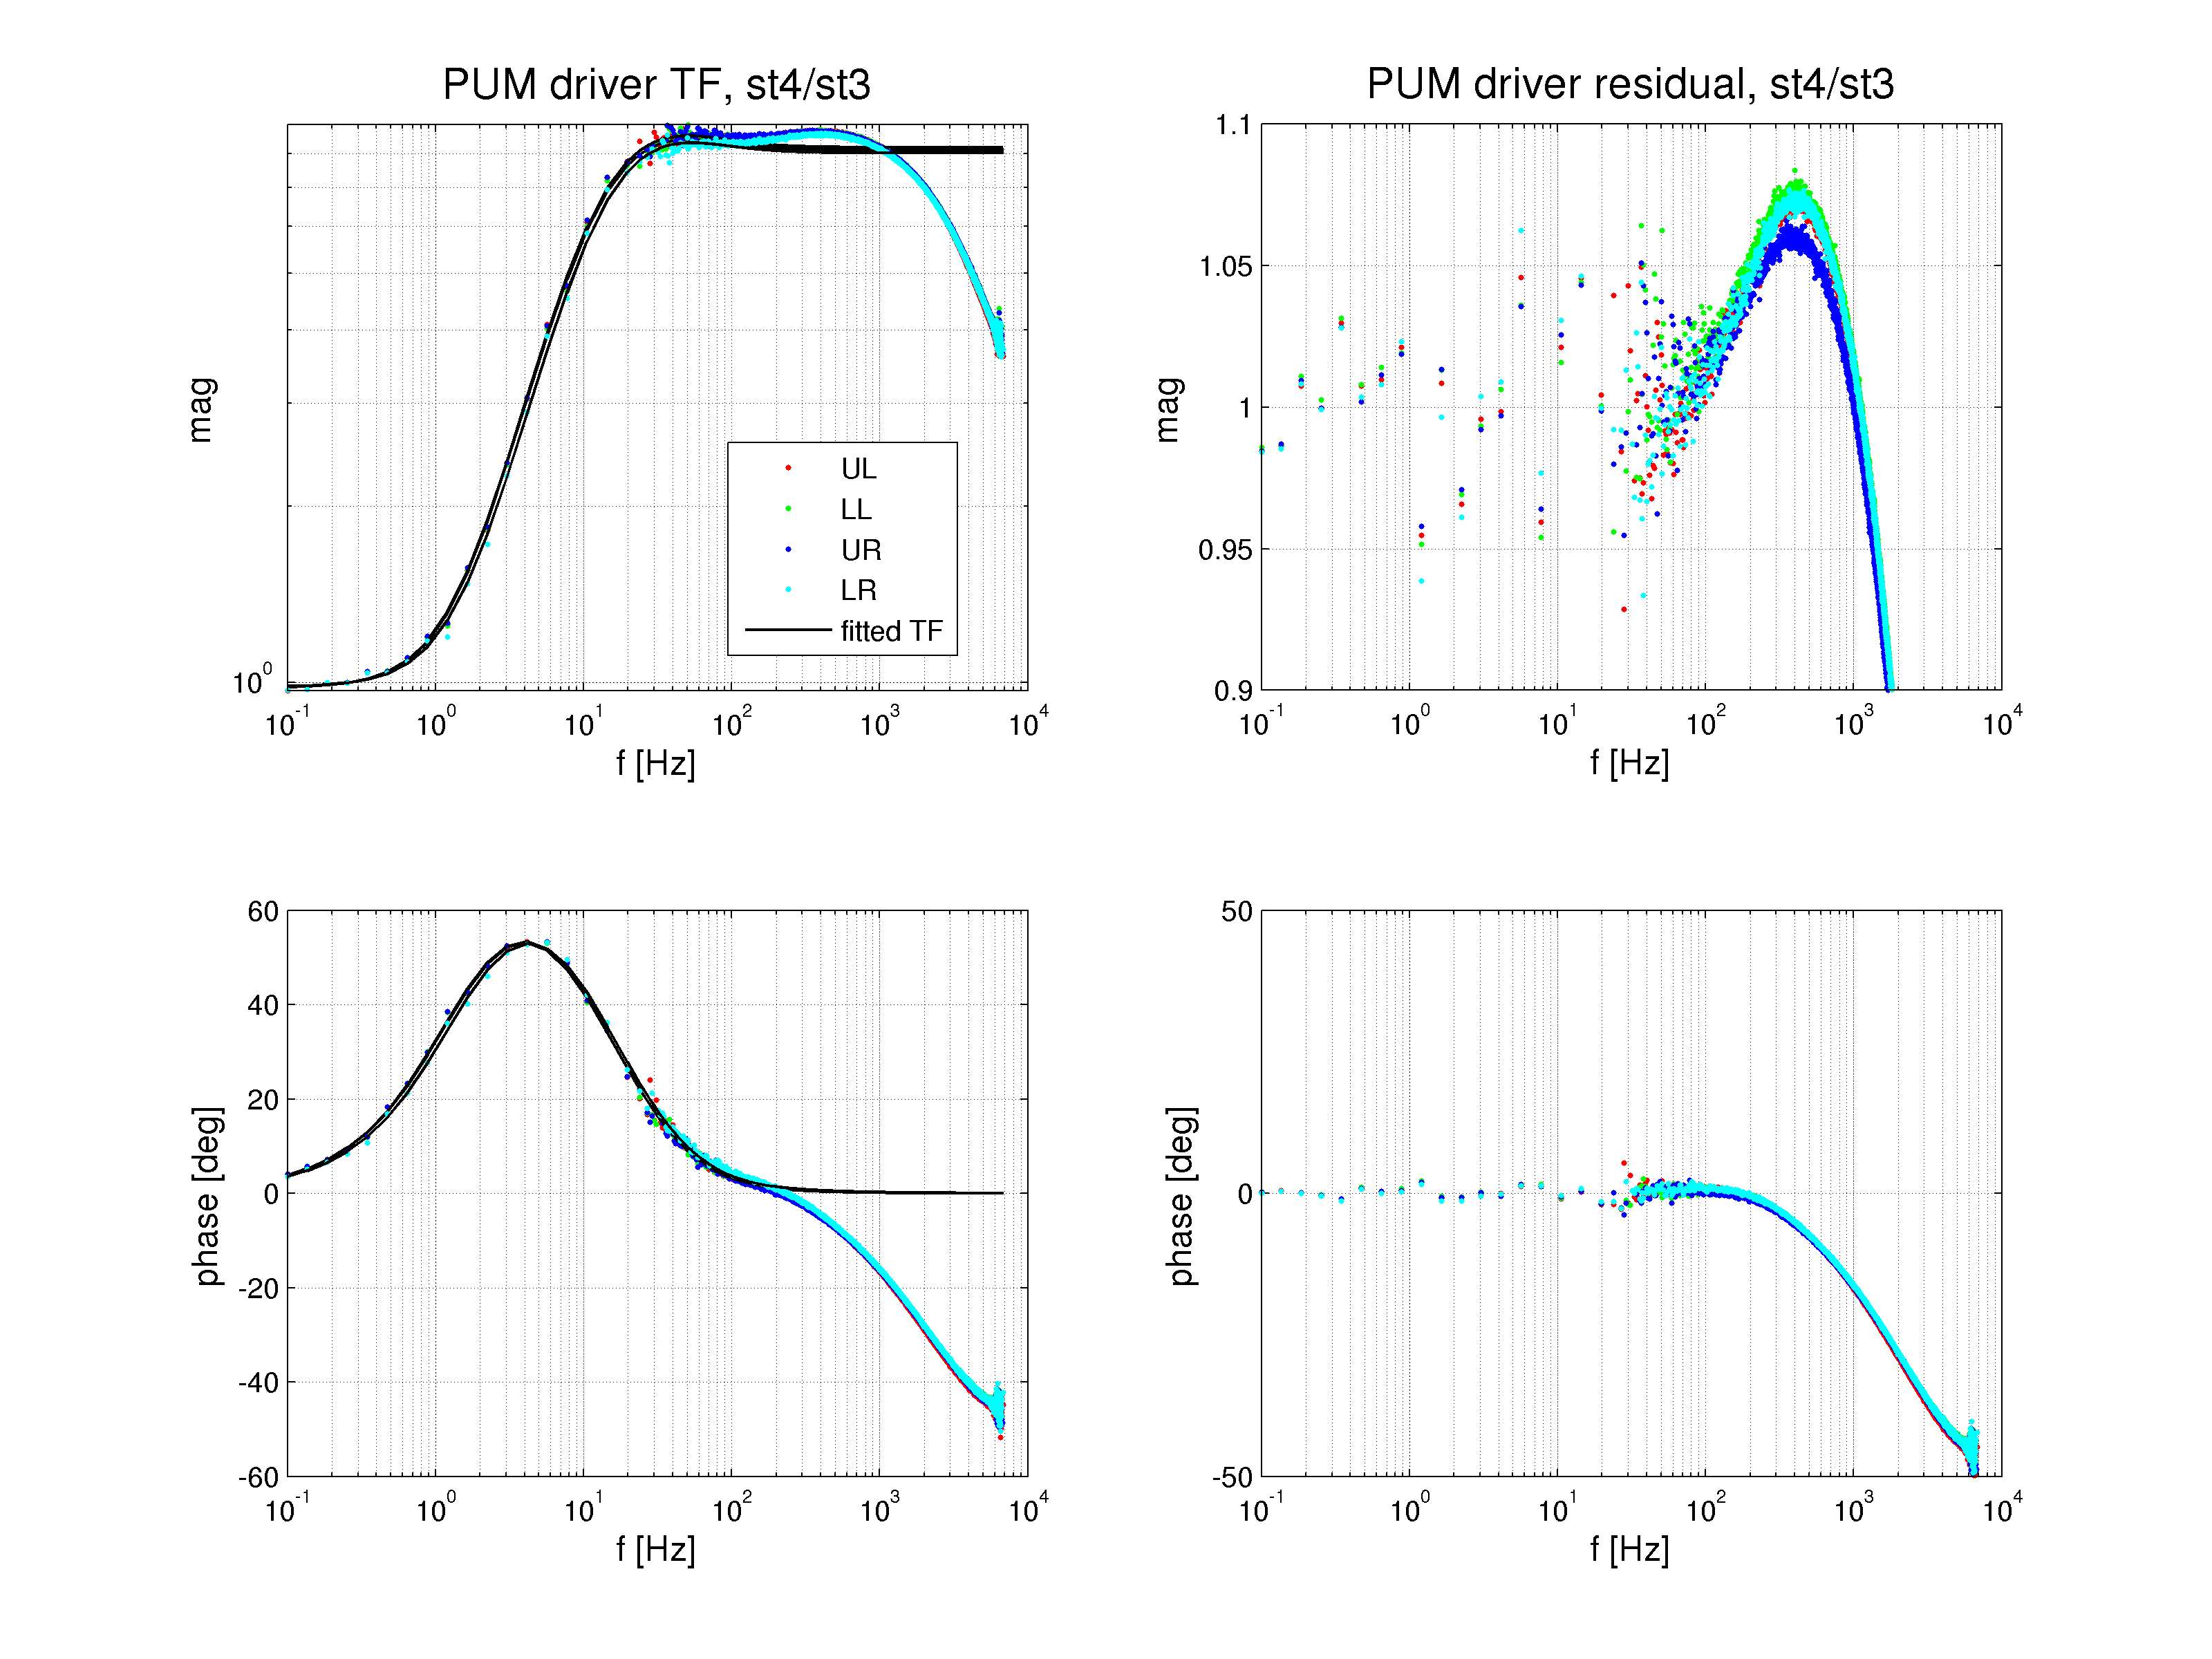
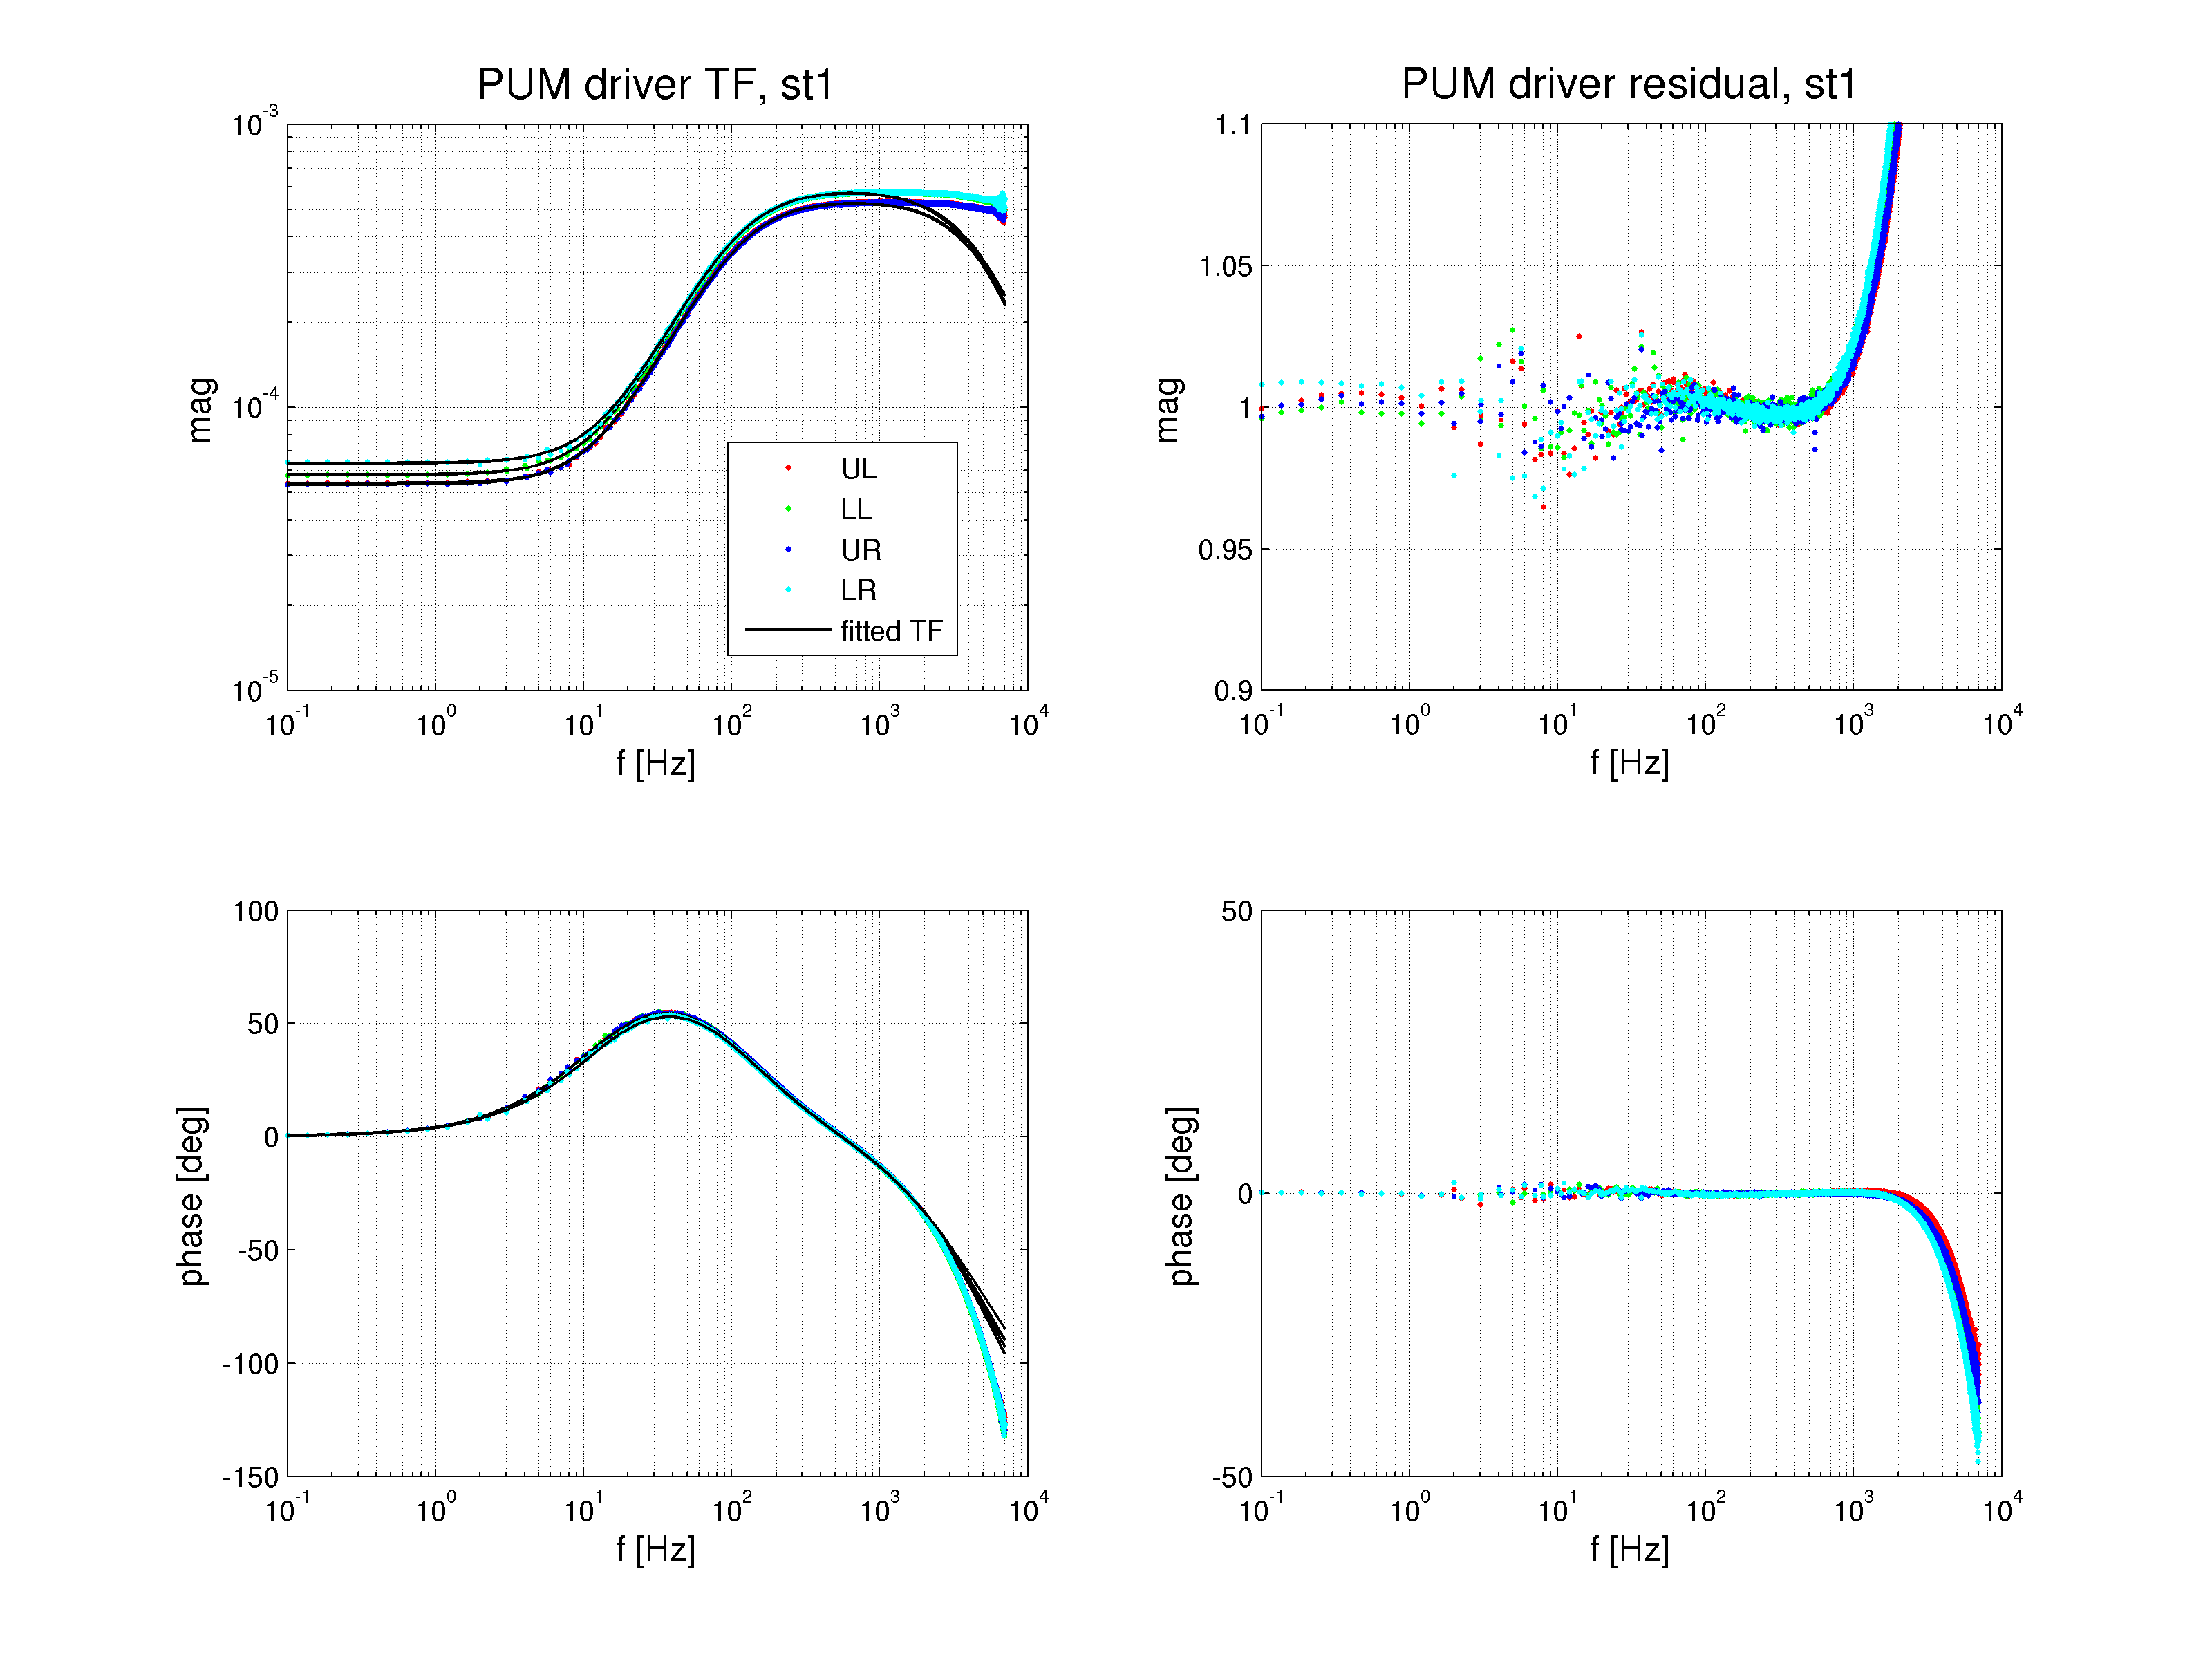
From the diagram given in T1100507 we can see that measred TFs of the low-pass filter can be isolated from all of the other frequency dependences by taking the TF ratios of State 3 / State 1 and State 4 / State2, and TF ratios of the acquisition circuit at two acq. bit states can be isolated by taking TF ratios of State 2 / State 1 and State 4 / State 3. The consistency between two different configurations (and the residuals between the two) can be seen in figures below:
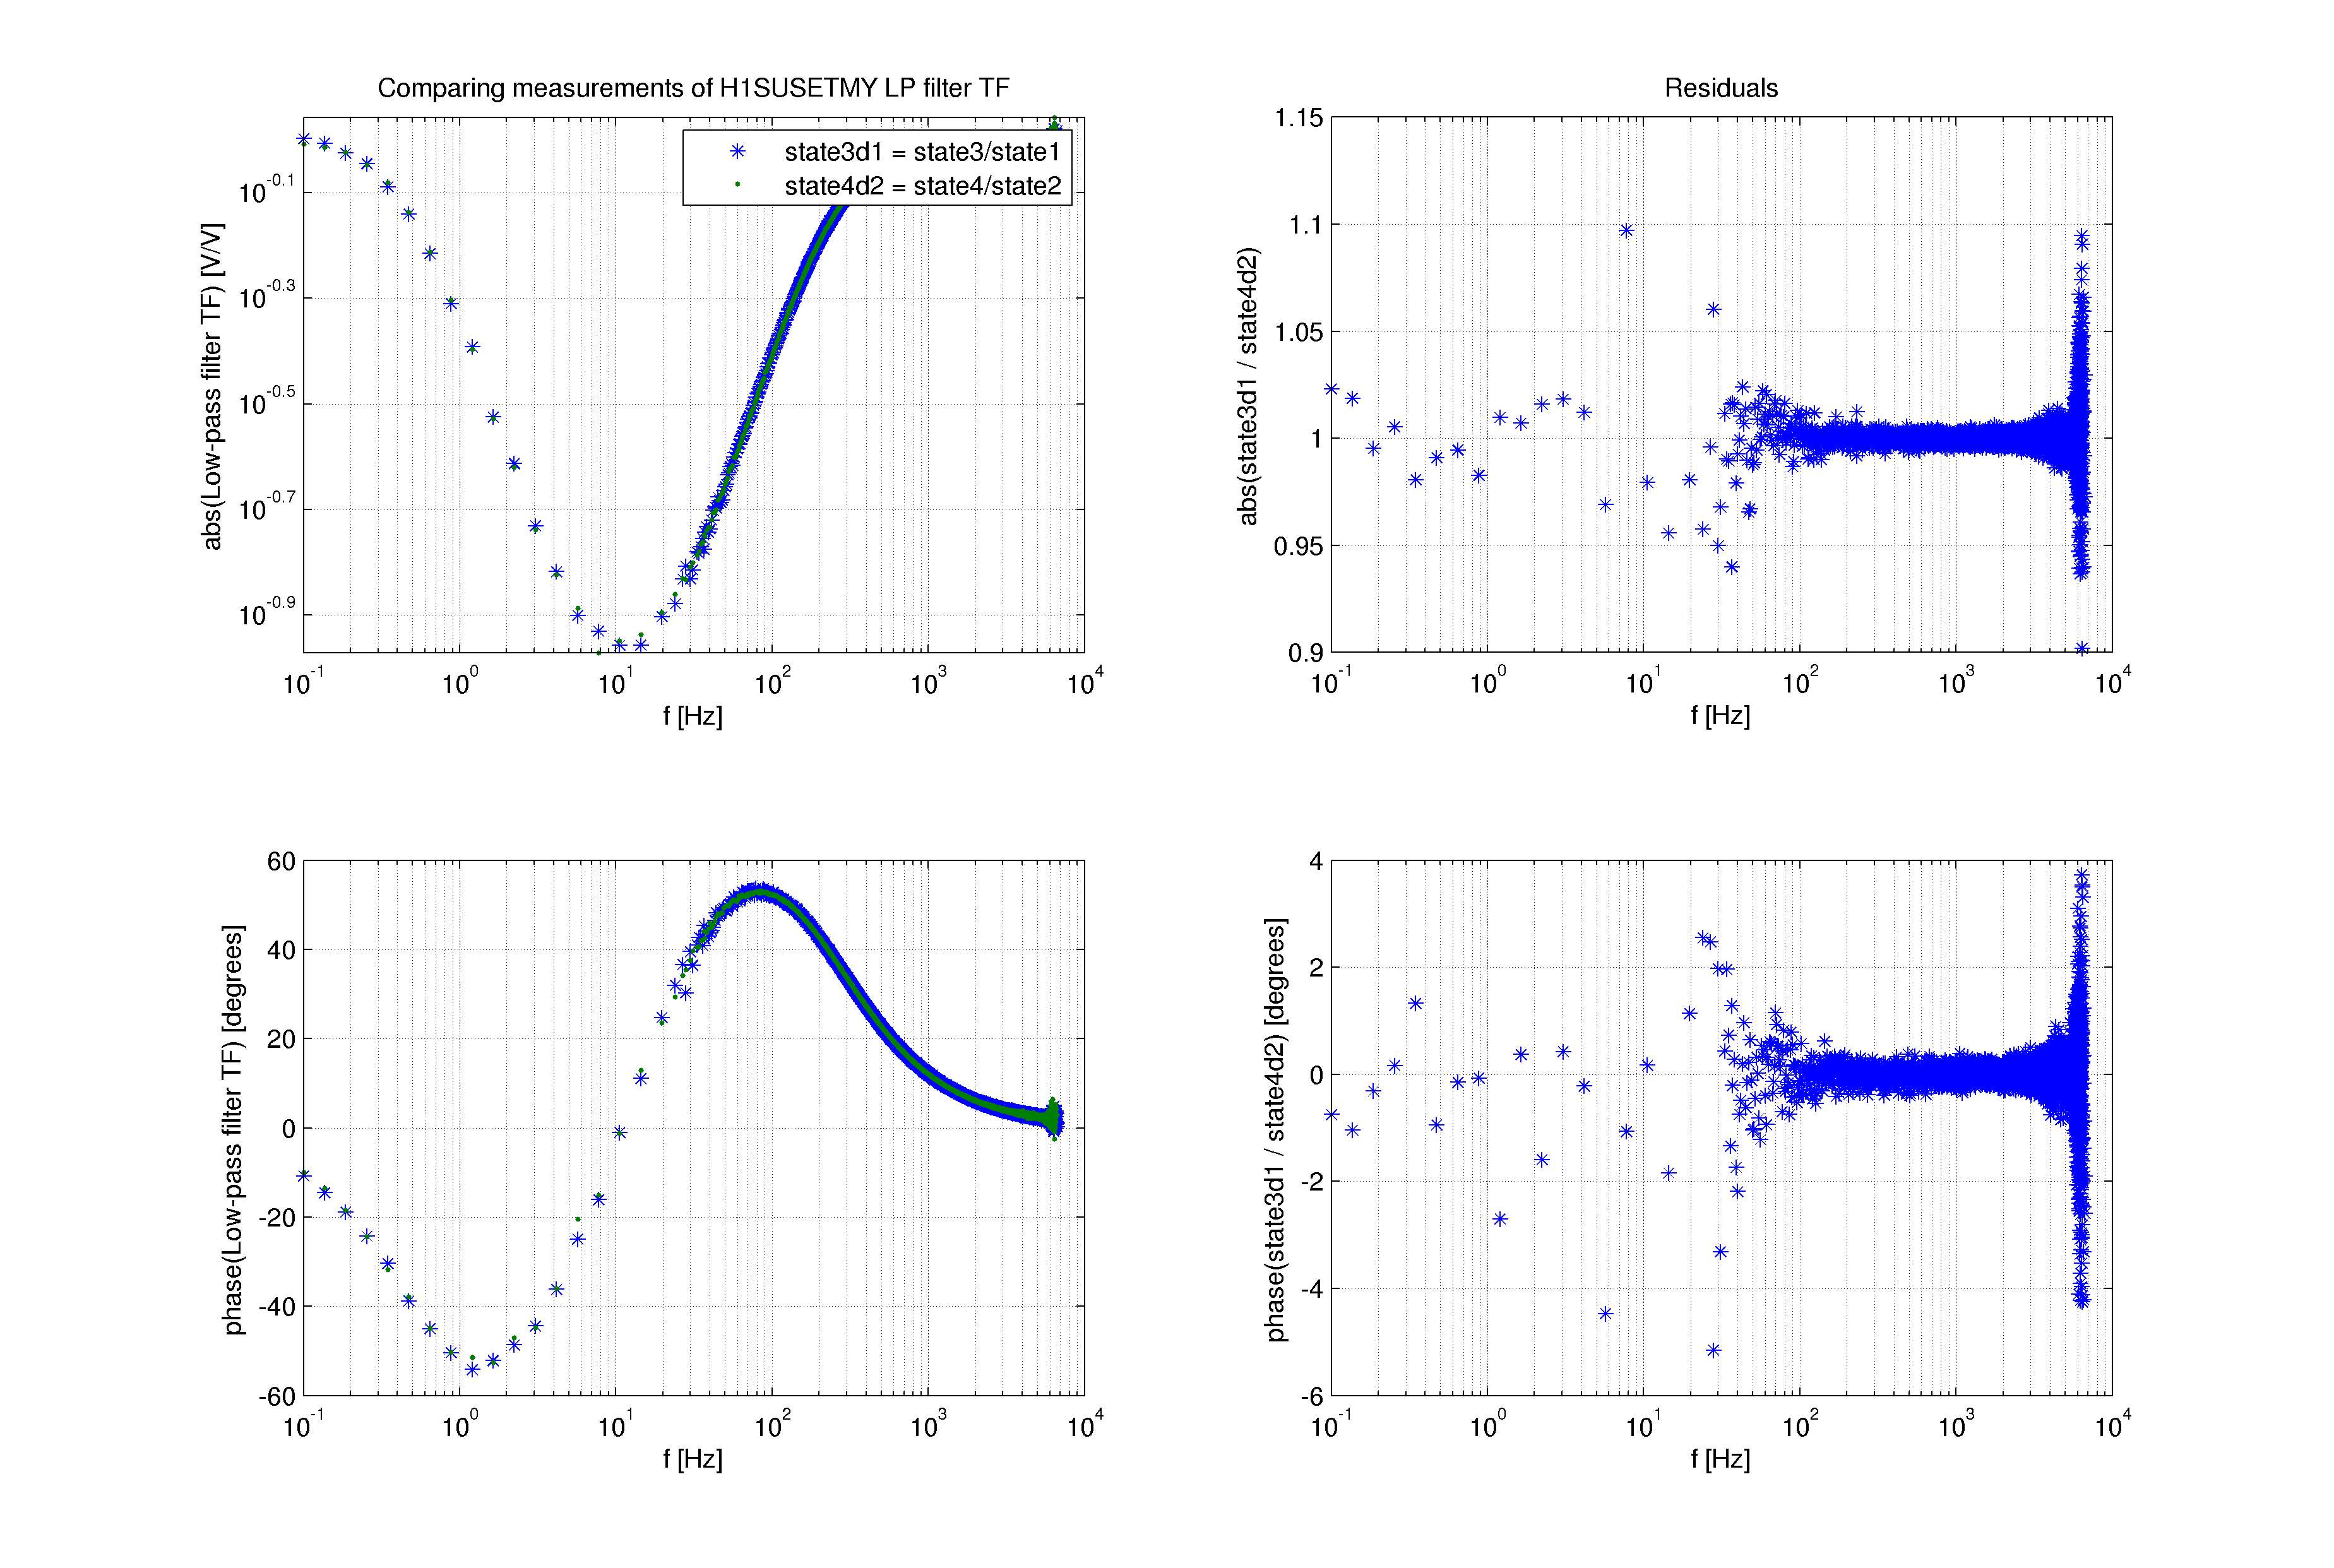
Low-Pass filter
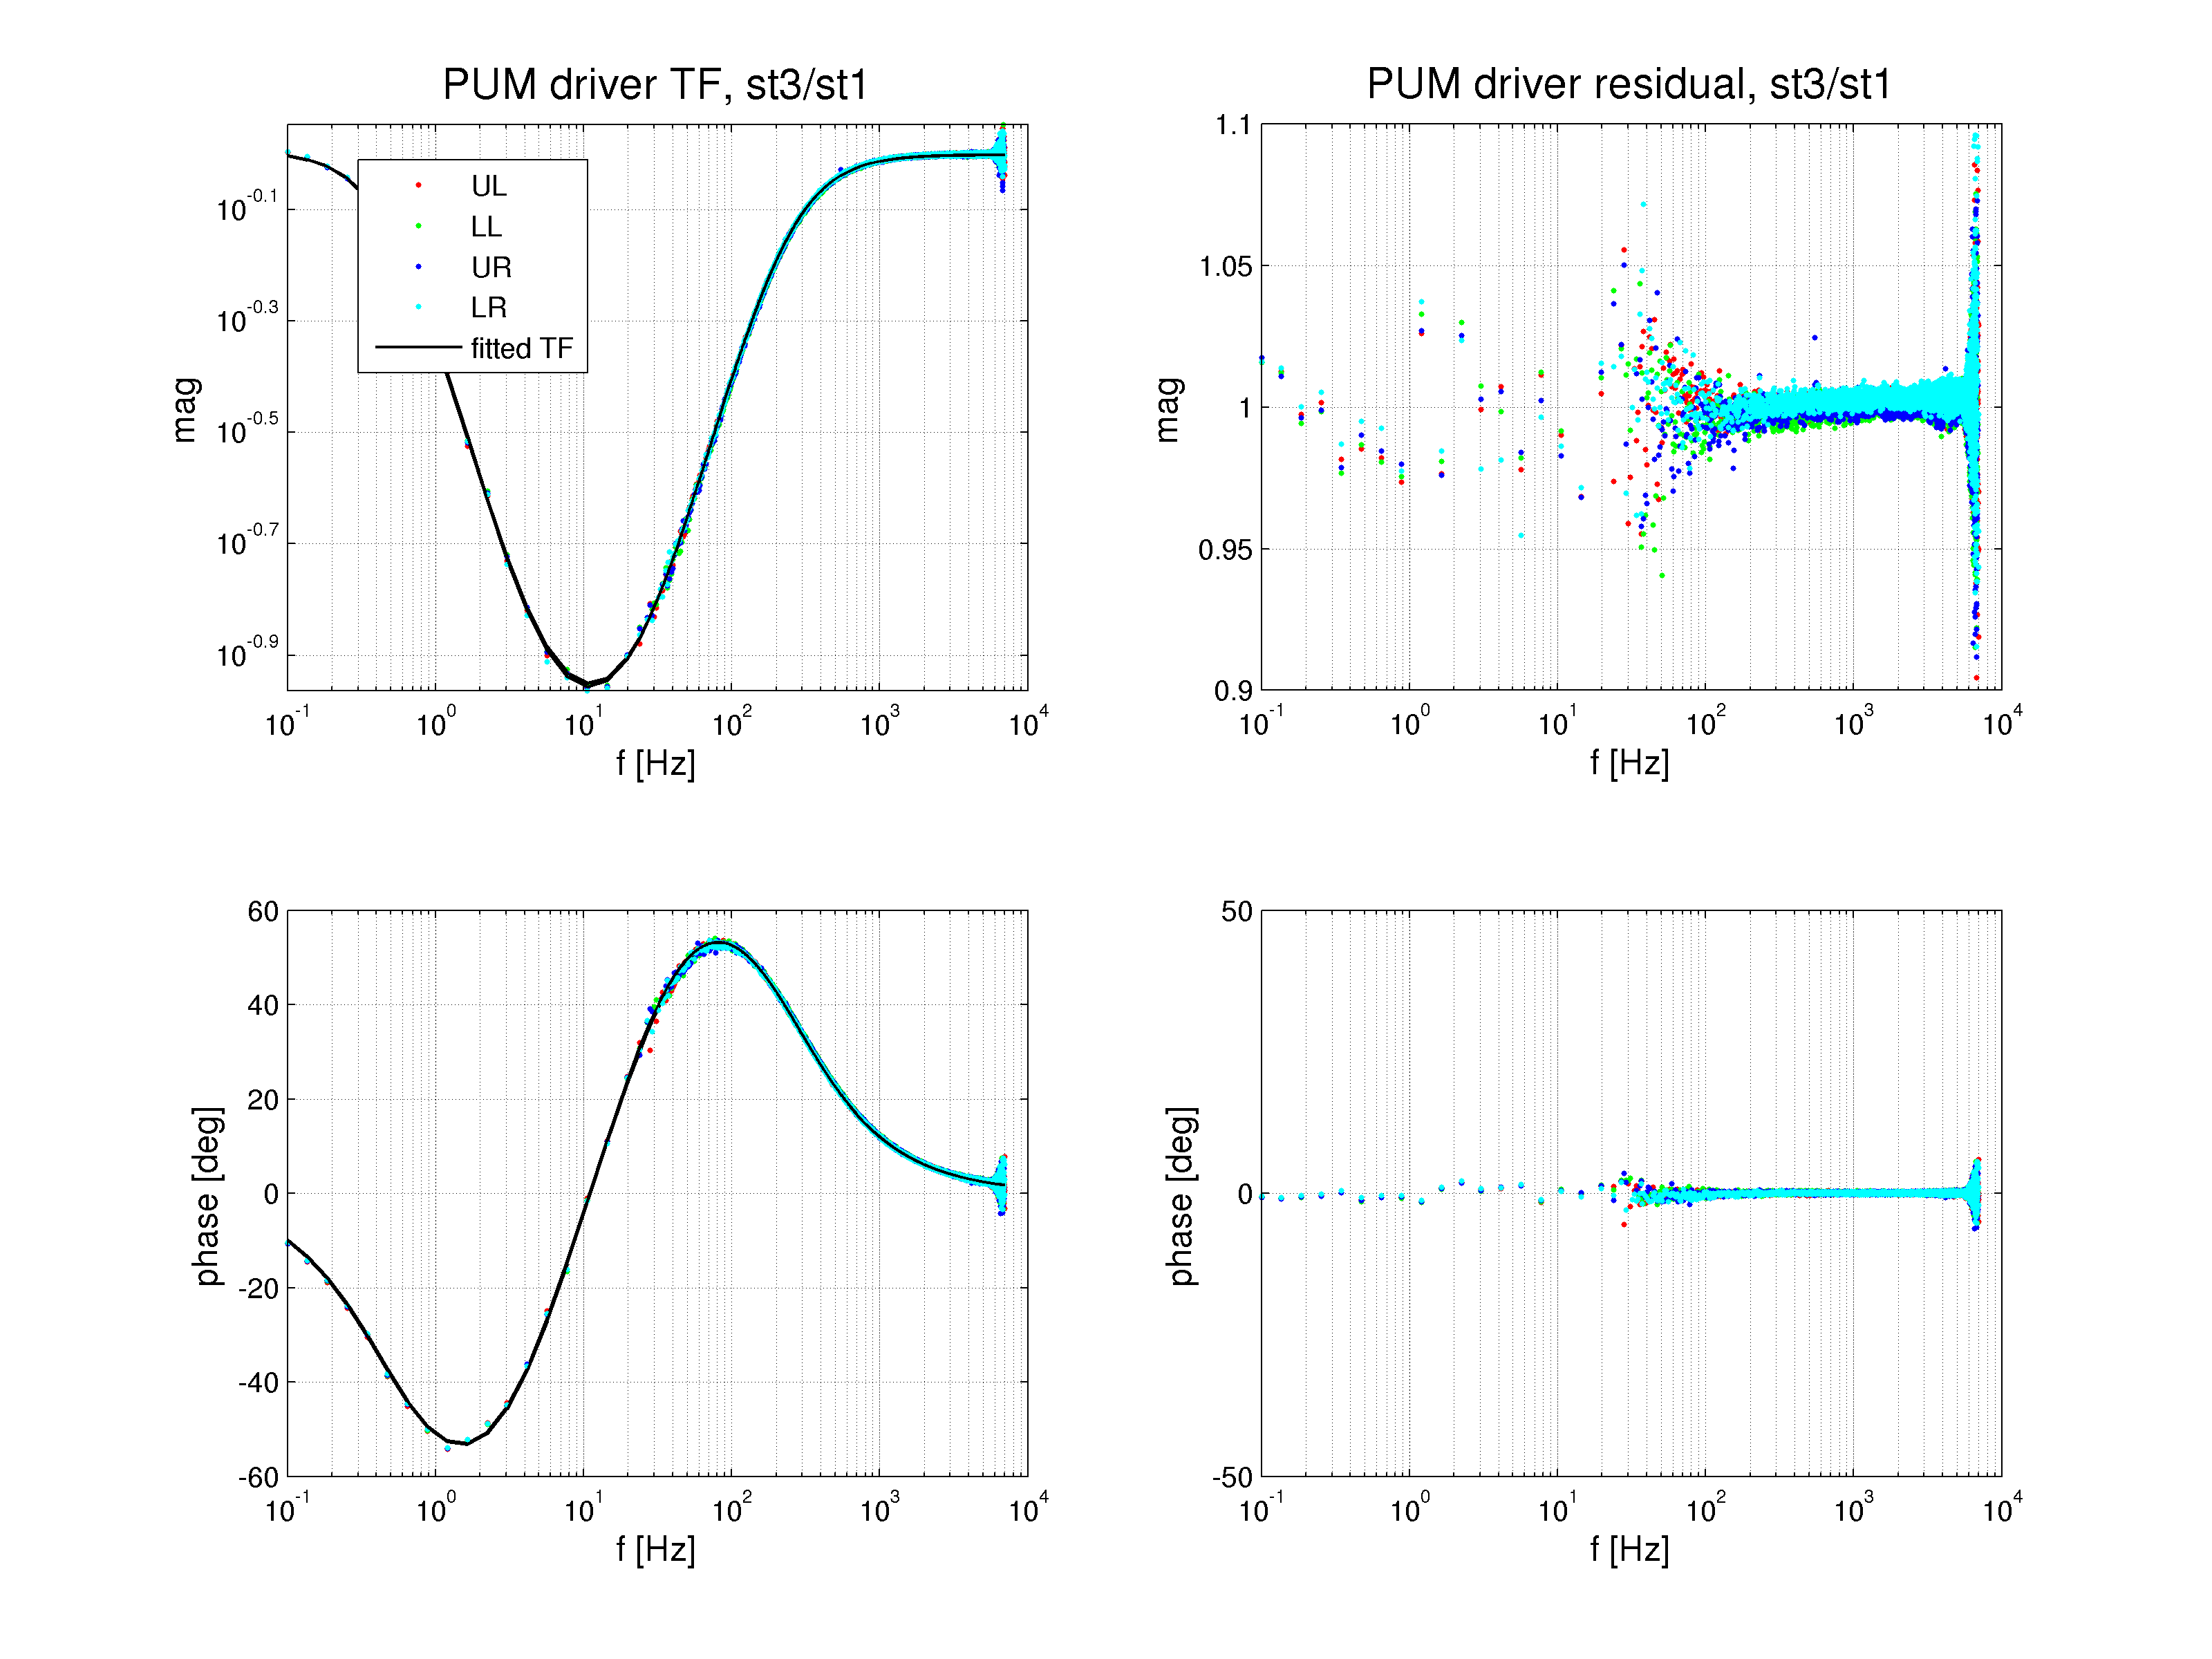
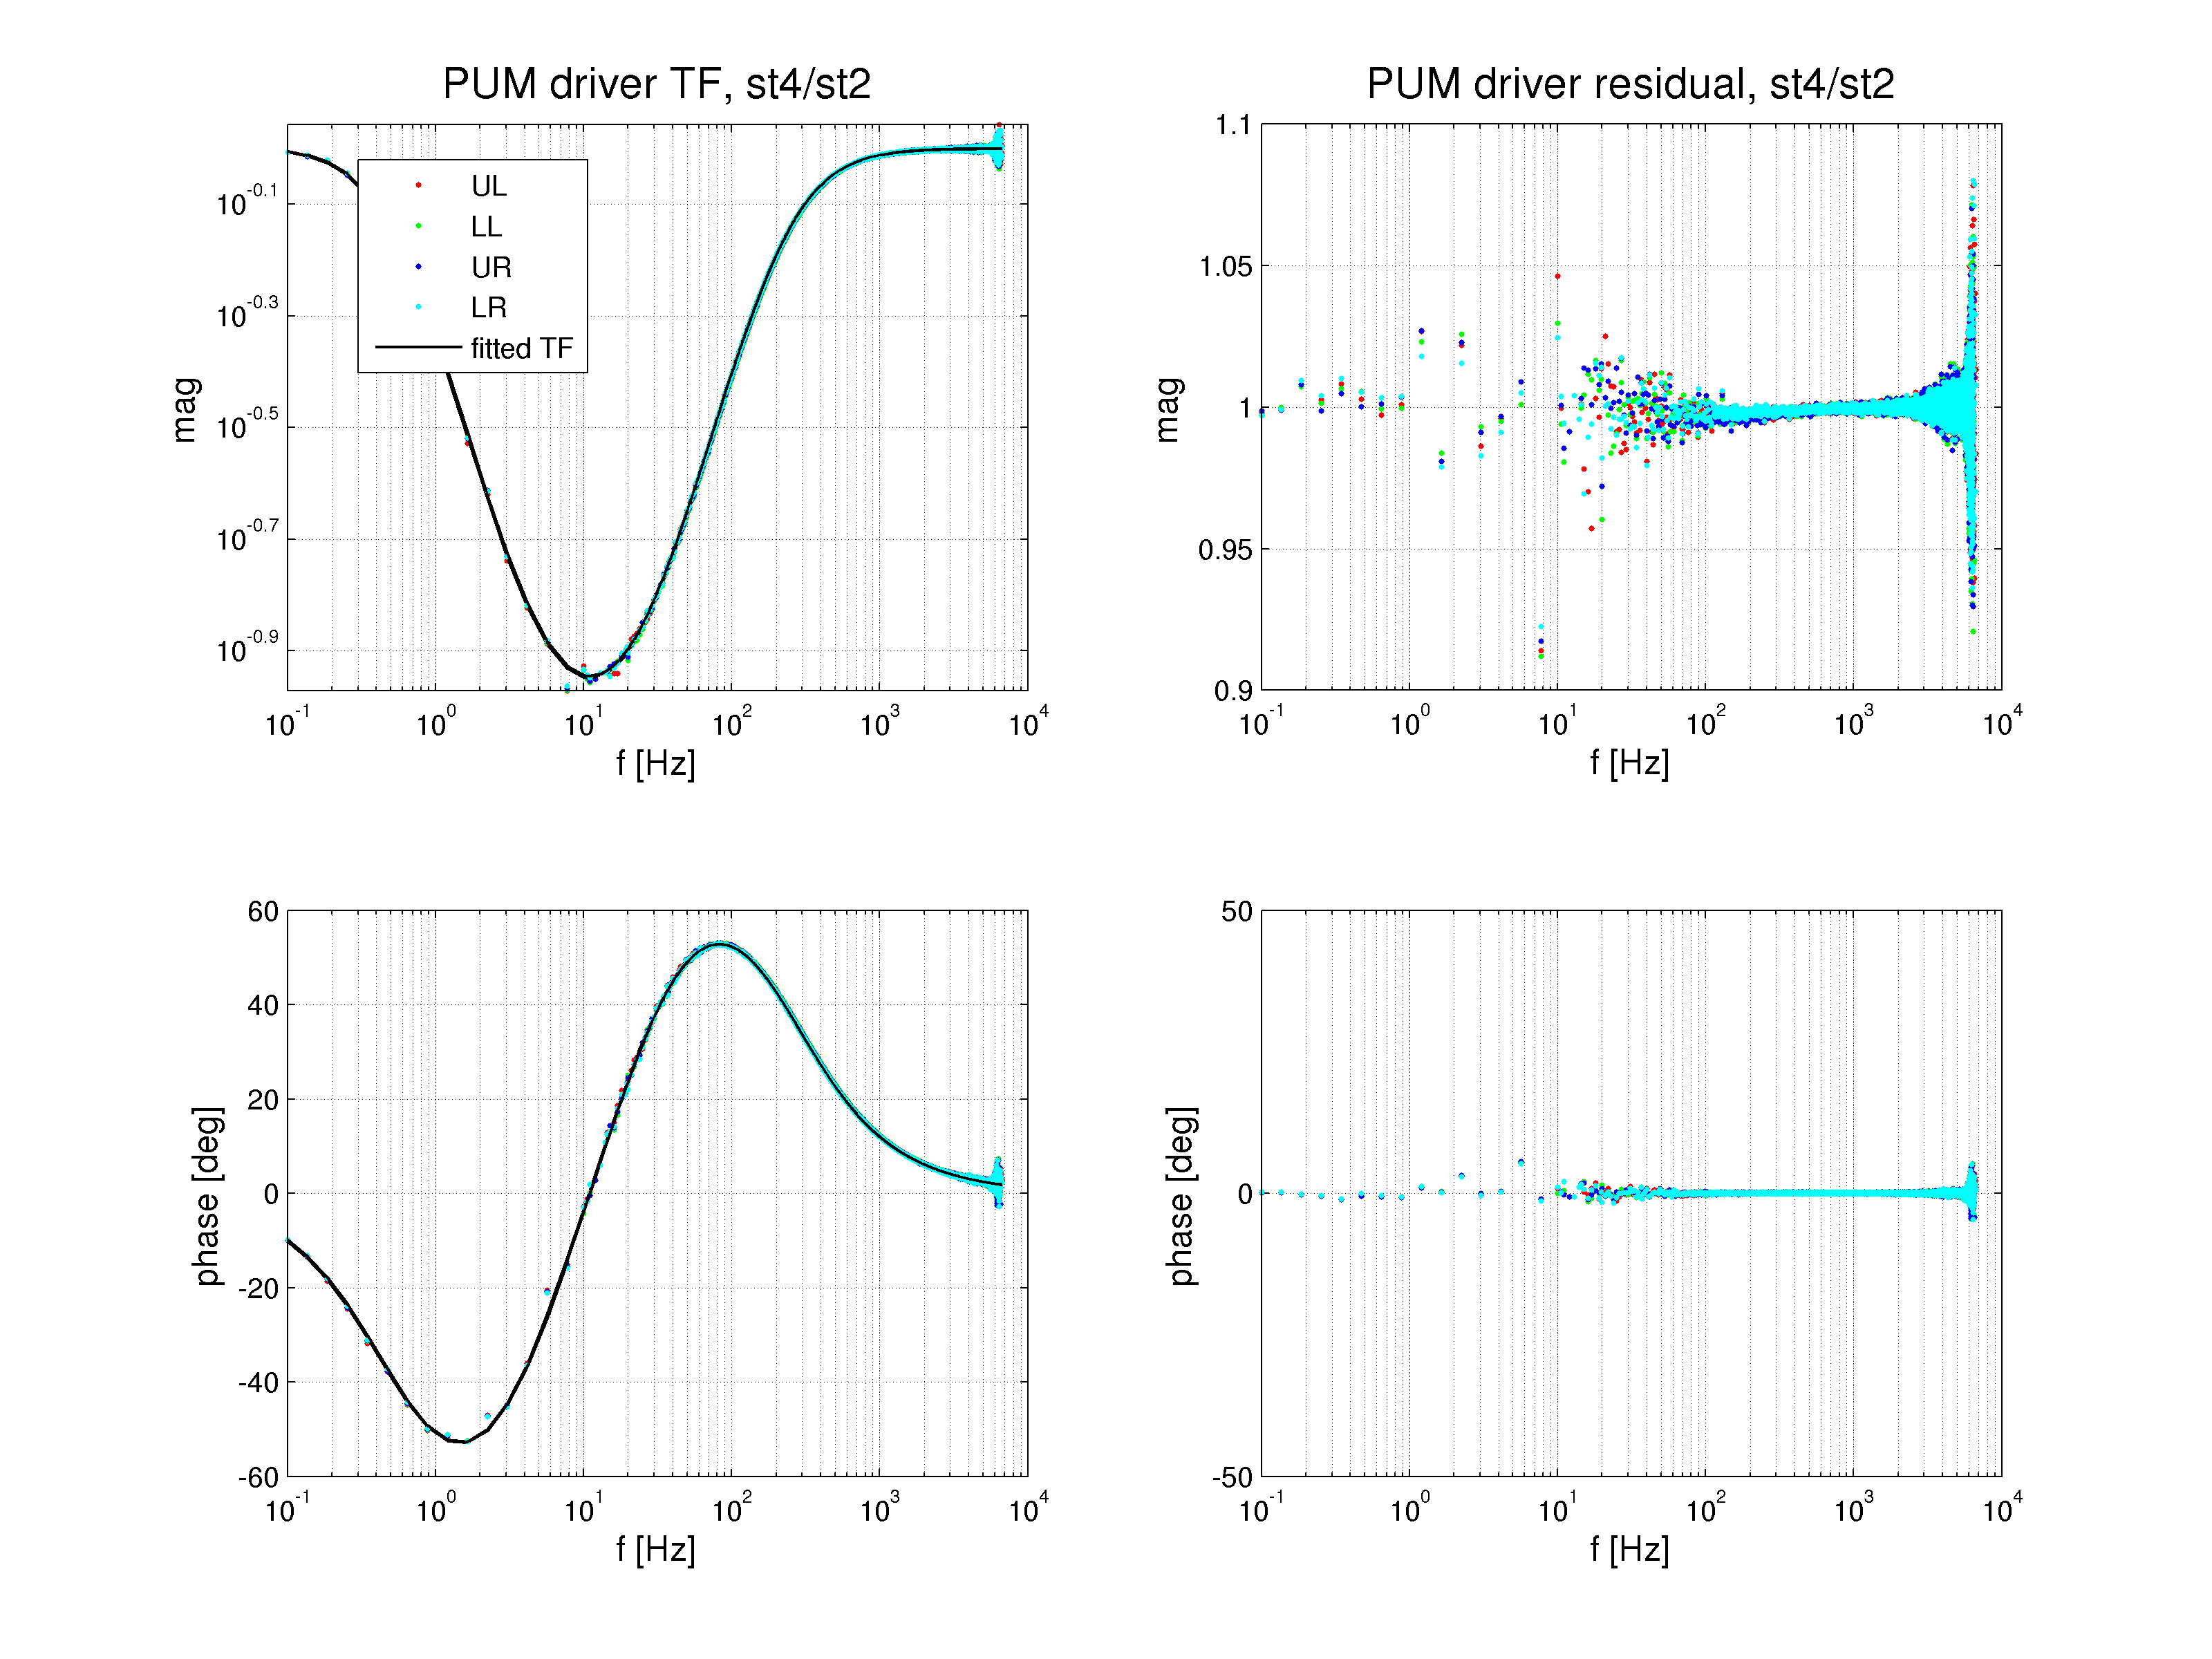
The fitted zeros and poles of the low-pass filter for each of the quadrants from two different TF ratio combitations (model) are given in table 2; plot of the model zero-pole TF vs. measurement and the residuals are shown in the plots under the table. Fitting was done on a logarithmically spaced frequency vector in range [0.1 1200] Hz.
Table 2. H1:SUSETMY-PUM driver LP1 fit details
========================================================================================================
Measurement Fitted LP1 and fit uncertainty
( z : p ) [Hz]
--------------------------------------------------------------------------------------------------------
UL: St. 3 TF / St. 1 TF ( 5.71 +/- 0.19 %, 21.20 +/- 0.19 % : 0.50 +/- 0.13 %, 240.90 +/- 0.13 % )
UL: St. 4 TF / St. 2 TF ( 5.51 +/- 0.20 %, 21.67 +/- 0.20 % : 0.49 +/- 0.14 %, 240.80 +/- 0.14 % )
UL: weighted mean ( 5.62 +/- 0.14 %, 21.41 +/- 0.14 % : 0.50 +/- 0.09 %, 240.86 +/- 0.09 % )
LL: St. 3 TF / St. 1 TF ( 5.77 +/- 0.20 %, 21.54 +/- 0.20 % : 0.51 +/- 0.13 %, 242.55 +/- 0.13 % )
LL: St. 4 TF / St. 2 TF ( 5.63 +/- 0.21 %, 21.80 +/- 0.21 % : 0.50 +/- 0.15 %, 243.15 +/- 0.15 % )
LL: weighted mean ( 5.70 +/- 0.14 %, 21.66 +/- 0.14 % : 0.50 +/- 0.10 %, 242.82 +/- 0.10 % )
UR: St. 3 TF / St. 1 TF ( 5.81 +/- 0.19 %, 21.22 +/- 0.19 % : 0.51 +/- 0.12 %, 241.16 +/- 0.13 % )
UR: St. 4 TF / St. 2 TF ( 5.65 +/- 0.21 %, 21.59 +/- 0.21 % : 0.50 +/- 0.15 %, 241.14 +/- 0.15 % )
UR: weighted mean ( 5.74 +/- 0.14 %, 21.38 +/- 0.14 % : 0.50 +/- 0.10 %, 241.15 +/- 0.10 % )
LR: St. 3 TF / St. 1 TF ( 5.94 +/- 0.19 %, 20.58 +/- 0.19 % : 0.50 +/- 0.12 %, 239.00 +/- 0.12 % )
LR: St. 4 TF / St. 2 TF ( 5.63 +/- 0.19 %, 21.66 +/- 0.19 % : 0.50 +/- 0.13 %, 240.12 +/- 0.13 % )
LR: weighted mean ( 5.78 +/- 0.14 %, 21.09 +/- 0.14 % : 0.50 +/- 0.09 %, 239.51 +/- 0.09 % )
========================================================================================================
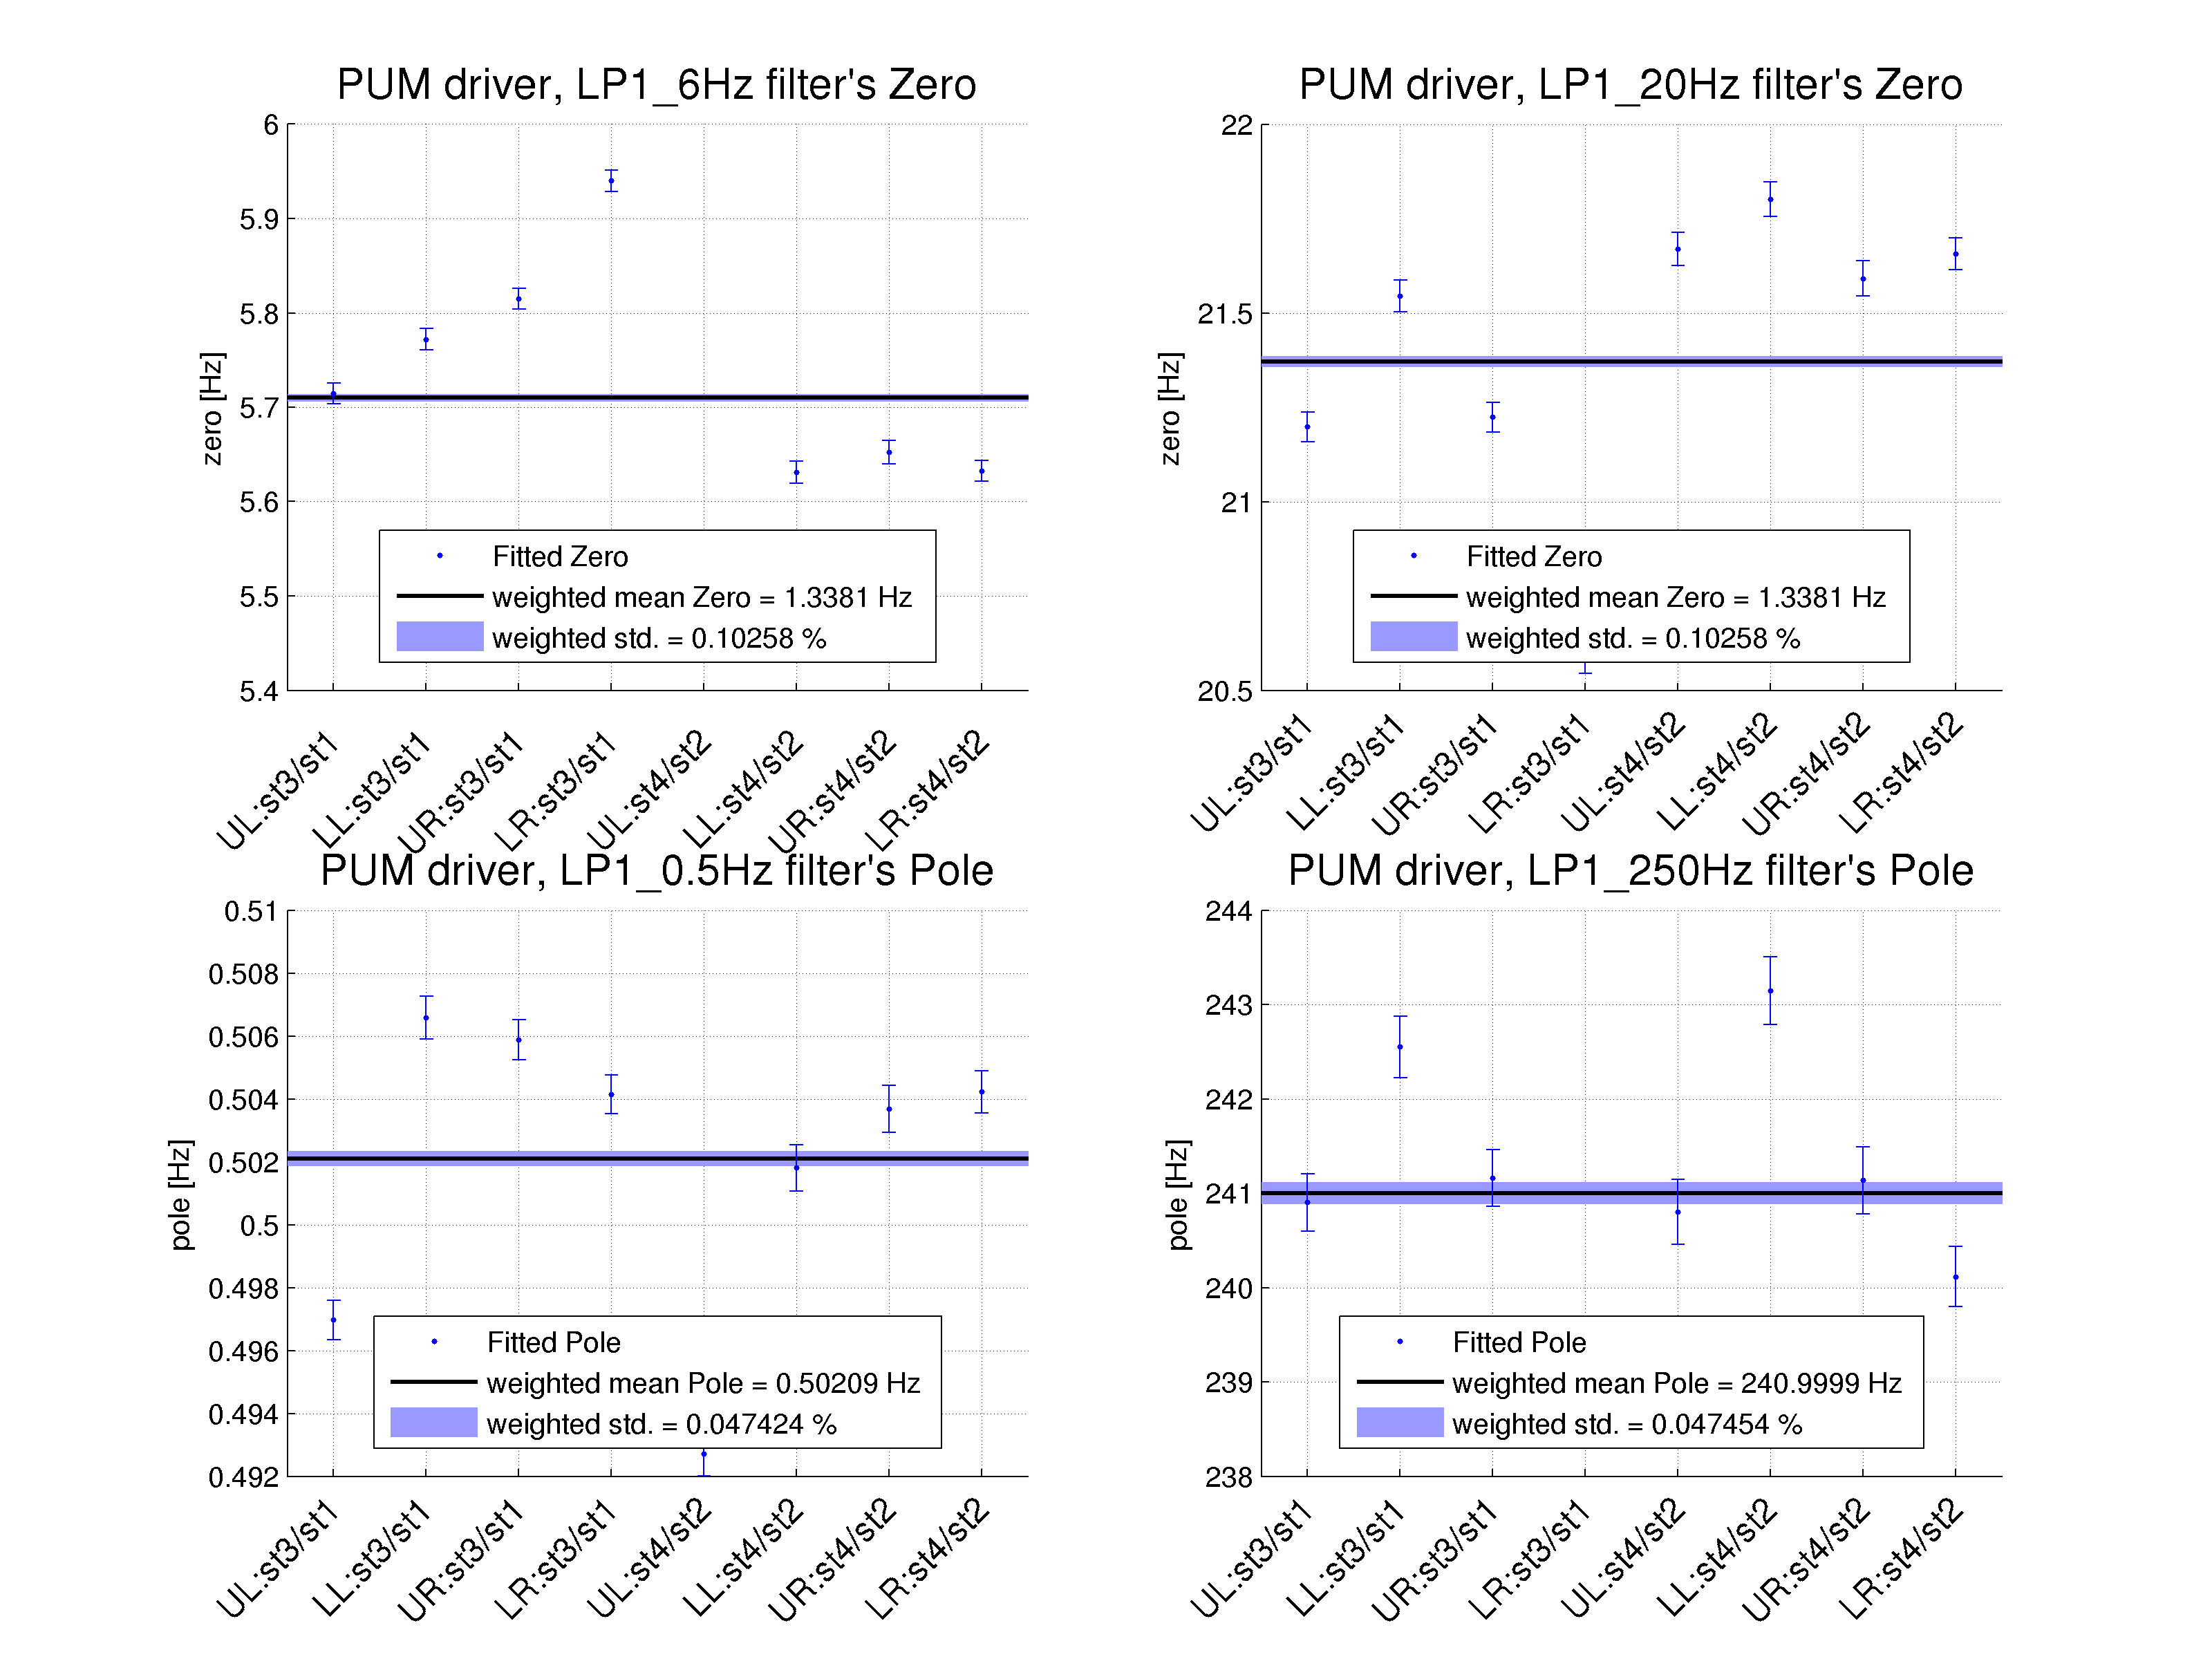
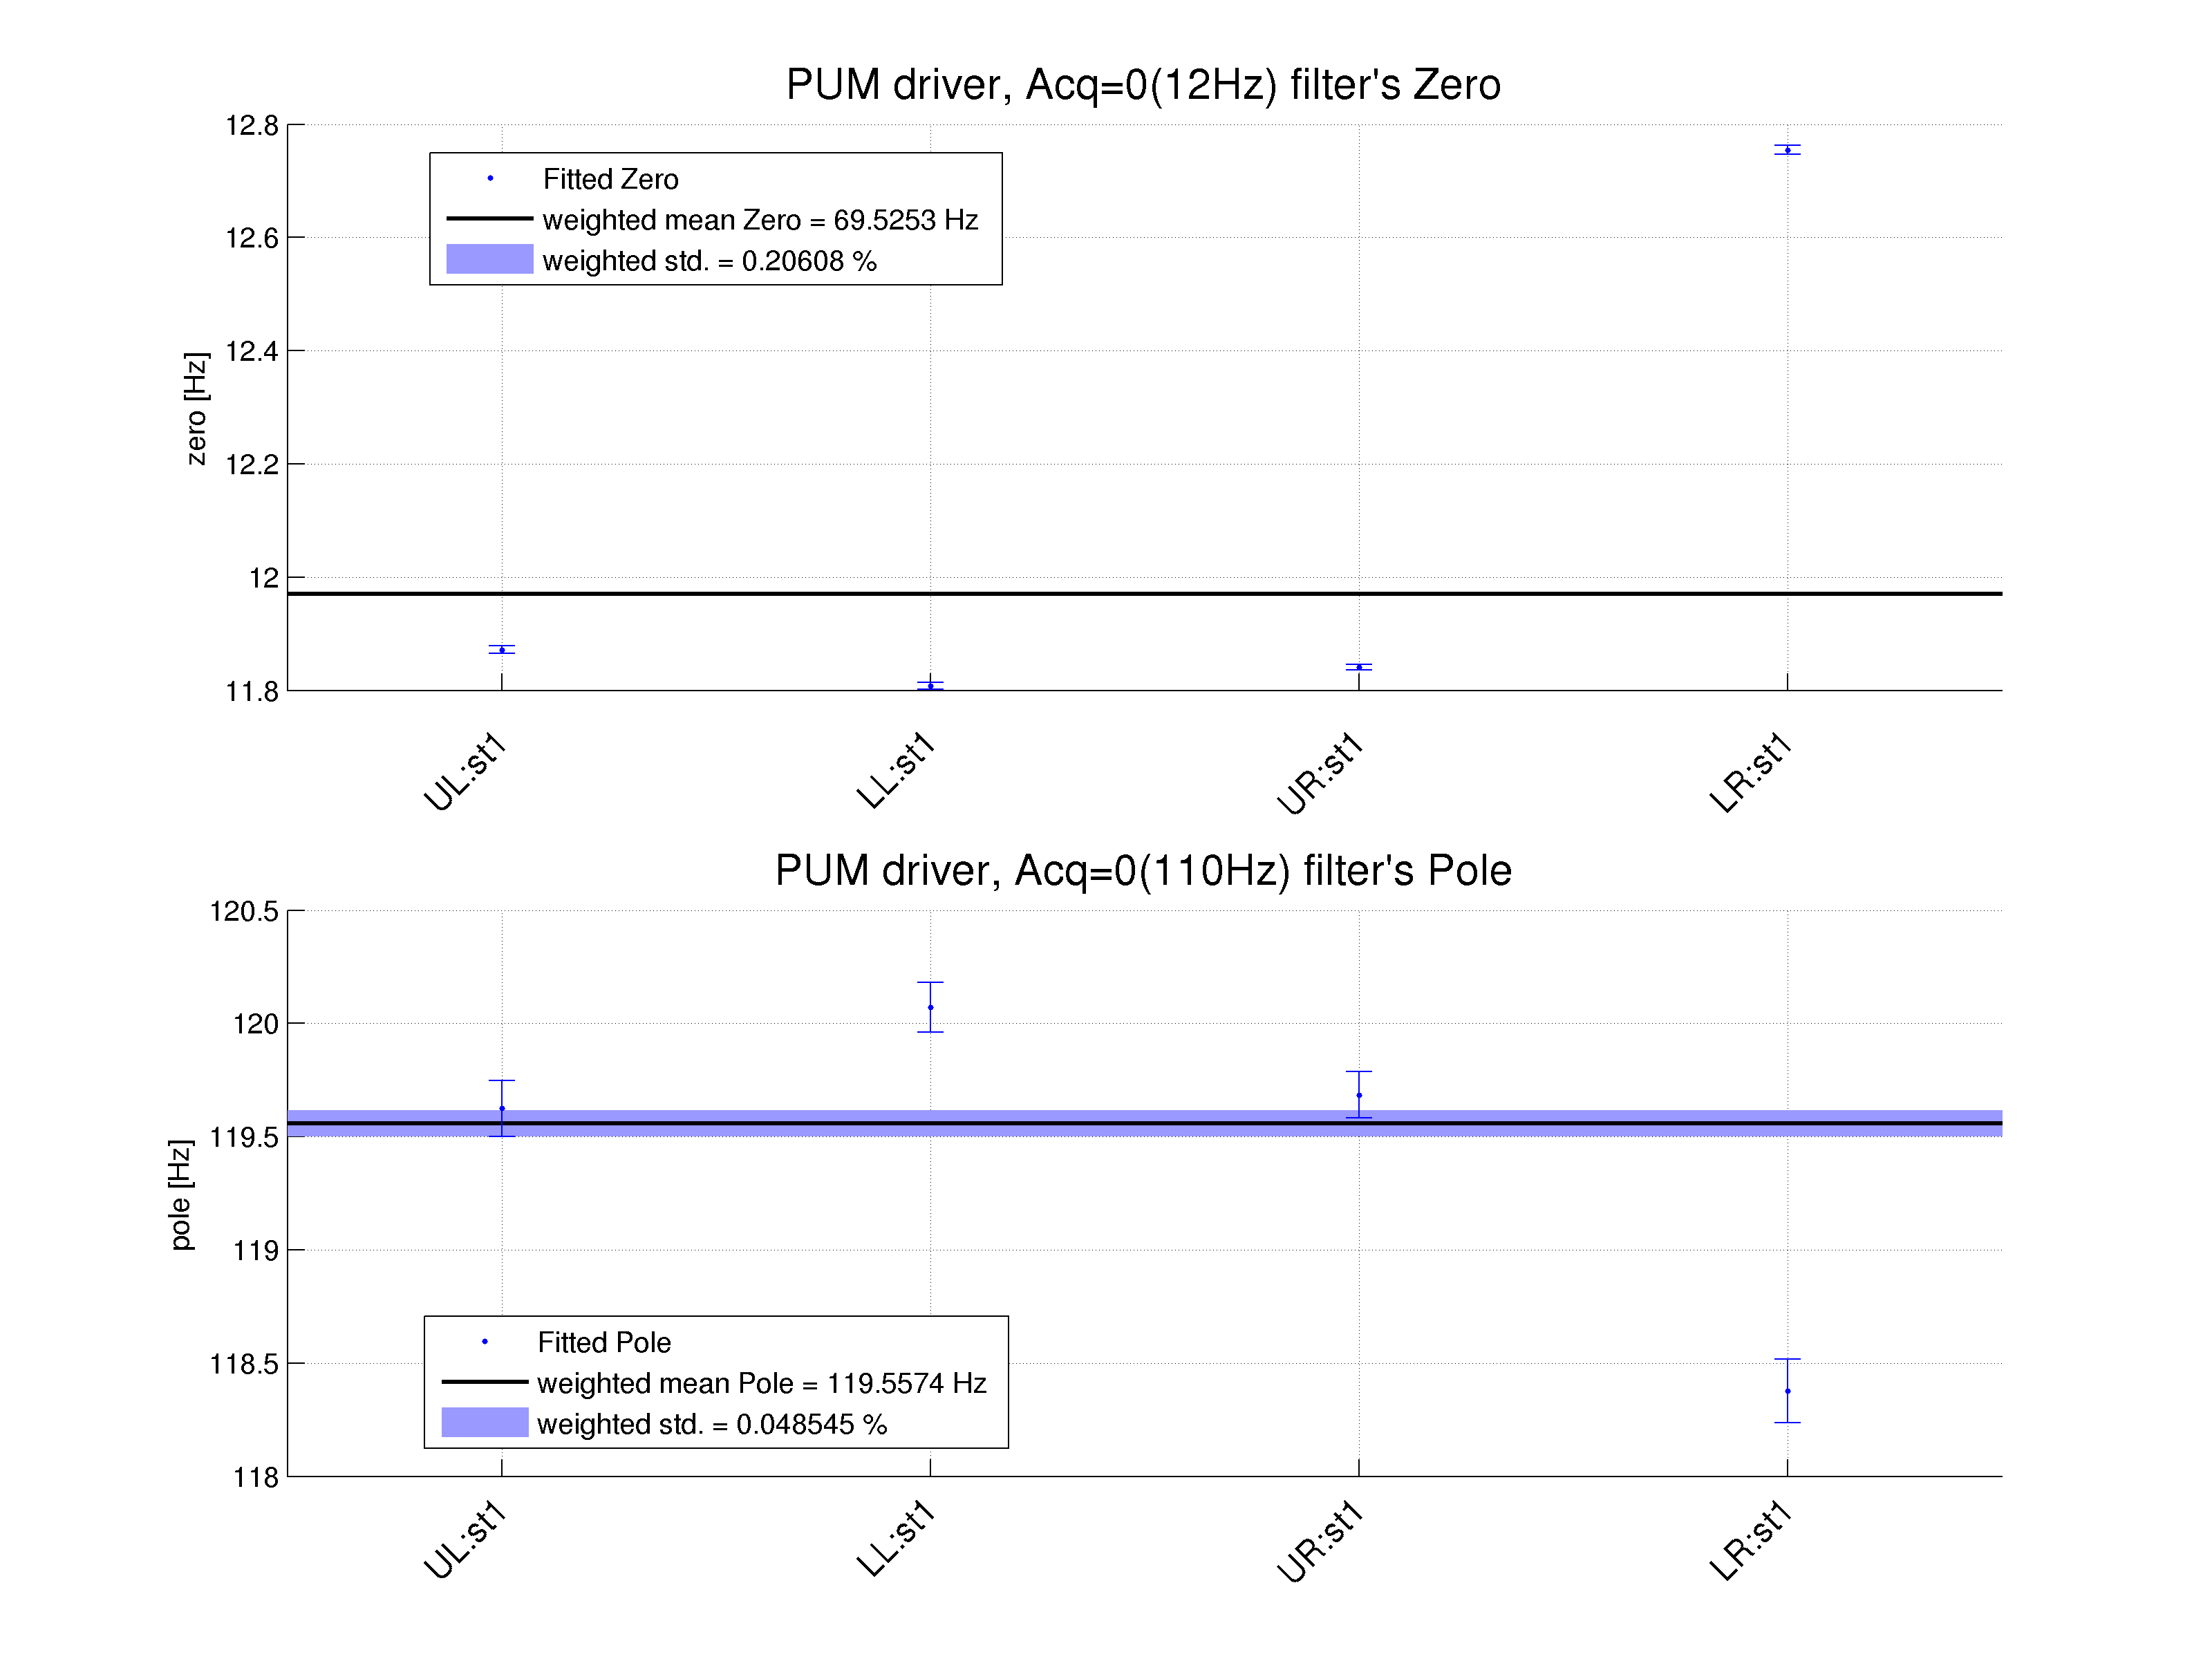
Weighed means of the low-pass filter parameters of each of the quadrants (UL, LL, UR, and LR) from State 3 / State 1 and State 4 / State 2 measurements and weighted mean of all 4 quandrants are given in the figure below:
Acquisition circuit
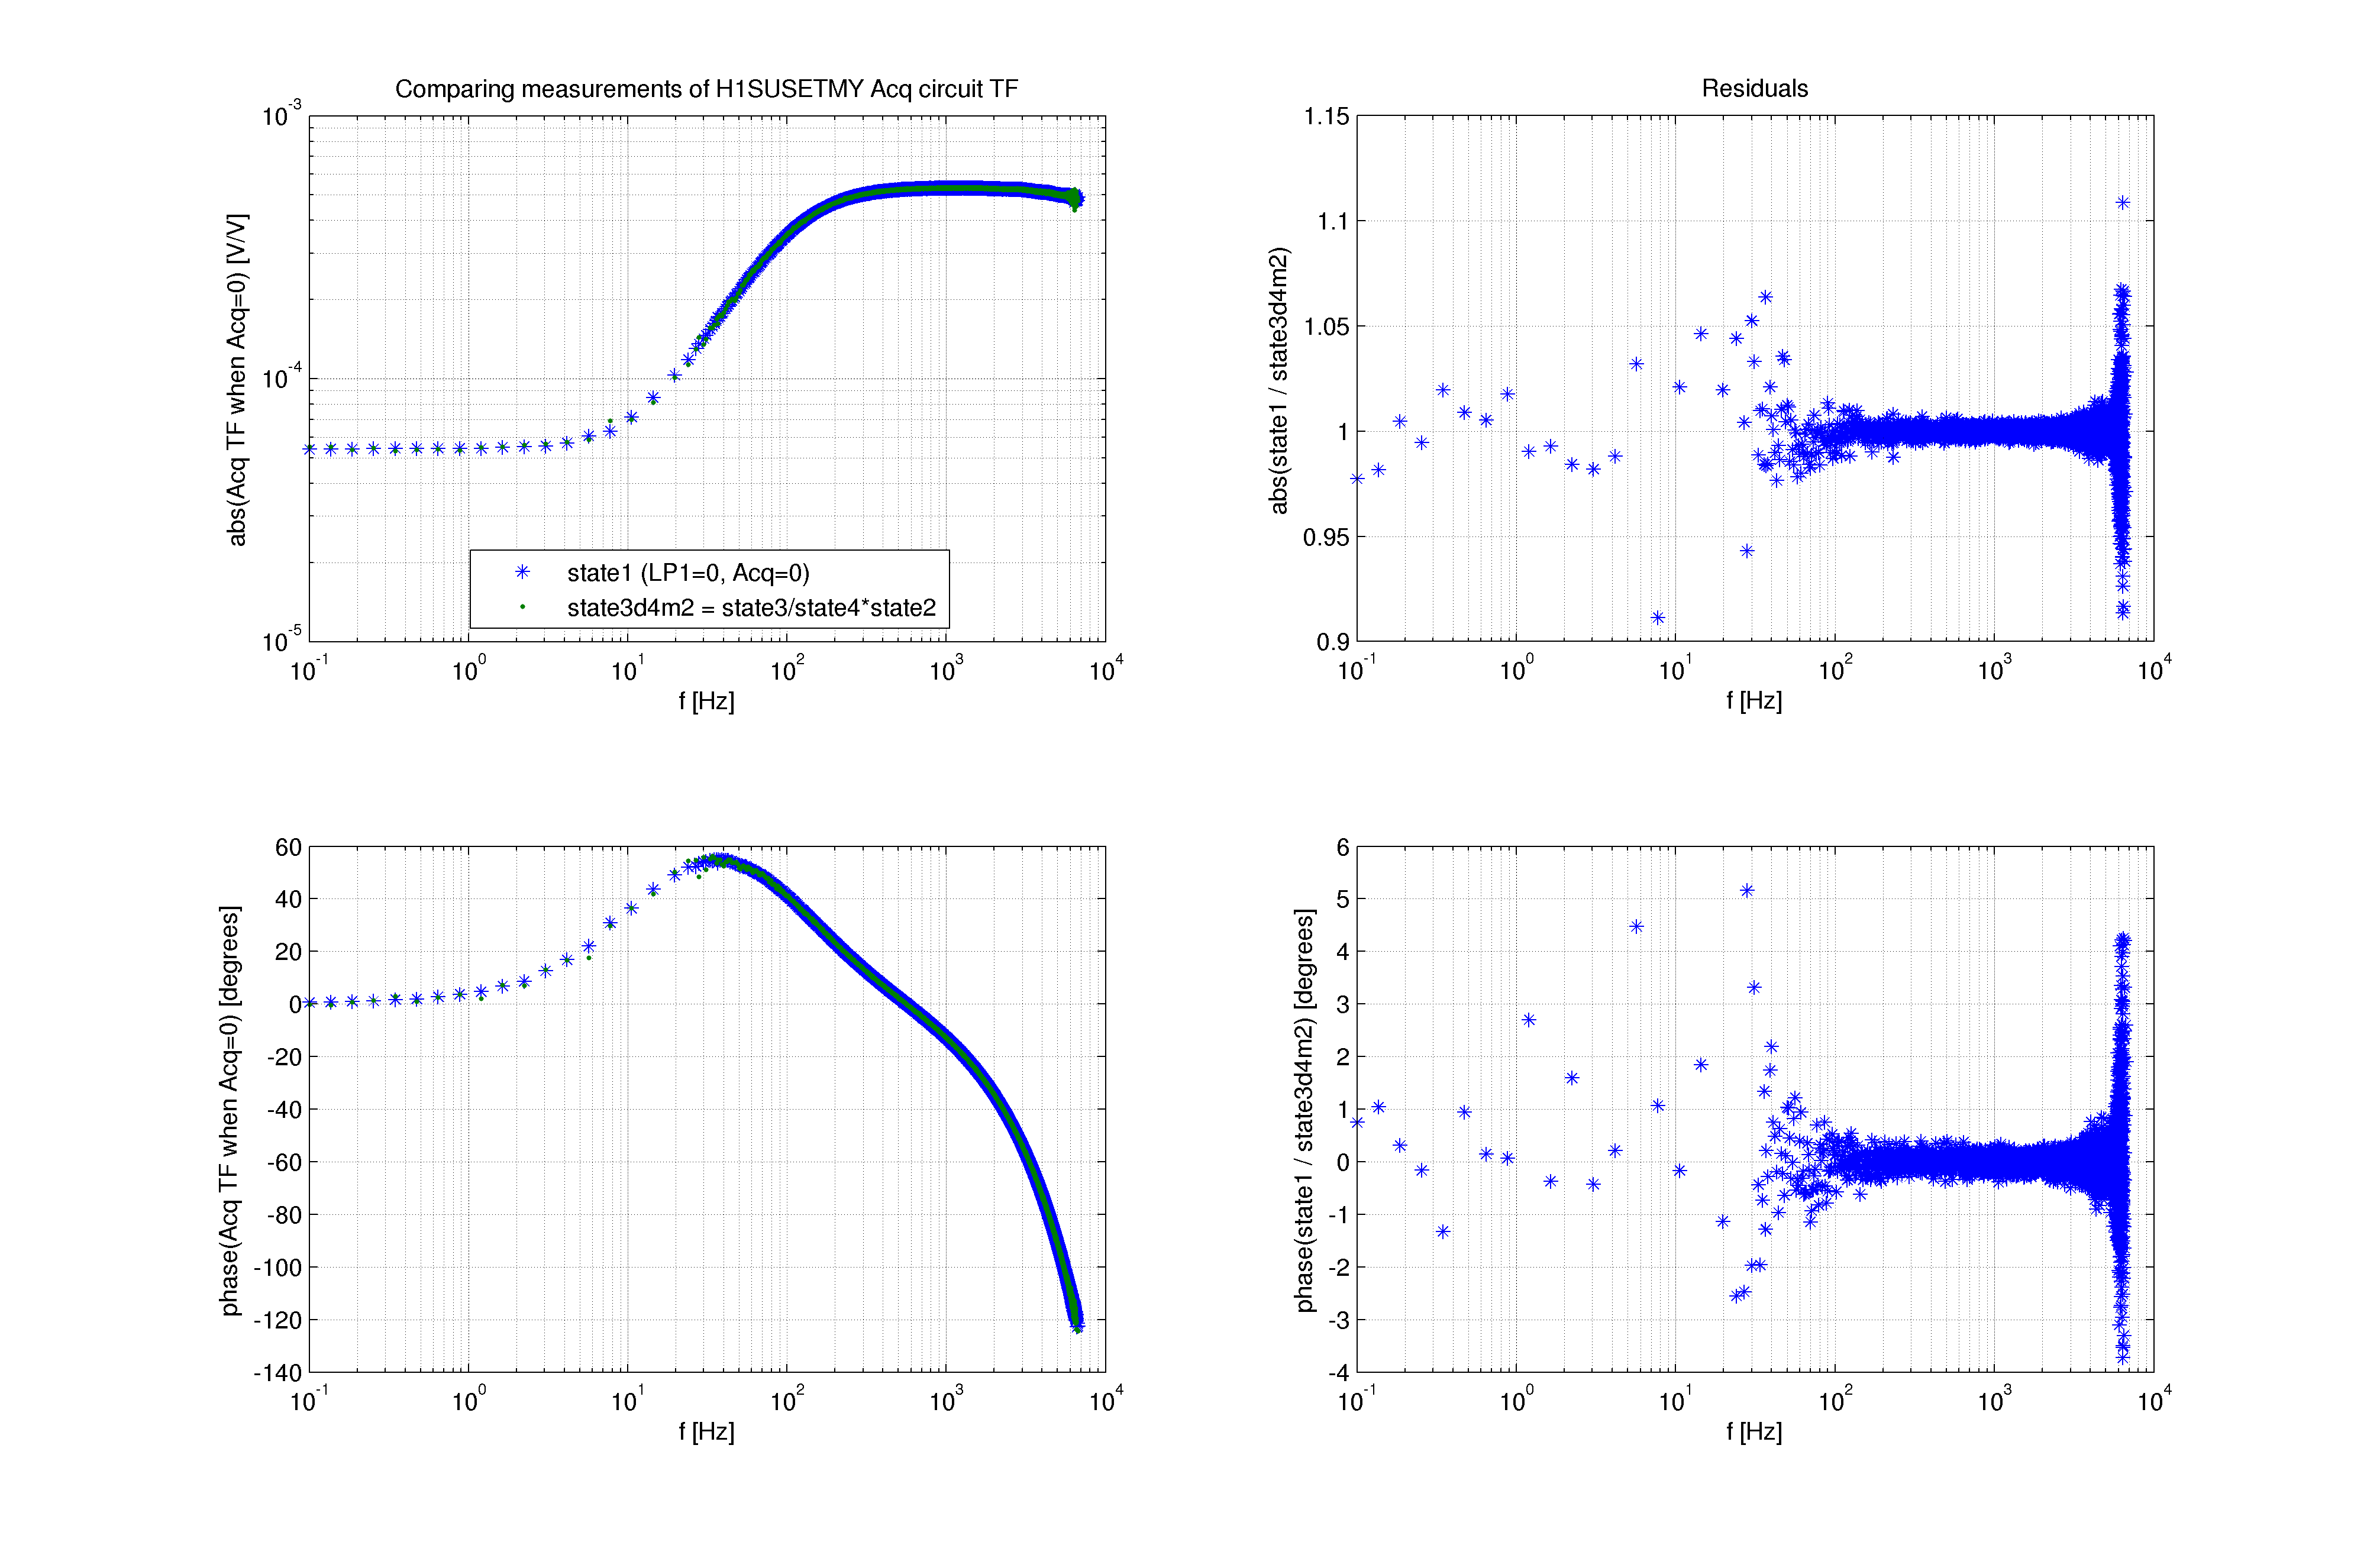
The same technique of taking the transfer functions of two different states to isolate TFs of acquisition circuit (TF when Acq. bit=1 / TF when Acq. bit=0) showed some extra frequency dependend effect, a pole at about ~1kHz and missing polt at 80.5 Hz (instead the pole was around 110 Hz); we're not sure what's the source of this effect (see attached figures st2/st1, st4/st3). Because we're not sure which of two states (acq.bit=0 / acq.bit=1) causes this frequency dependence we decided not to use measurement in state 1 (not a ratio of measurements in two different states) to get acquisition circuit TF for acq.bit=0 and state 2 for acq.bit=1.
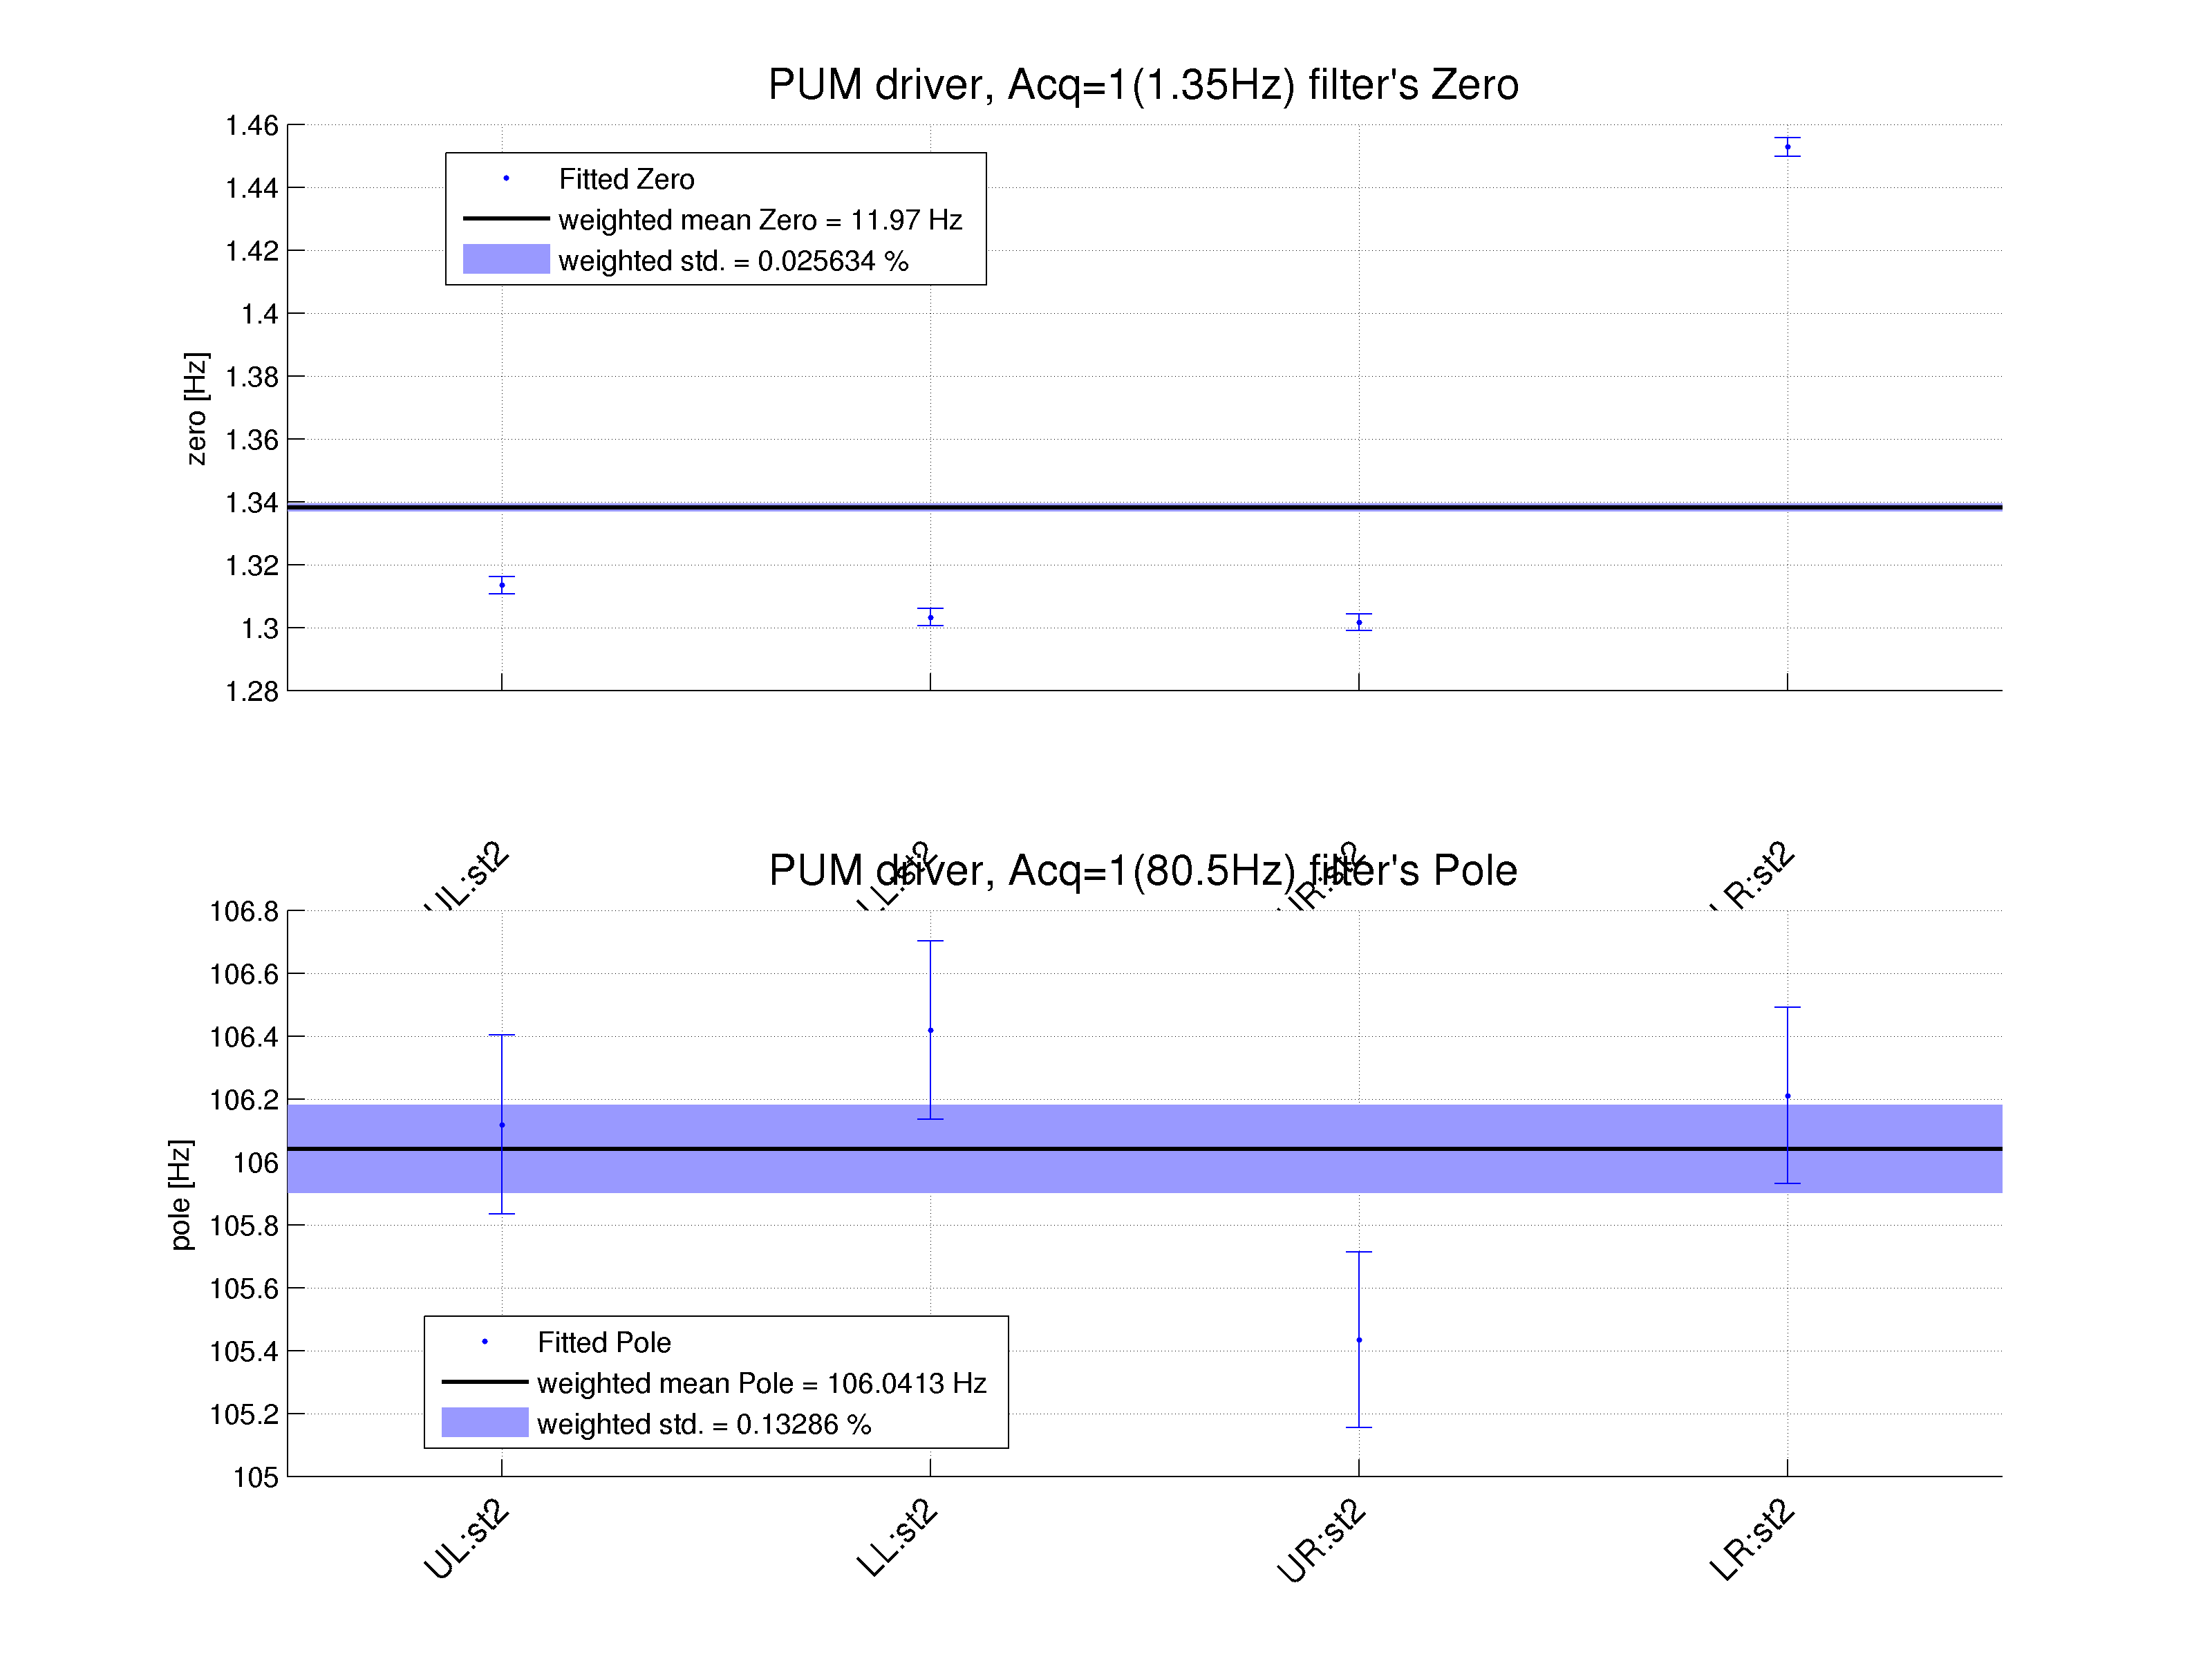
FItted acq. circuit zeros and poles (model) are given in table 3; model vs. measurement and residual plots are given in the plot under the table. Fitting was done on a logarithmically spaced frequency vector in range [0.1 80] Hz.
Table 3. H1:SUSETMY-PUM driver acq. circuit fit details
==================================================================================================
Fitted Acq0 and fit uncertainty Fitted Acq1 and fit uncertainty
( z : p ) [Hz] ( z : p ) [Hz]
--------------------------------------------------------------------------------------------------
UL ( 11.87 +/- 0.05 % : 119.62 +/- 0.10 % ) ( 1.31 +/- 0.21 % : 106.12 +/- 0.27 % )
LL ( 11.81 +/- 0.05 % : 120.07 +/- 0.09 % ) ( 1.30 +/- 0.21 % : 106.42 +/- 0.27 % )
UR ( 11.84 +/- 0.04 % : 119.68 +/- 0.08 % ) ( 1.30 +/- 0.20 % : 105.43 +/- 0.26 % )
LR ( 12.75 +/- 0.06 % : 118.38 +/- 0.12 % ) ( 1.45 +/- 0.20 % : 106.21 +/- 0.26 % )
==================================================================================================
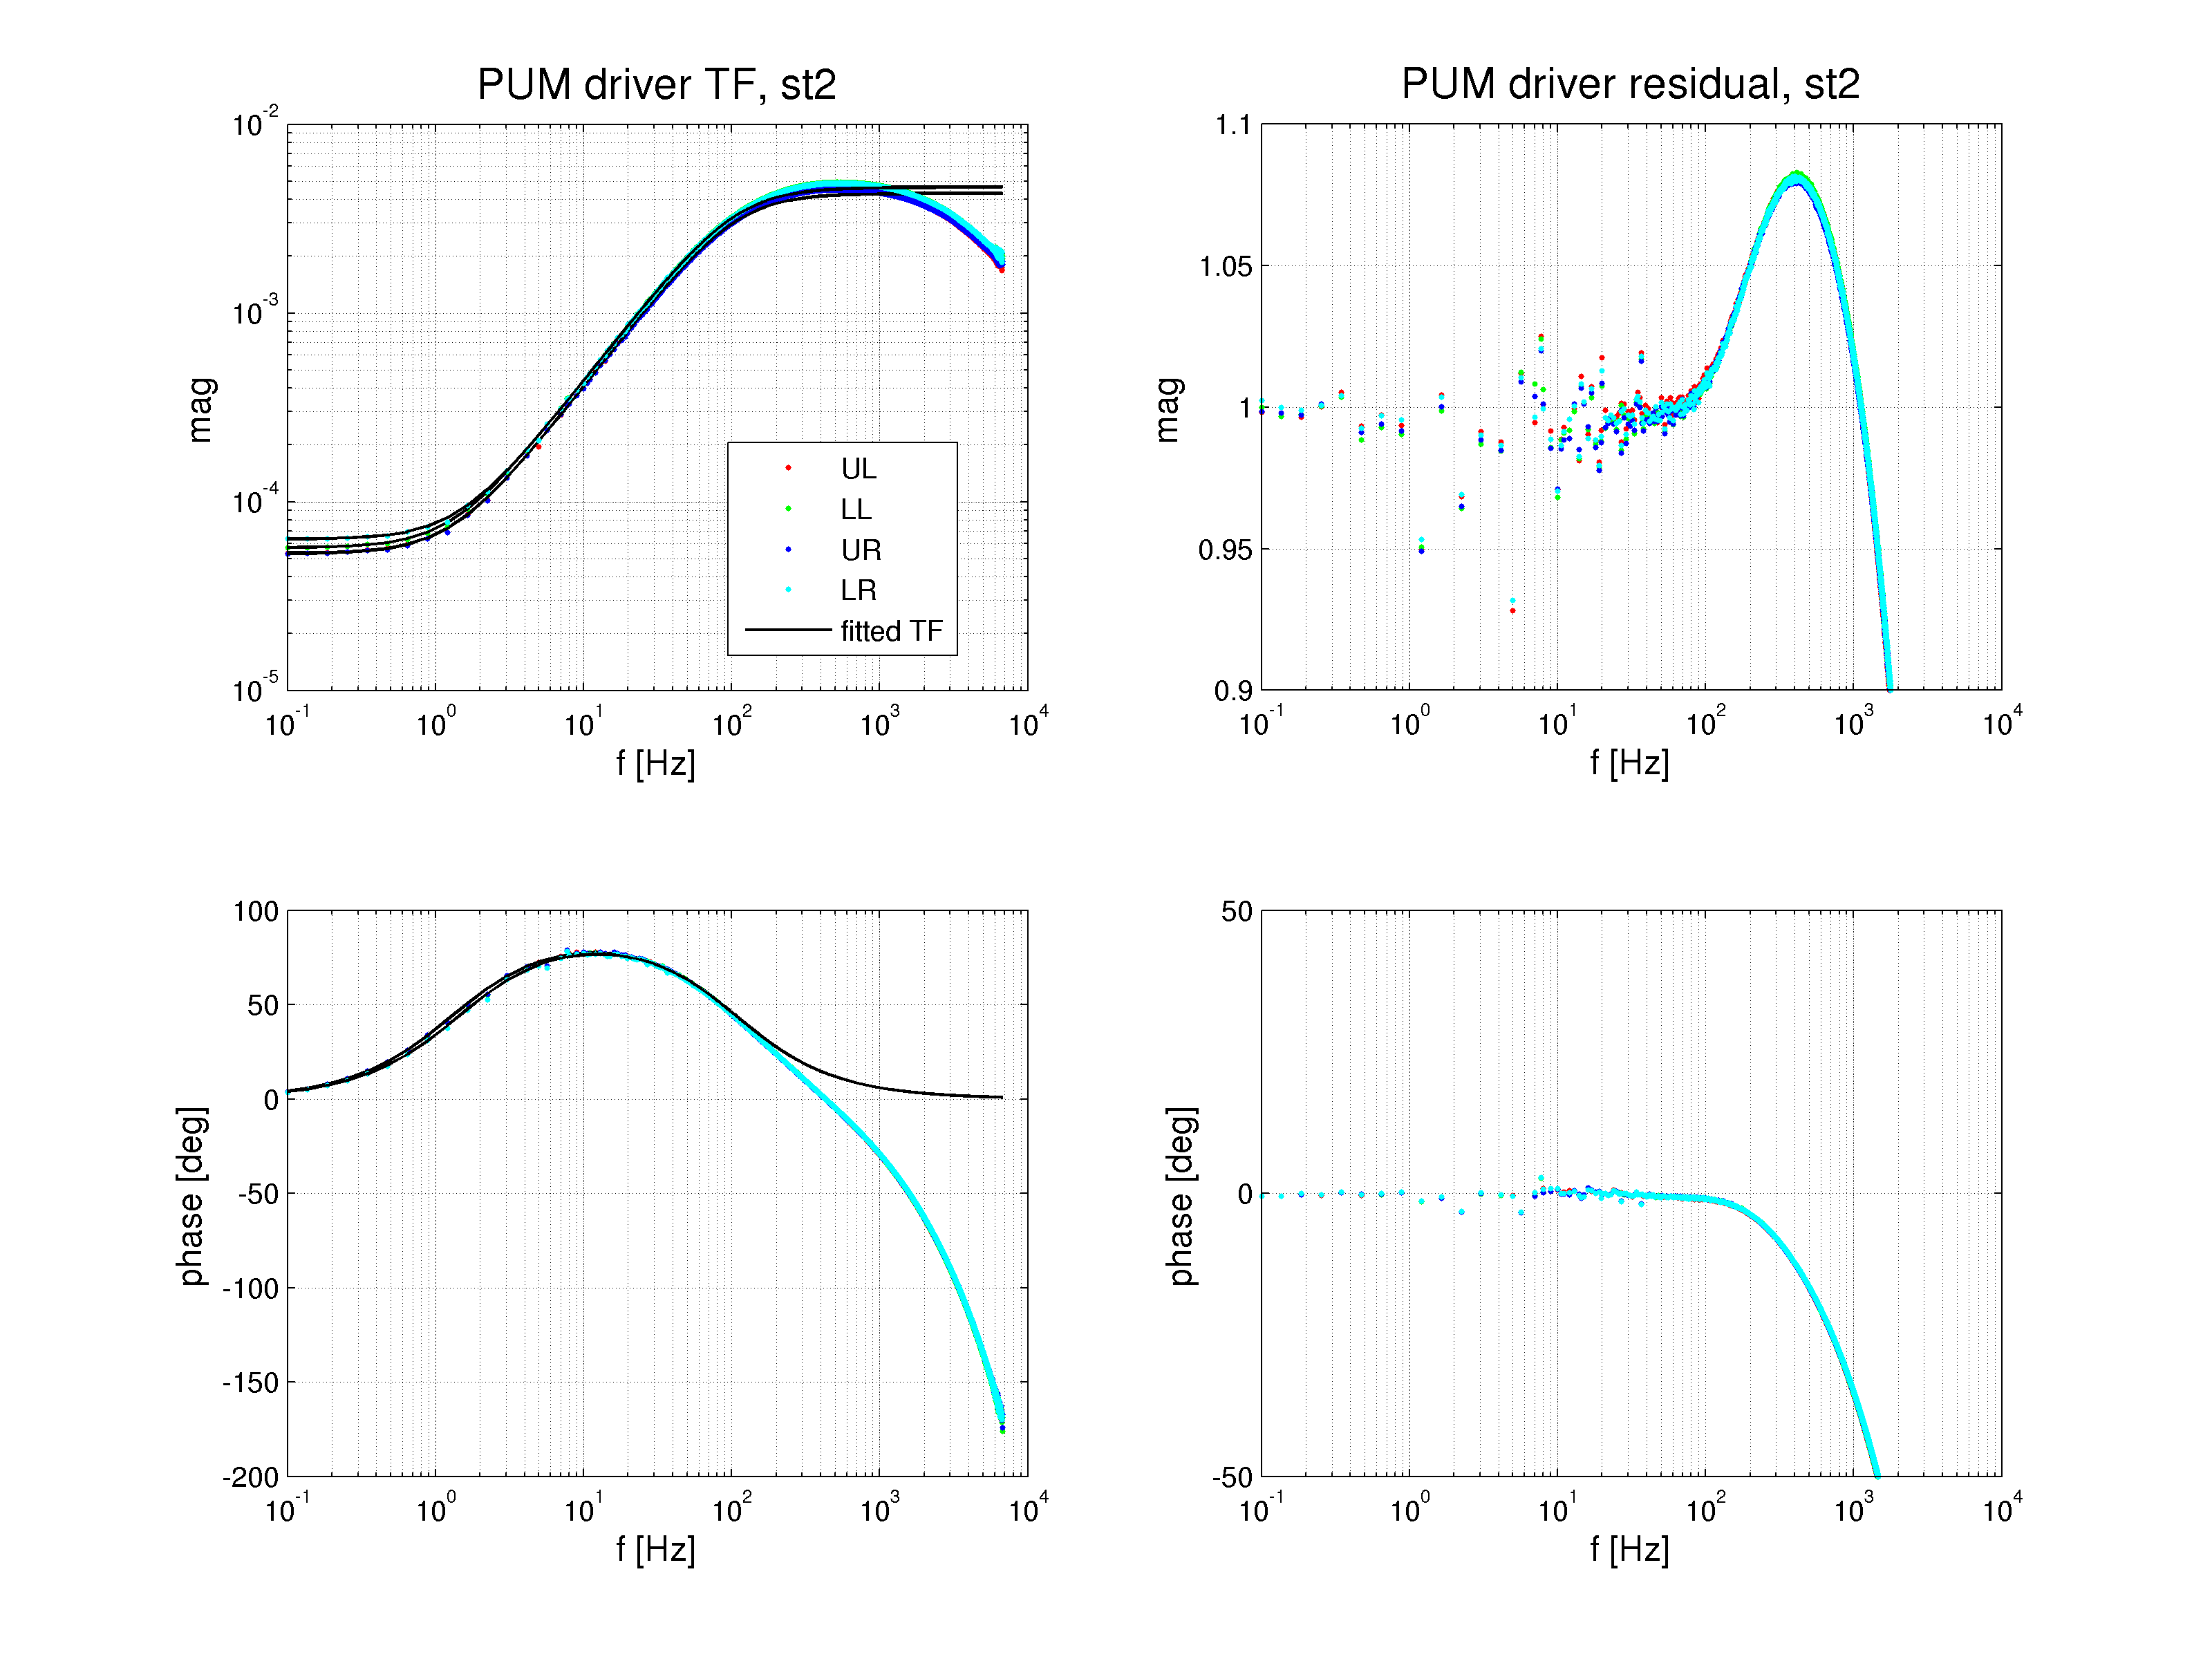
We see that in both cases, acq.bit=0 and acq.bit=1 we see roll-off in the measurements over 1kHz which is not explained in T1100507. We also see that pole at 80.5 Hz did not show up in the measurements, instead we saw a pole at about 110 Hz.
in this analysis we did not try to estimate DC gain of the coil driver TFs, but only frequency dependent effects.
Scripts and Plots in the SVN
Scripts were committed to the calibration SVN:
comparison script for the same TF using two different configurations:
CalSVN/aligocalibration/trunk/Runs/ER8/H1/Scripts/Electronics/compare_PUM_measState3_measState4divState2.m
measurement parameters are in
CalSVN/aligocalibration/trunk/Runs/ER8/H1/Scripts/Electronics/H1SUSETMY_PUMDriver_$(state)_param_$(gps_time).m
the script that loads all of the measurement parameters, calls the fitting function and produces the plots:
CalSVN/aligocalibration/trunk/Runs/ER8/H1/Scripts/Electronics/runFit_H1SUSETMY_PUMDriver.m
all of the Matlab functions used in the analysis are commtted to the same directory
Plots were committed to the calibration SVN:
CalSVN/aligocalibration/trunk/Runs/ER8/H1/Results/Electronics/2015-09-04_H1SUSETMY_PUMDriver_$(short_description).pdf