Jeffrey K, Kiwamu I, Darkhan T
Overview
In this alog we present a summary of H1 SUS ETMY UIM coil driver electronics measurements (LHO alog 20846) analysis. UIM coil driver consist of three switchable low-pass filters and a static high pass filter (DCC D070481). According to UIM driver state machine diagram (DCC T1100507) each of the the switchable filters were designed to have a zero at 10.5 Hz and a pole at 1 Hz. A non-switchable filter was designed to have a zero at 50 Hz and pole at 300 Hz.
Fitted zeros of all of the UIM driver low-pass filters were mostly within +/- 0.2 Hz and poles were within 0.02 Hz from designed ( 10.5 : 1.0 ) Hz with uncertainties mostly under 0.3% (see plots below). For individual uncertainties in each of the fit results see tables 1-3.
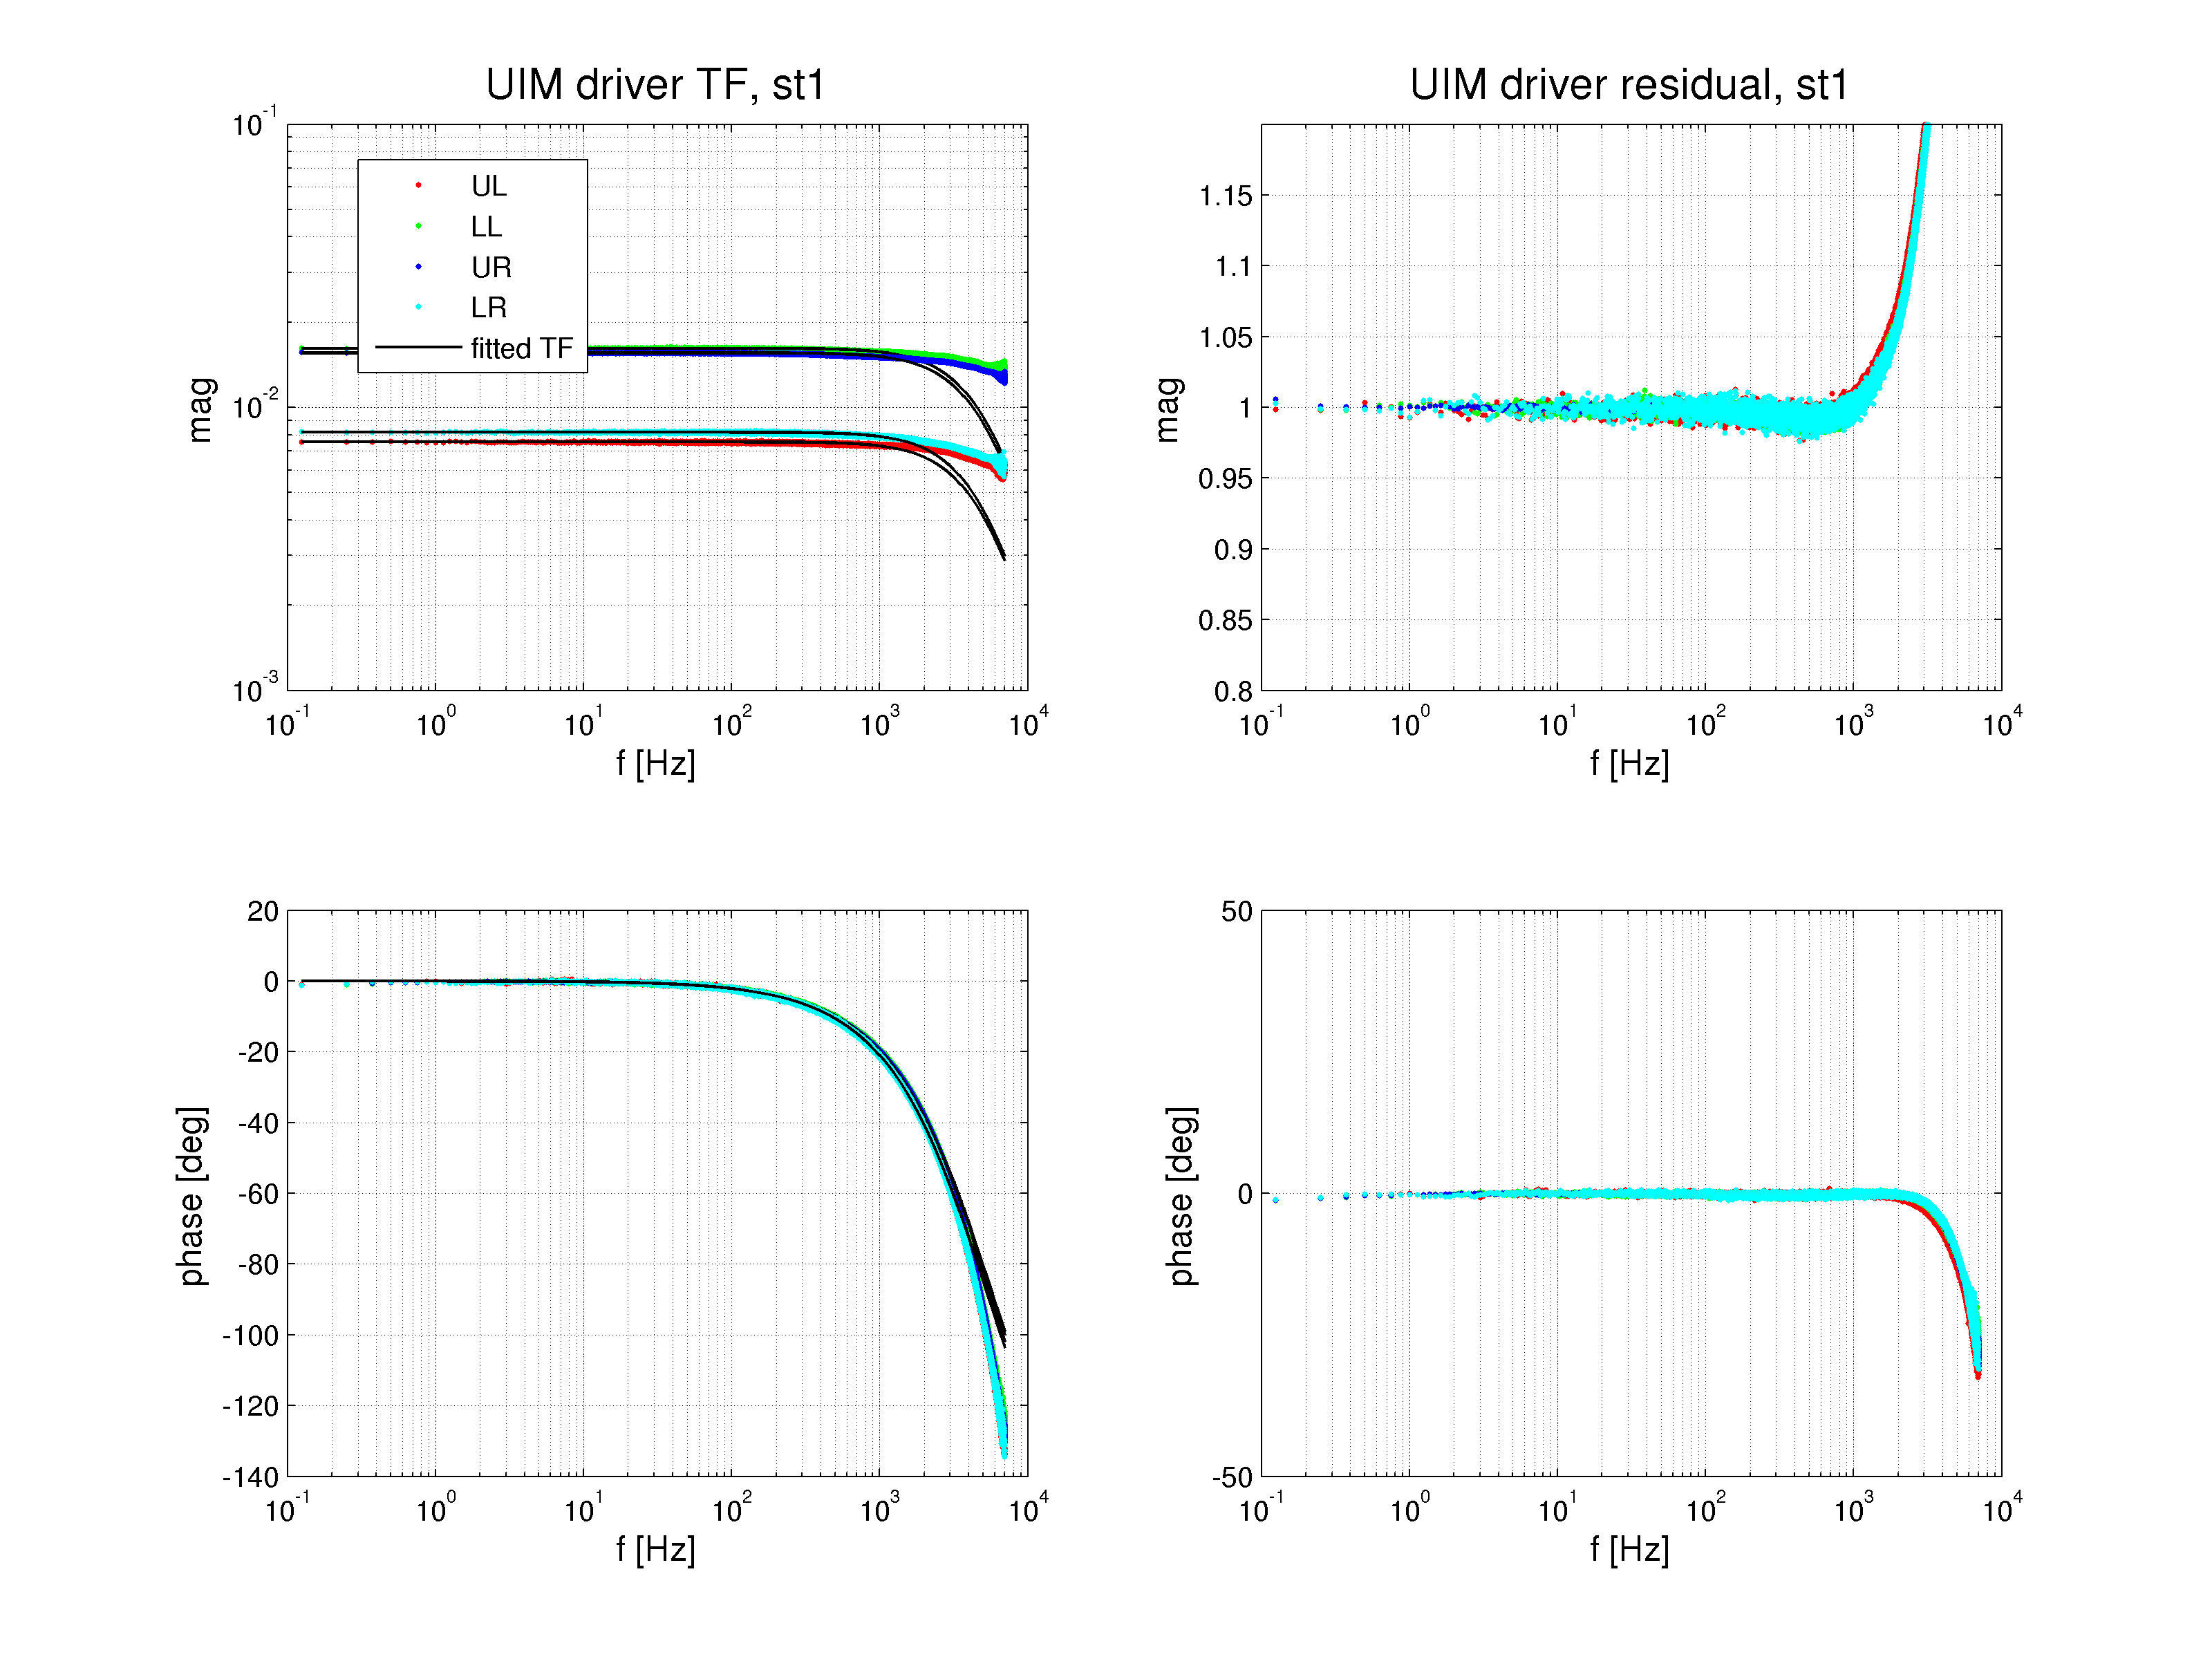
In this analysis it was not possible to check accuracy of ( 50 : 300 ) Hz pair, because FAST I MONs used for measuring coil driver transfer functions are immune to the effect of this filter, see LHO alog 21142 for more details. This means that UIM driver TF in state 1 should be a flat TF, attachment 4 shows that the TF is mostly flat at low frequencies but we still see something that looks like a high-frequency pole.
Another thing to mention is that we see an unexplained high-frequency feature in UL quadrant measurement that does not appear in LL, UR and LR quadrants.
Details
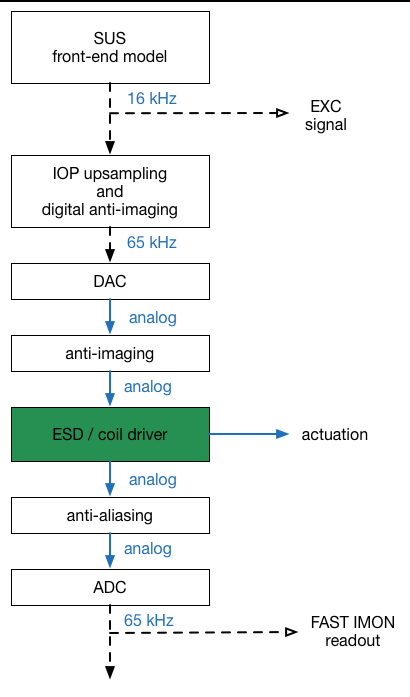
Similarly to what was explained in our previous alog 21232, the measured transfer functions between excitation and readout signals, apart from driver itself, include also frequency dependent effects from IOP upsampling, digital anti-imaging, analog anti-imaging, and analog anti-aliasing filters shown in the attached diagram (also explained in LHO alog comment 21127).
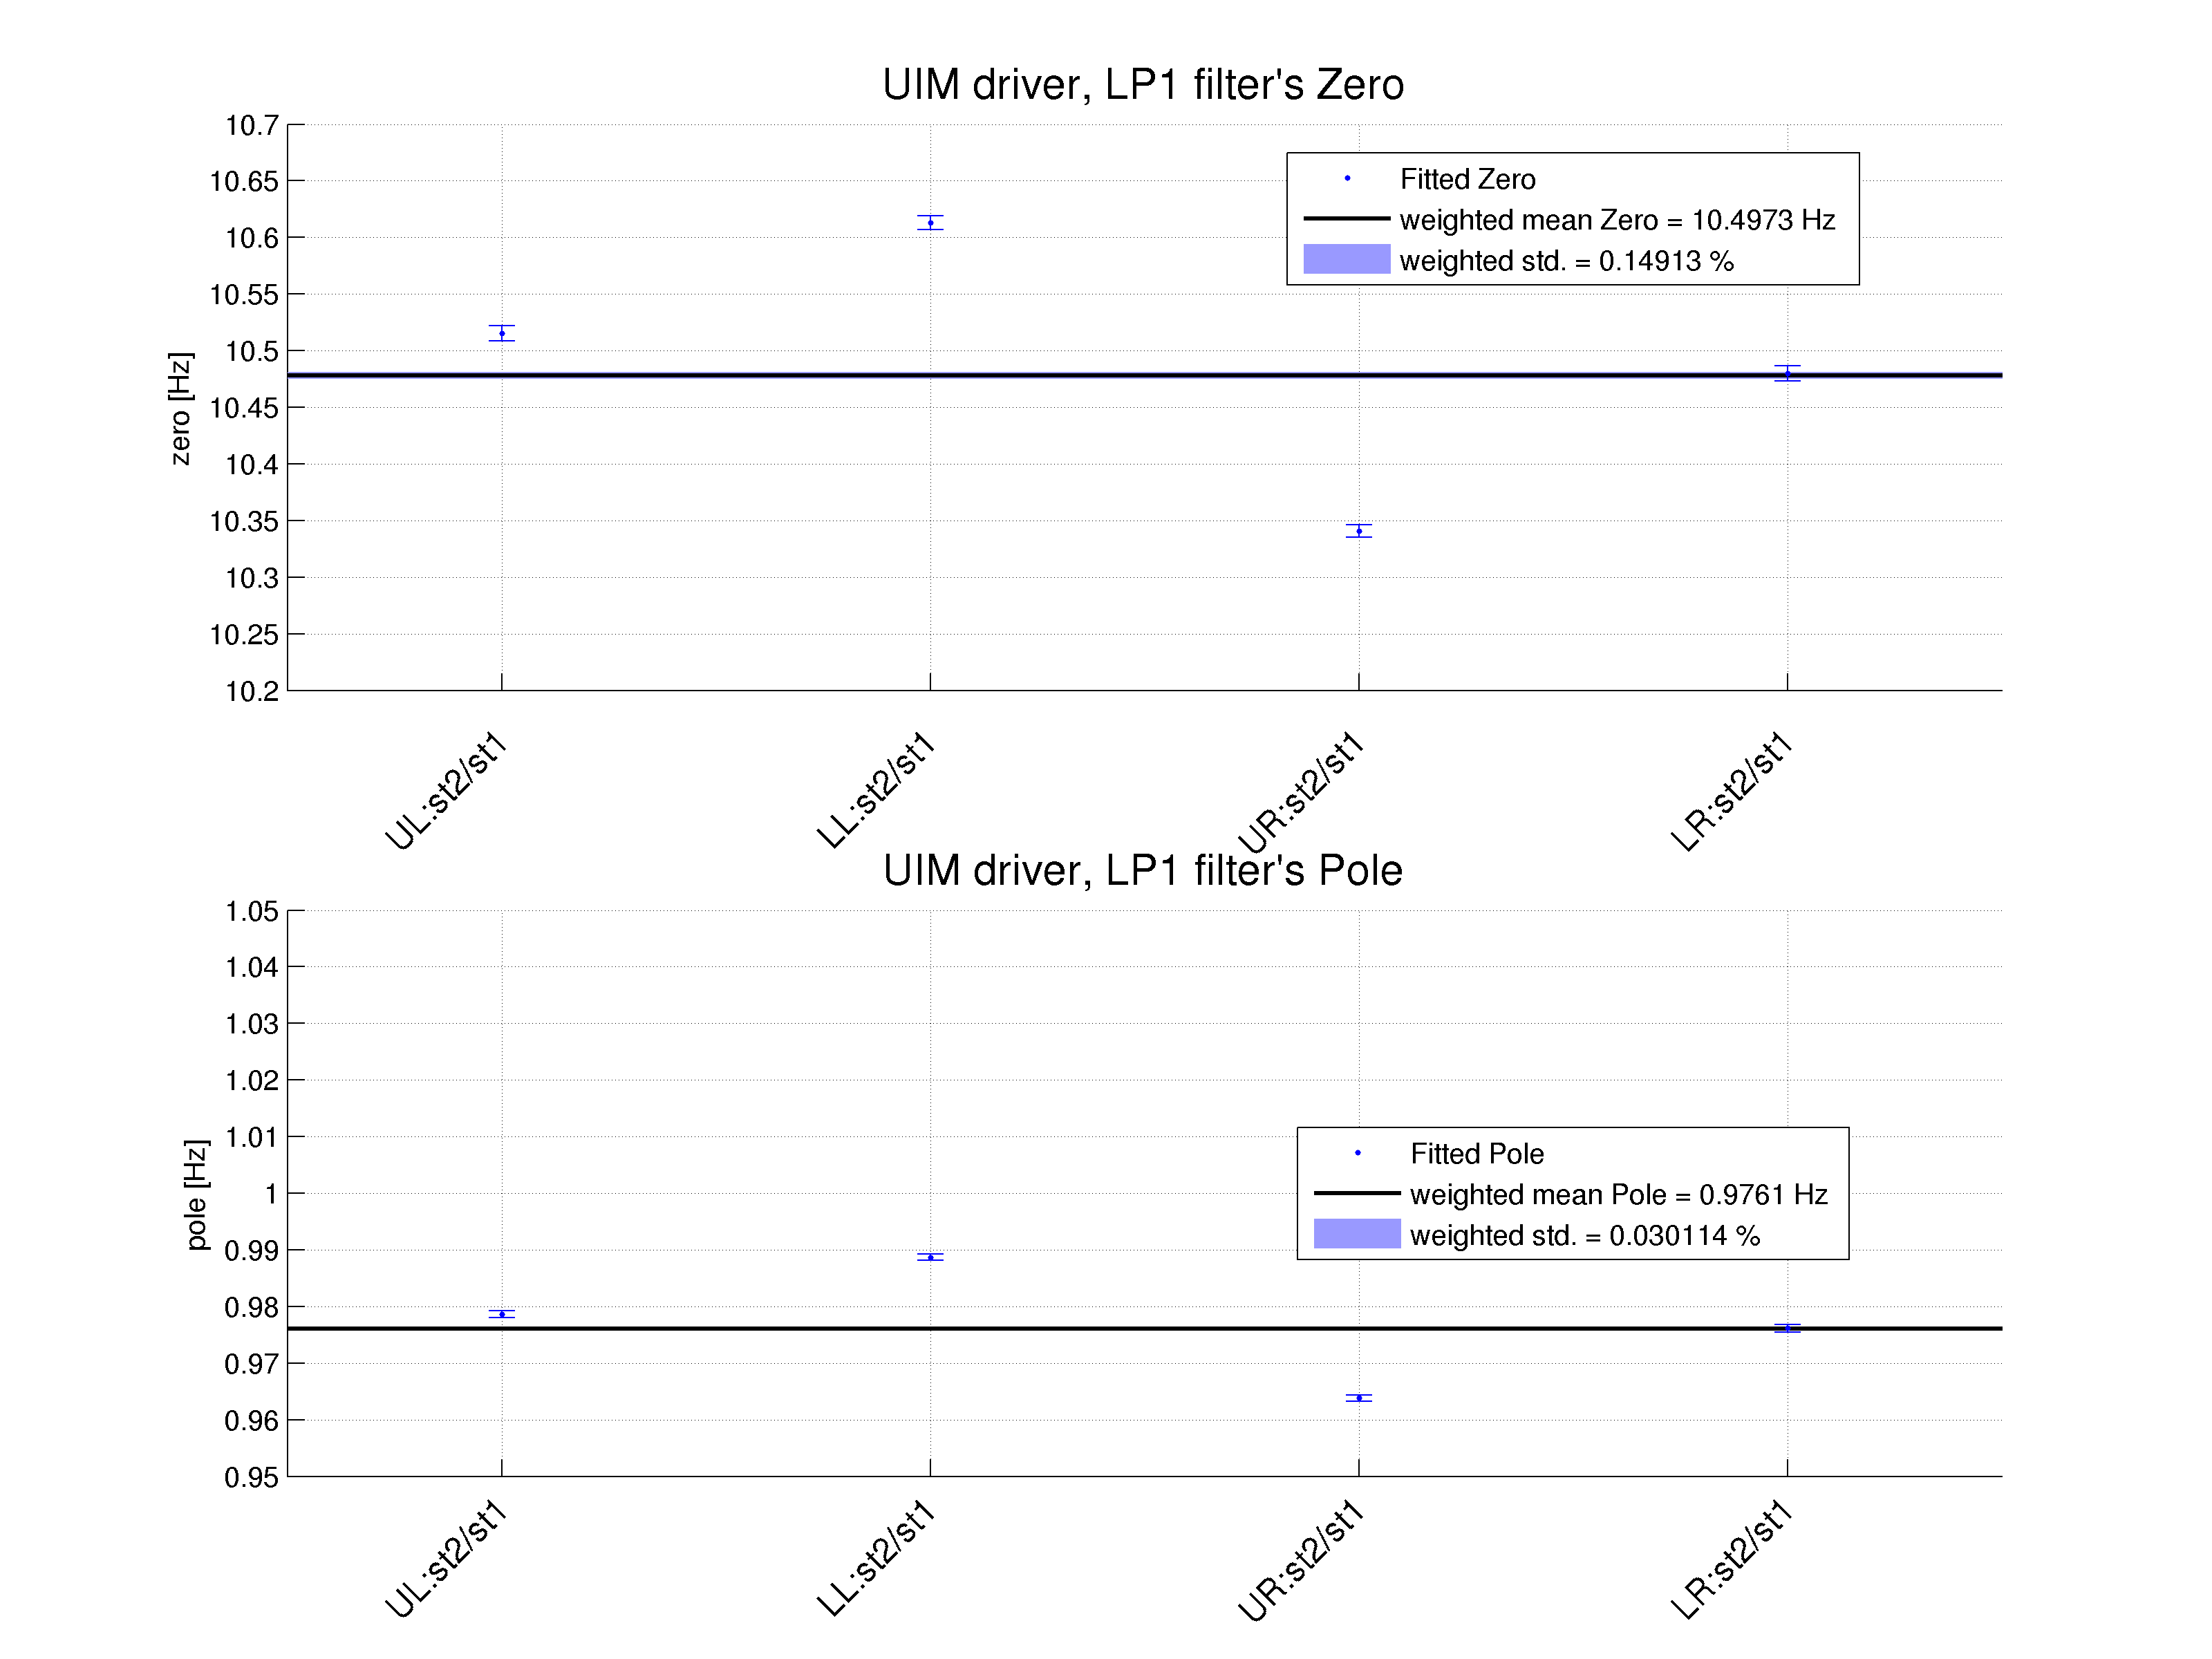
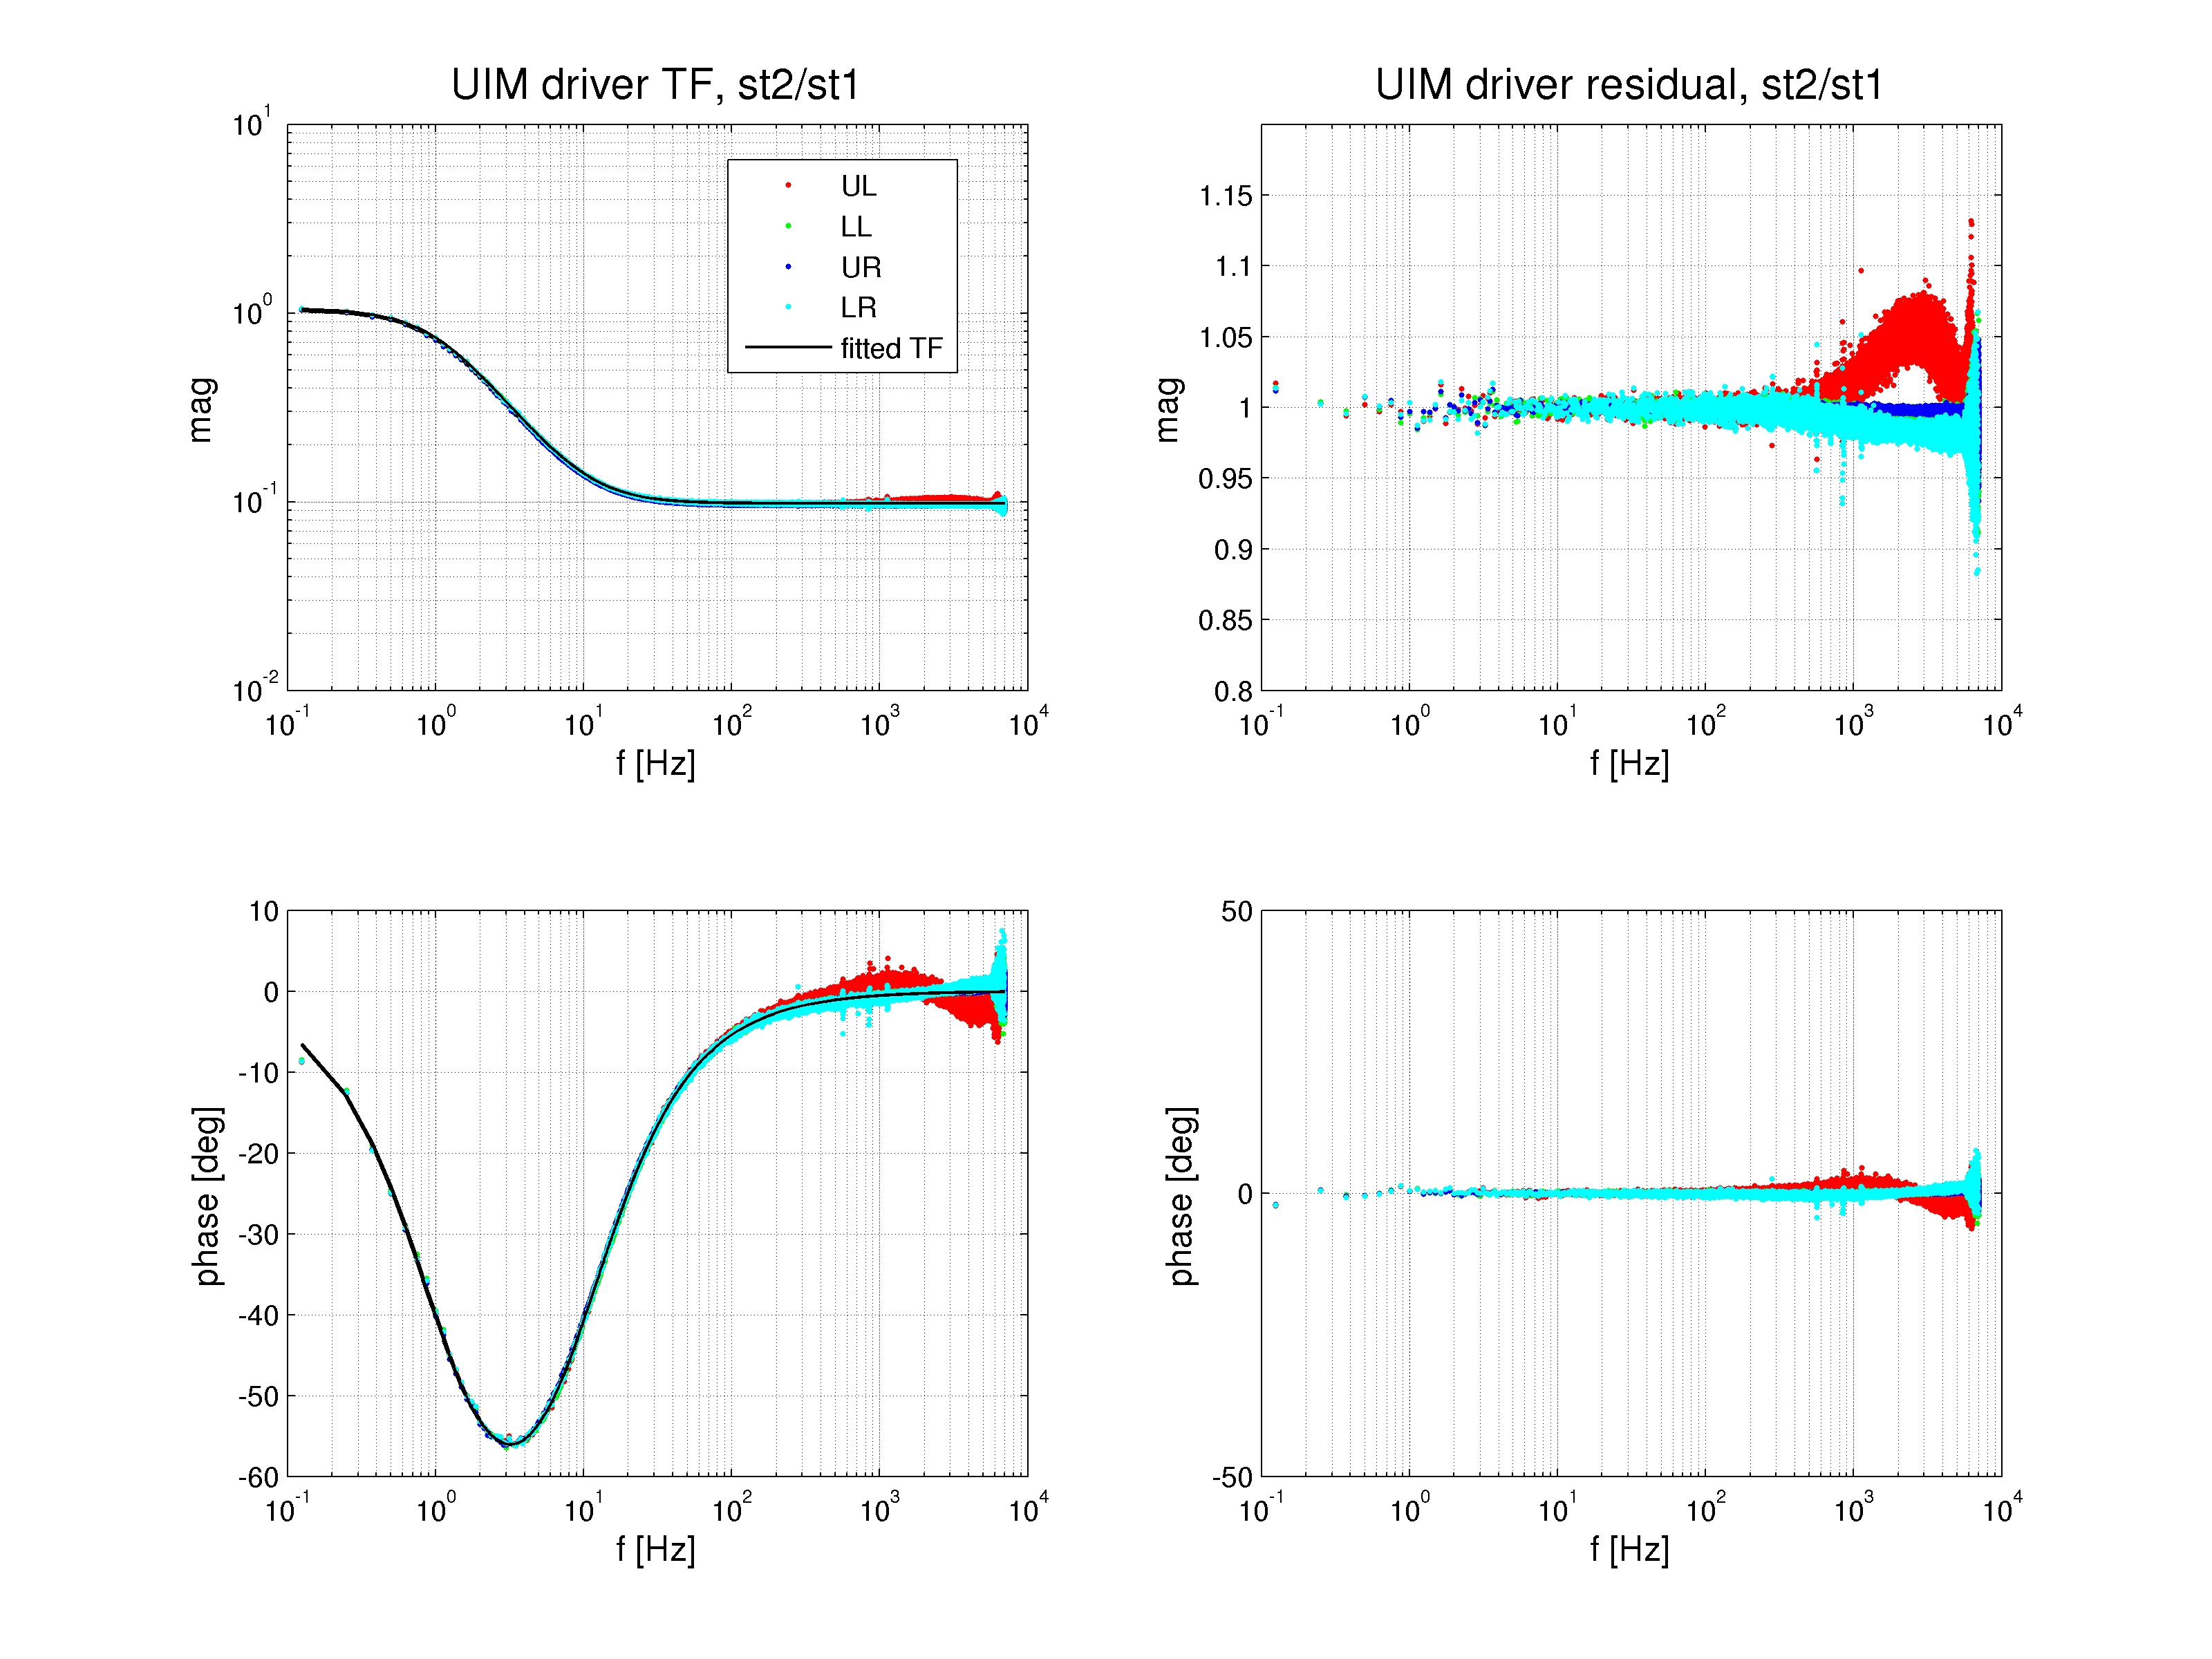
LP1
LP1 TF was isolabed from all of the other frequency dependencies by taking the ratio of State 2 TF / State 1 TF measurements. Results of LISO fitting of one zero and one pole into the measured TF in a range [0.1 100.0] Hz are given in table 1. Plot of the fitted (model) zero-pole TF vs. measurement and the residuals are shown in the plot under the table.
Table 1. H1:SUSETMY-UIM driver LP1 fit details
=================================================
Fitted LP1 and fit uncertainty
( z : p ) [Hz]
-------------------------------------------------
UL ( 10.52 +/- 0.06 % : 0.98 +/- 0.06 % )
LL ( 10.61 +/- 0.06 % : 0.99 +/- 0.06 % )
UR ( 10.34 +/- 0.05 % : 0.96 +/- 0.05 % )
LR ( 10.48 +/- 0.06 % : 0.98 +/- 0.07 % )
=================================================
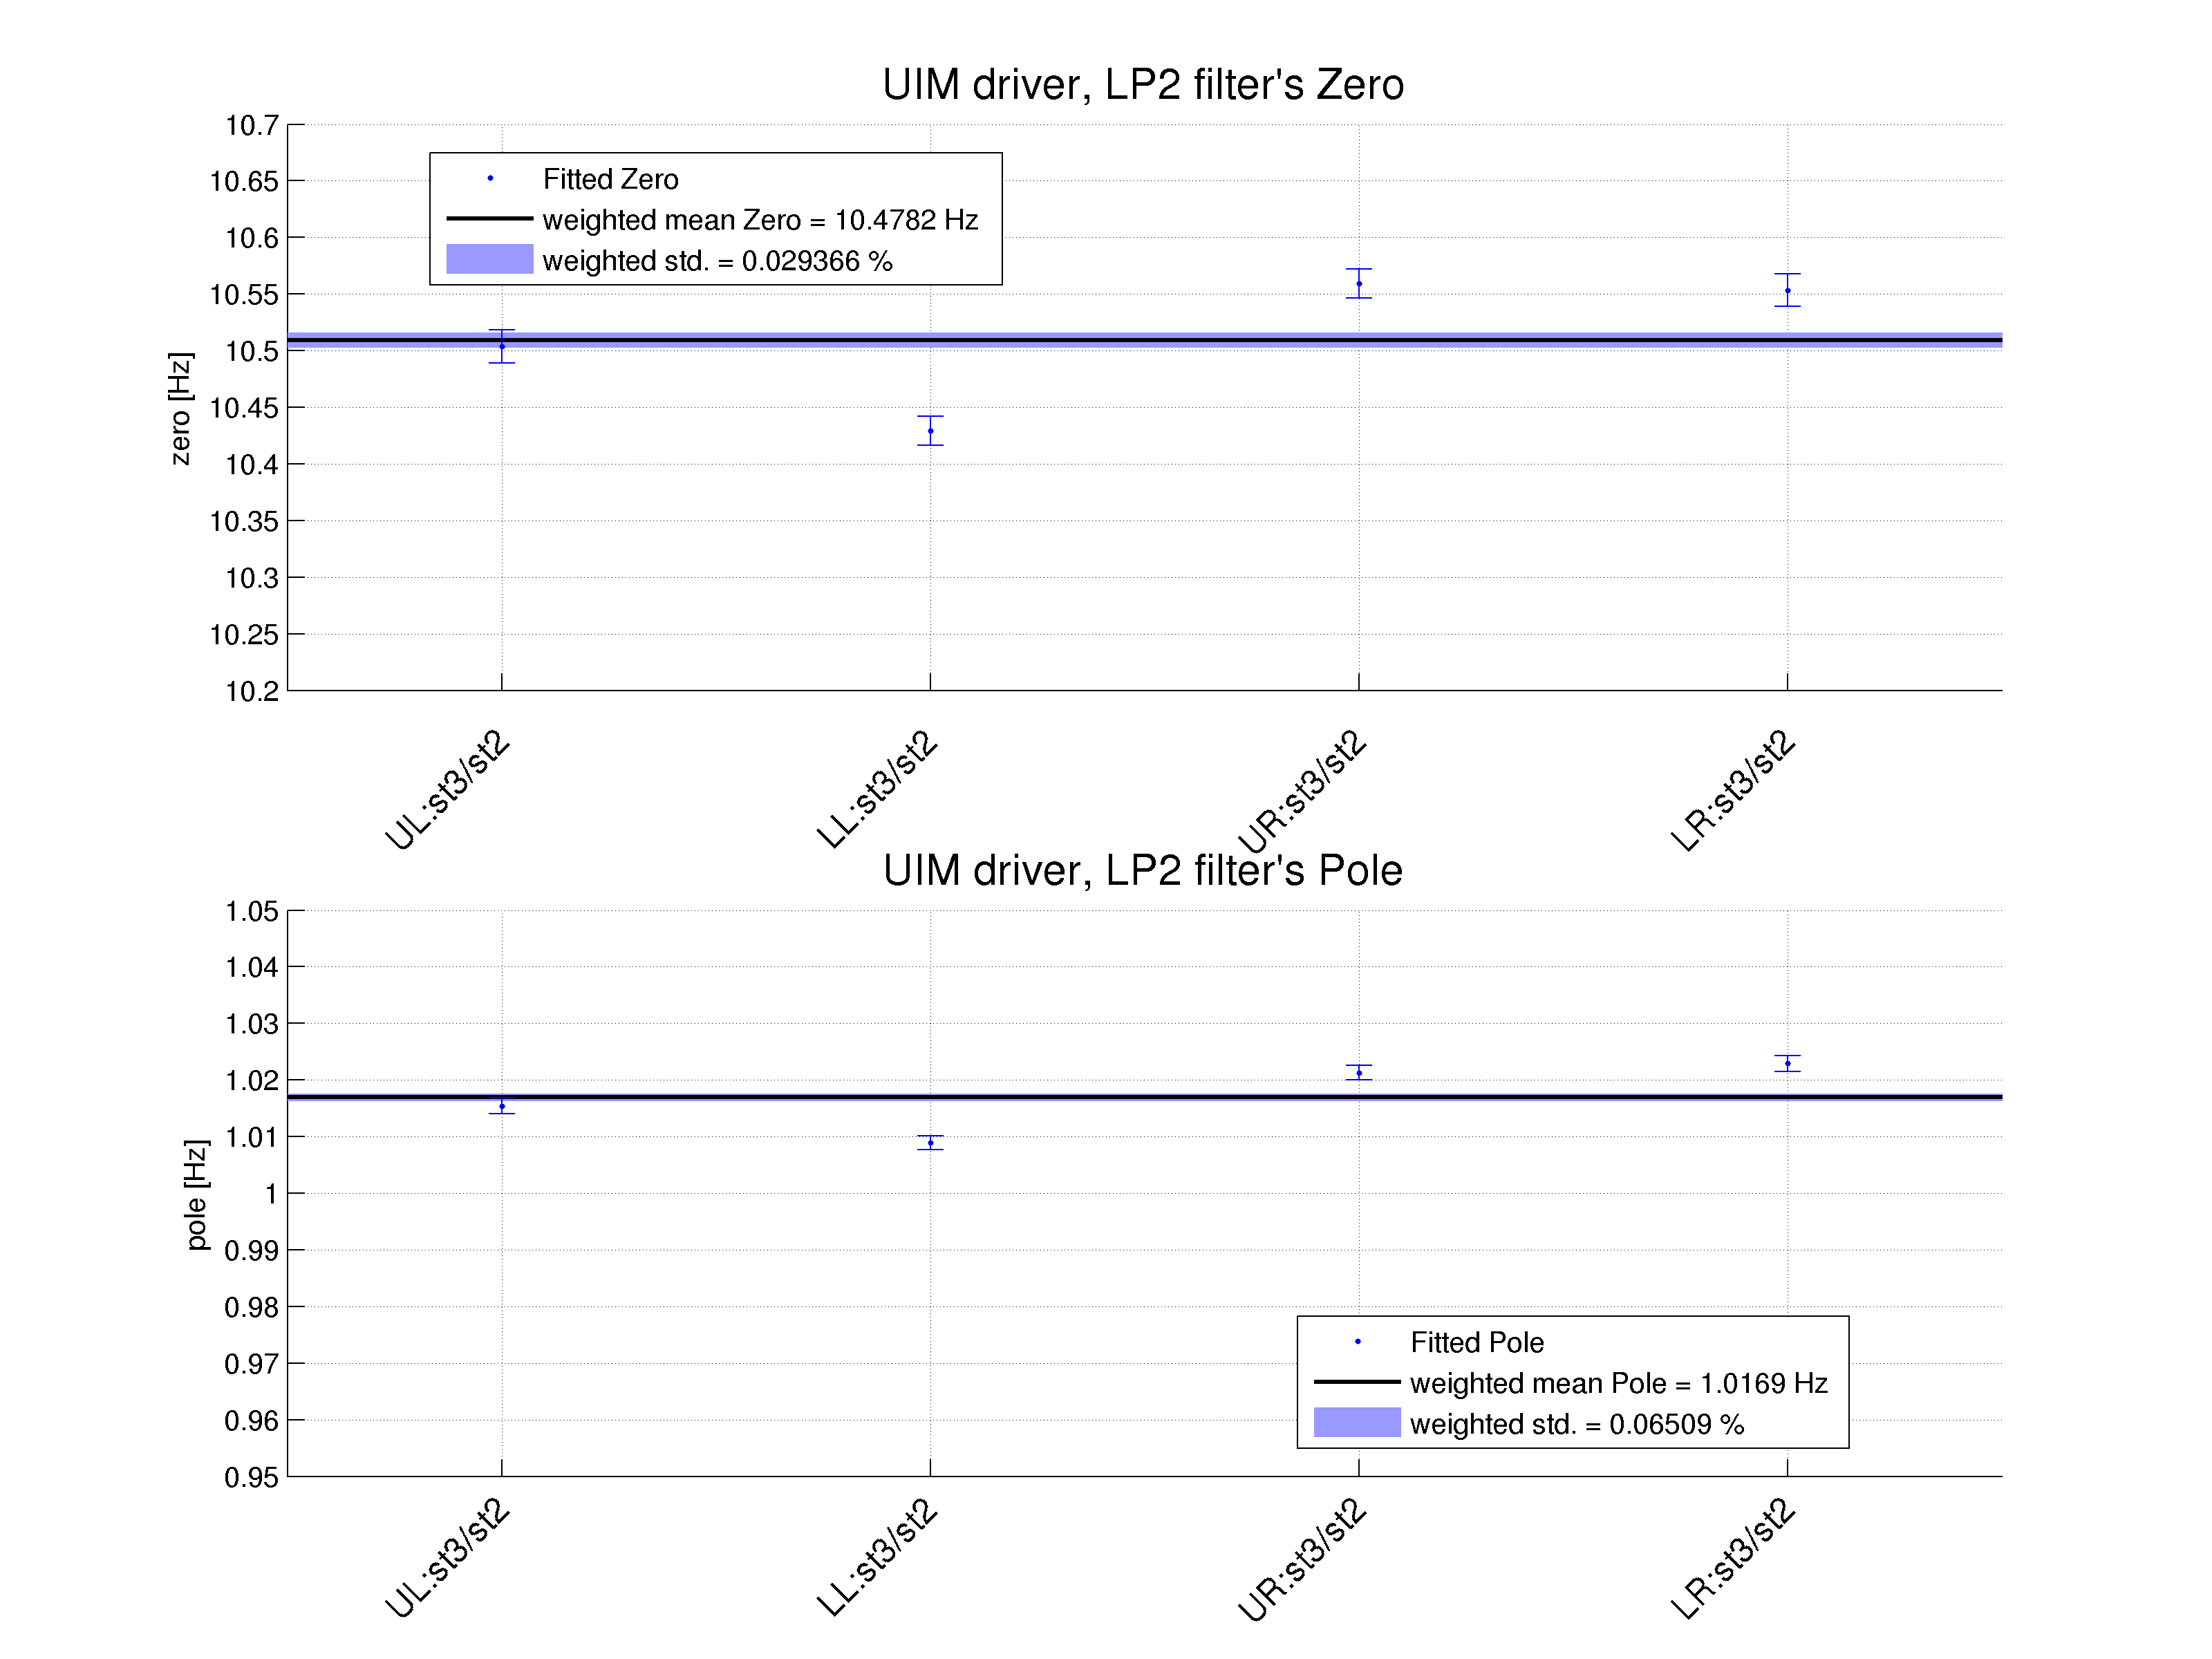
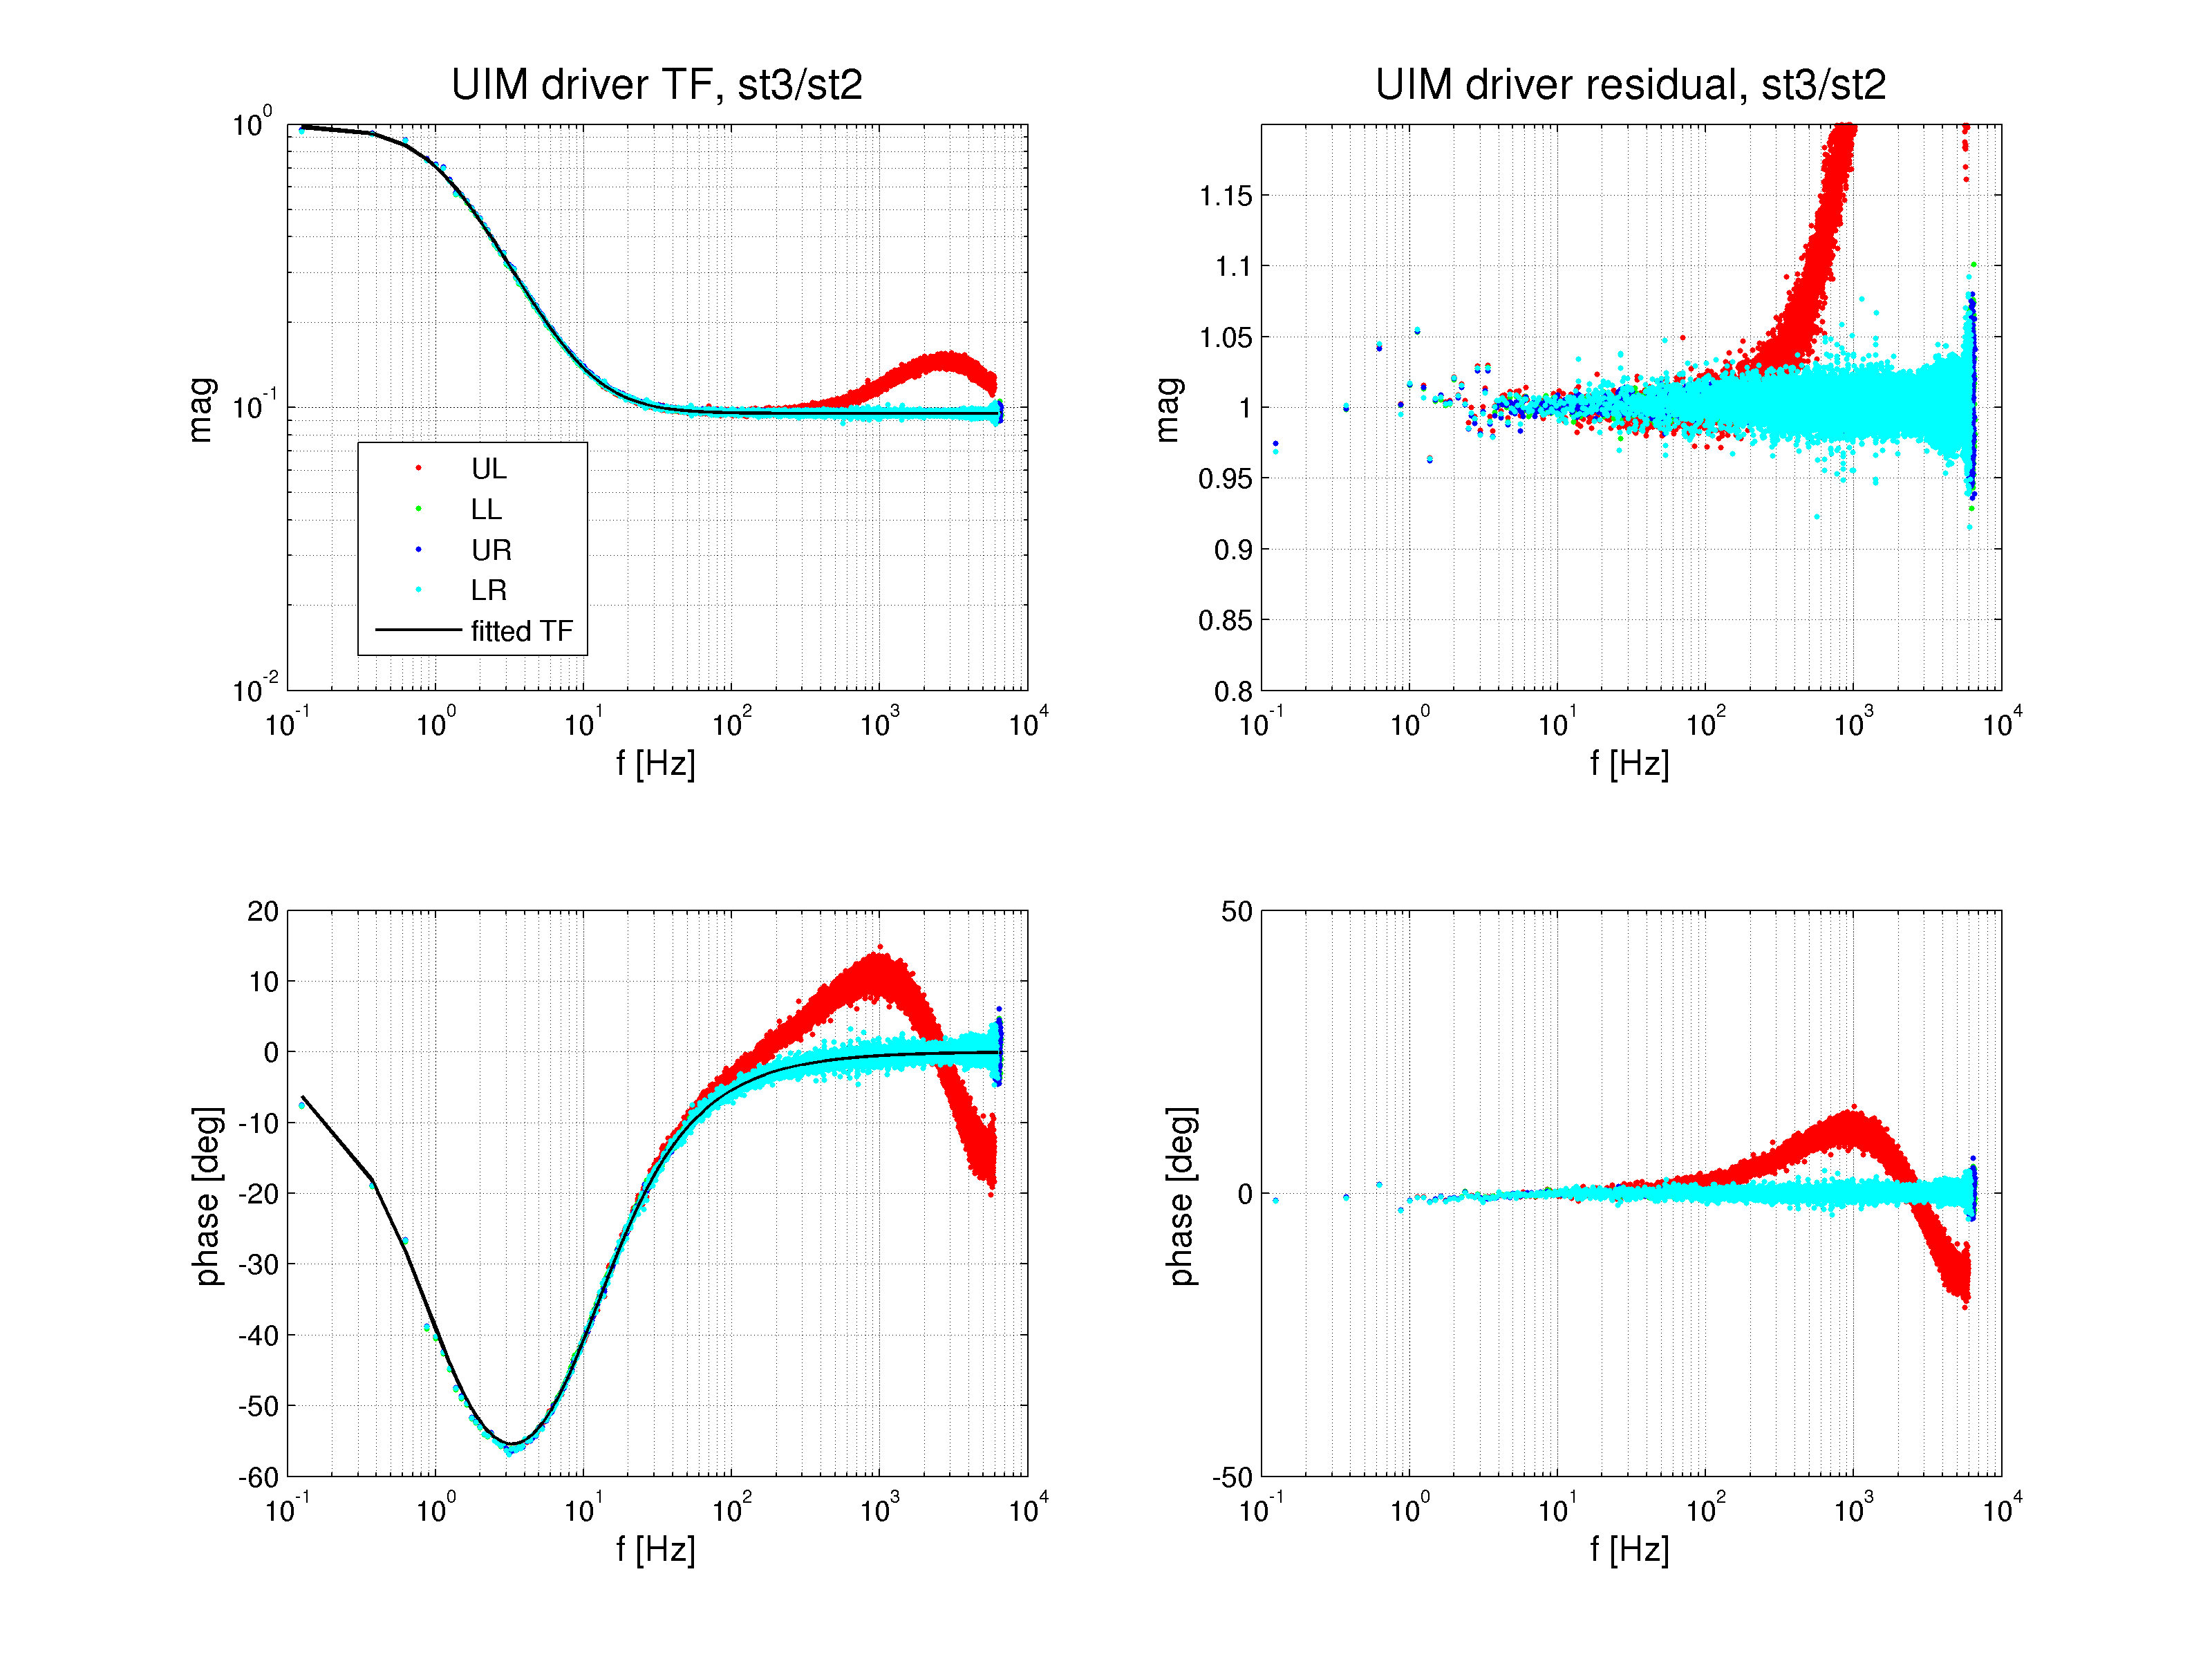
LP2
Similarly to LP1, LP2 TF was isolabed by taking the ratio of State 3 TF / State 2 TF measurements. Results of LISO fitting of one zero and one pole into the measured TF in a range [0.1 100.0] Hz are given in table 2. Plot of the fitted (model) zero-pole TF vs. measurement and the residuals are shown in the plot under the table.
Table 2. H1:SUSETMY-UIM driver LP2 fit details
=================================================
Fitted LP2 and fit uncertainty
( z : p ) [Hz]
-------------------------------------------------
UL ( 10.50 +/- 0.14 % : 1.02 +/- 0.14 % )
LL ( 10.43 +/- 0.12 % : 1.01 +/- 0.12 % )
UR ( 10.56 +/- 0.12 % : 1.02 +/- 0.12 % )
LR ( 10.55 +/- 0.13 % : 1.02 +/- 0.14 % )
=================================================
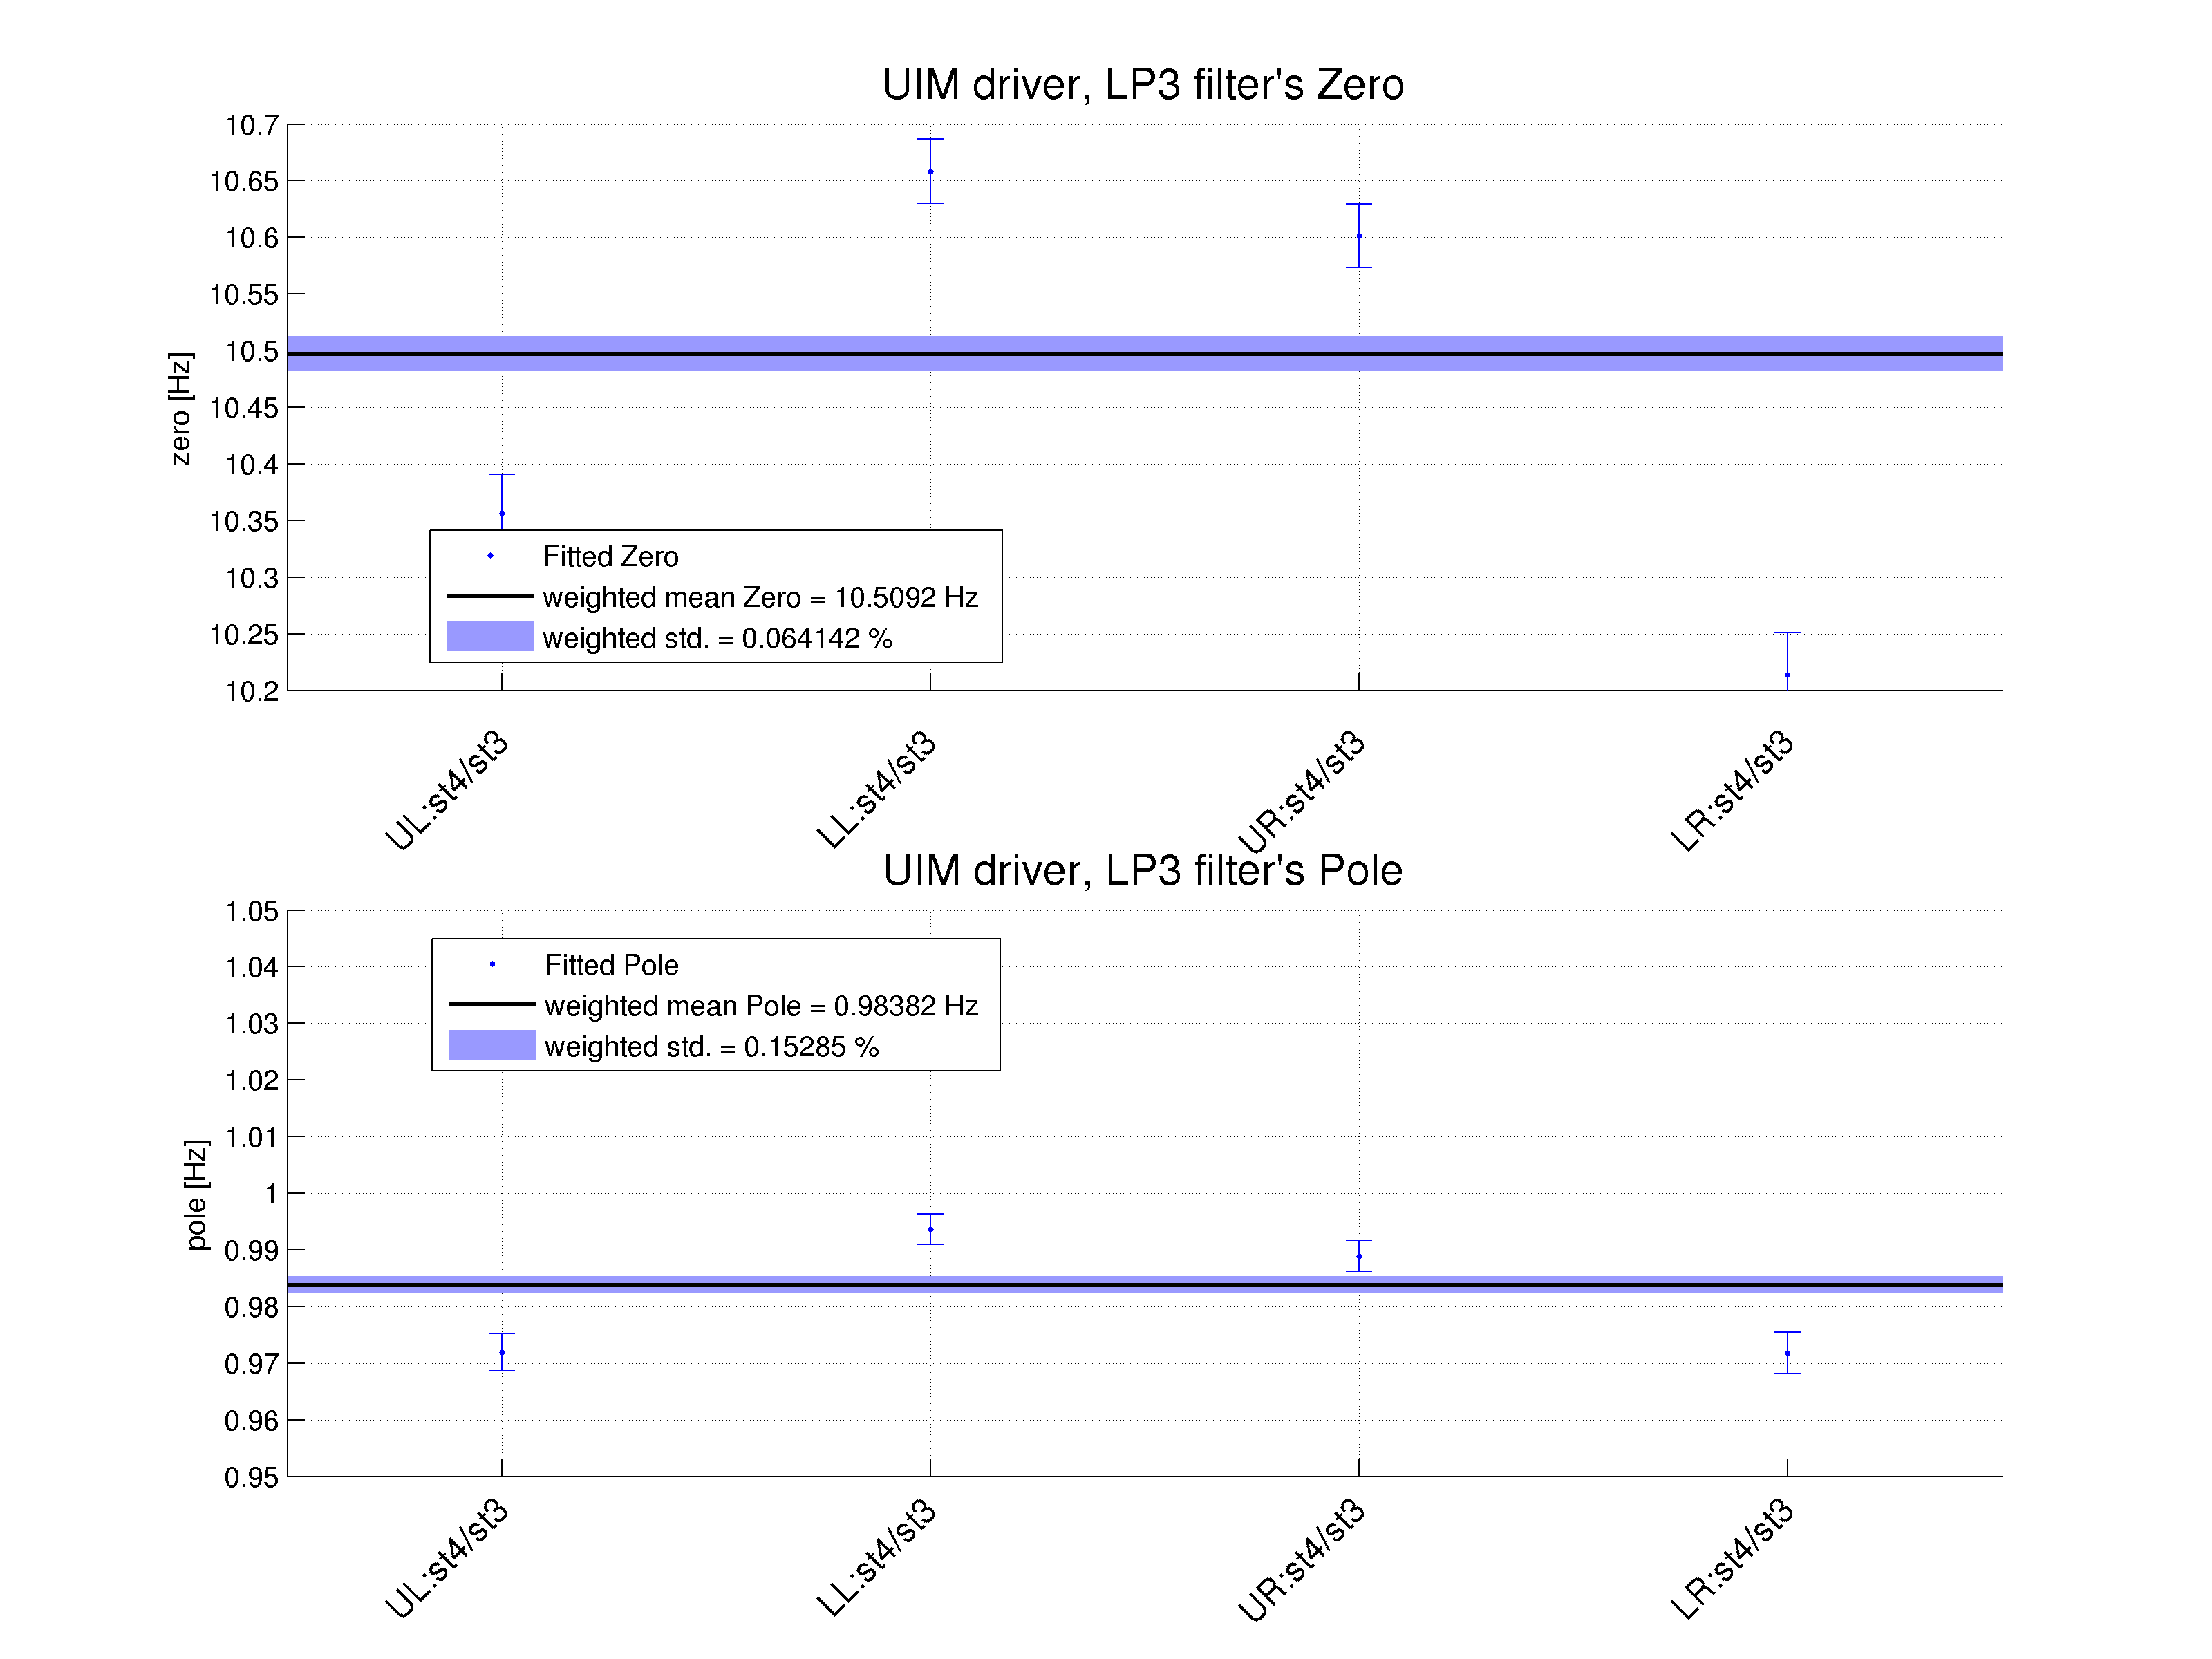
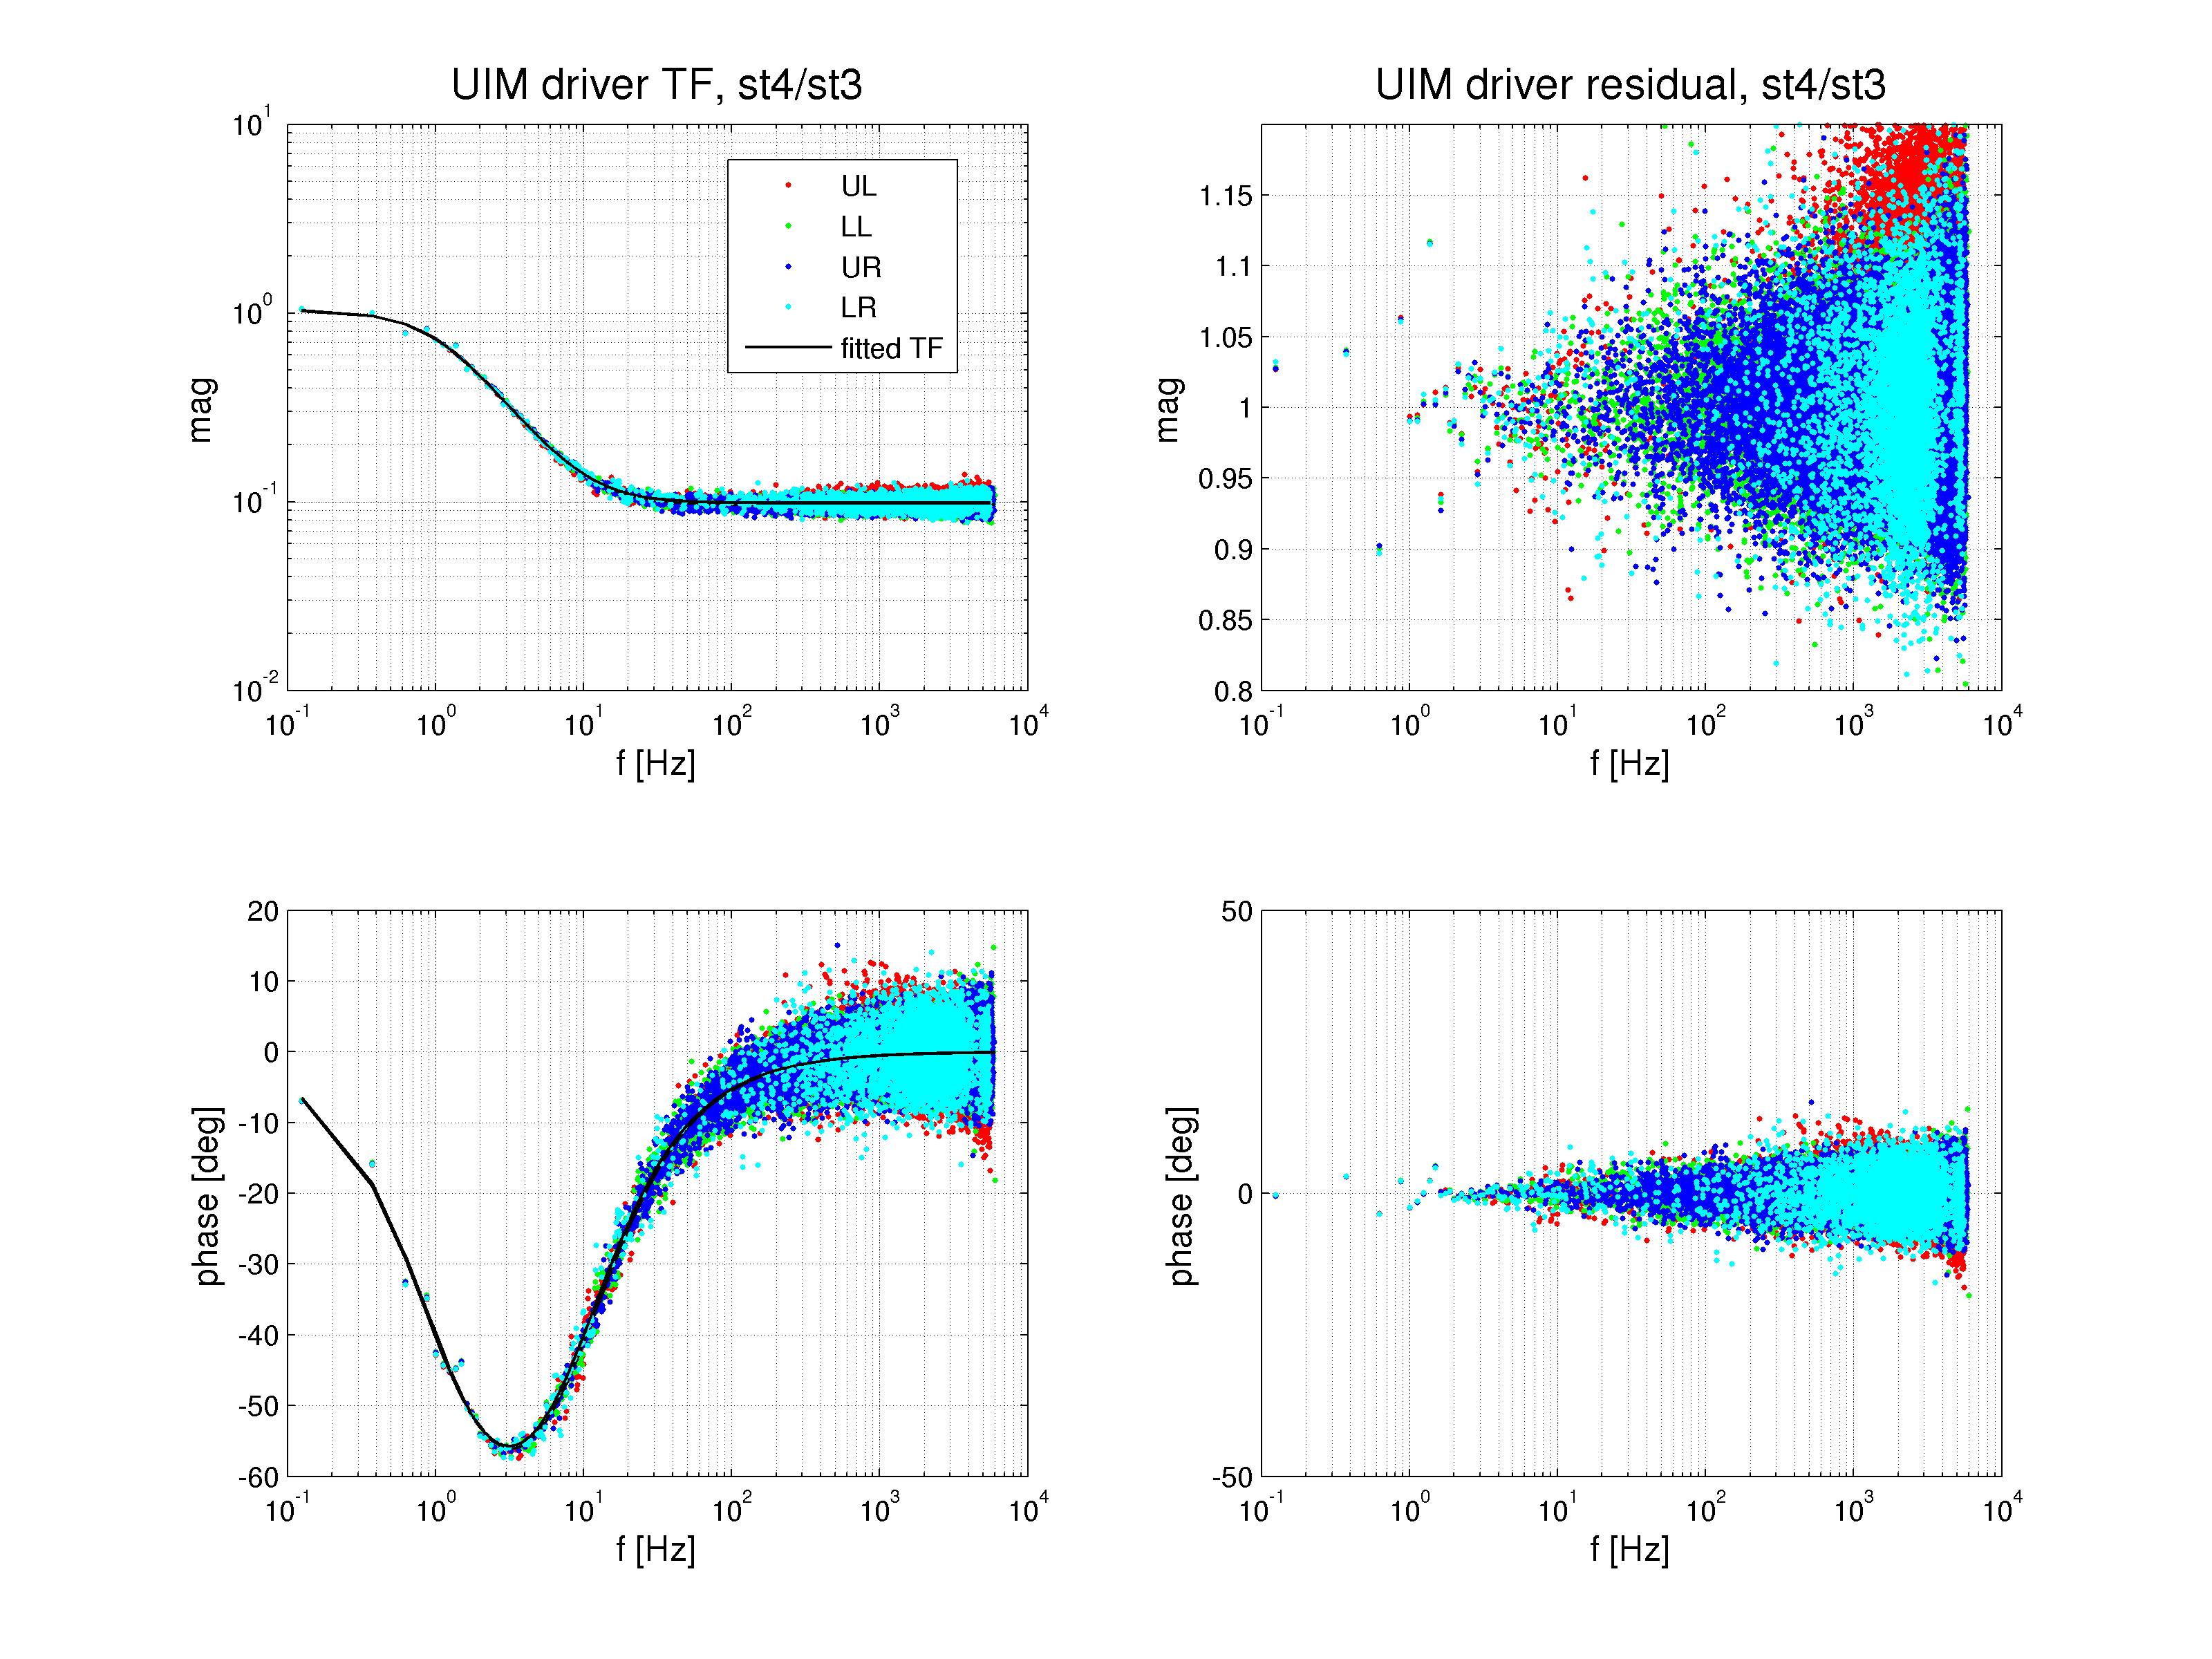
LP3
Similarly to LP1 and LP2, LP3 TF was isolabed by taking the ratio of State 4 TF / State 3 TF measurements. Results of LISO fitting of one zero and one pole into the measured TF in a range [0.1 100.0] Hz are given in table 3. Plot of the fitted (model) zero-pole TF vs. measurement and the residuals are shown in the plot under the table.
Table 3. H1:SUSETMY-UIM driver LP3 fit details
=================================================
Fitted LP3 and fit uncertainty
( z : p ) [Hz]
-------------------------------------------------
UL ( 10.36 +/- 0.33 % : 0.97 +/- 0.34 % )
LL ( 10.66 +/- 0.27 % : 0.99 +/- 0.27 % )
UR ( 10.60 +/- 0.26 % : 0.99 +/- 0.27 % )
LR ( 10.21 +/- 0.36 % : 0.97 +/- 0.37 % )
=================================================
Scripts and Plots
Measurement parameters were committed to calibration SVN:
CalSVN/aligocalibration/trunk/Runs/ER8/H1/Scripts/Electronics/H1SUSETMY_UIMDriver_$(state)_param_$(gps_time).m
The script that loads all of the measurement parameters, calls the fitting function and produces the plots was committed to the calibration SVN:
CalSVN/aligocalibration/trunk/Runs/ER8/H1/Scripts/Electronics/runFit_H1SUSETMY_UIMdriver.m
This script uses the same Matlab functions that were used for PUM coil driver electronics analysis in the same SVN directory.
Plots were committed to the calibration SVN under following names:
CalSVN/aligocalibration/trunk/Runs/ER8/H1/Results/Electronics/2015-09-07_H1SUSETMY_UIMDriver_$(short_description).pdf
CalSVN/aligocalibration/trunk/Runs/ER8/H1/Results/Electronics/2015-09-07_H1SUSETMY_UIMDriver_$(short_description).png