Jeff, Darkhan, Sudarshan, Craig, Kiwamu,
We have updated the calibration filters in CAL-CS with the latest filters.
With a Pcal sweep measurement, we have confirmed that the current calibration is accurate within 10 % in magnitude and 5 deg in phase.
Calibration on the front end side is done.
(Verification measurement)
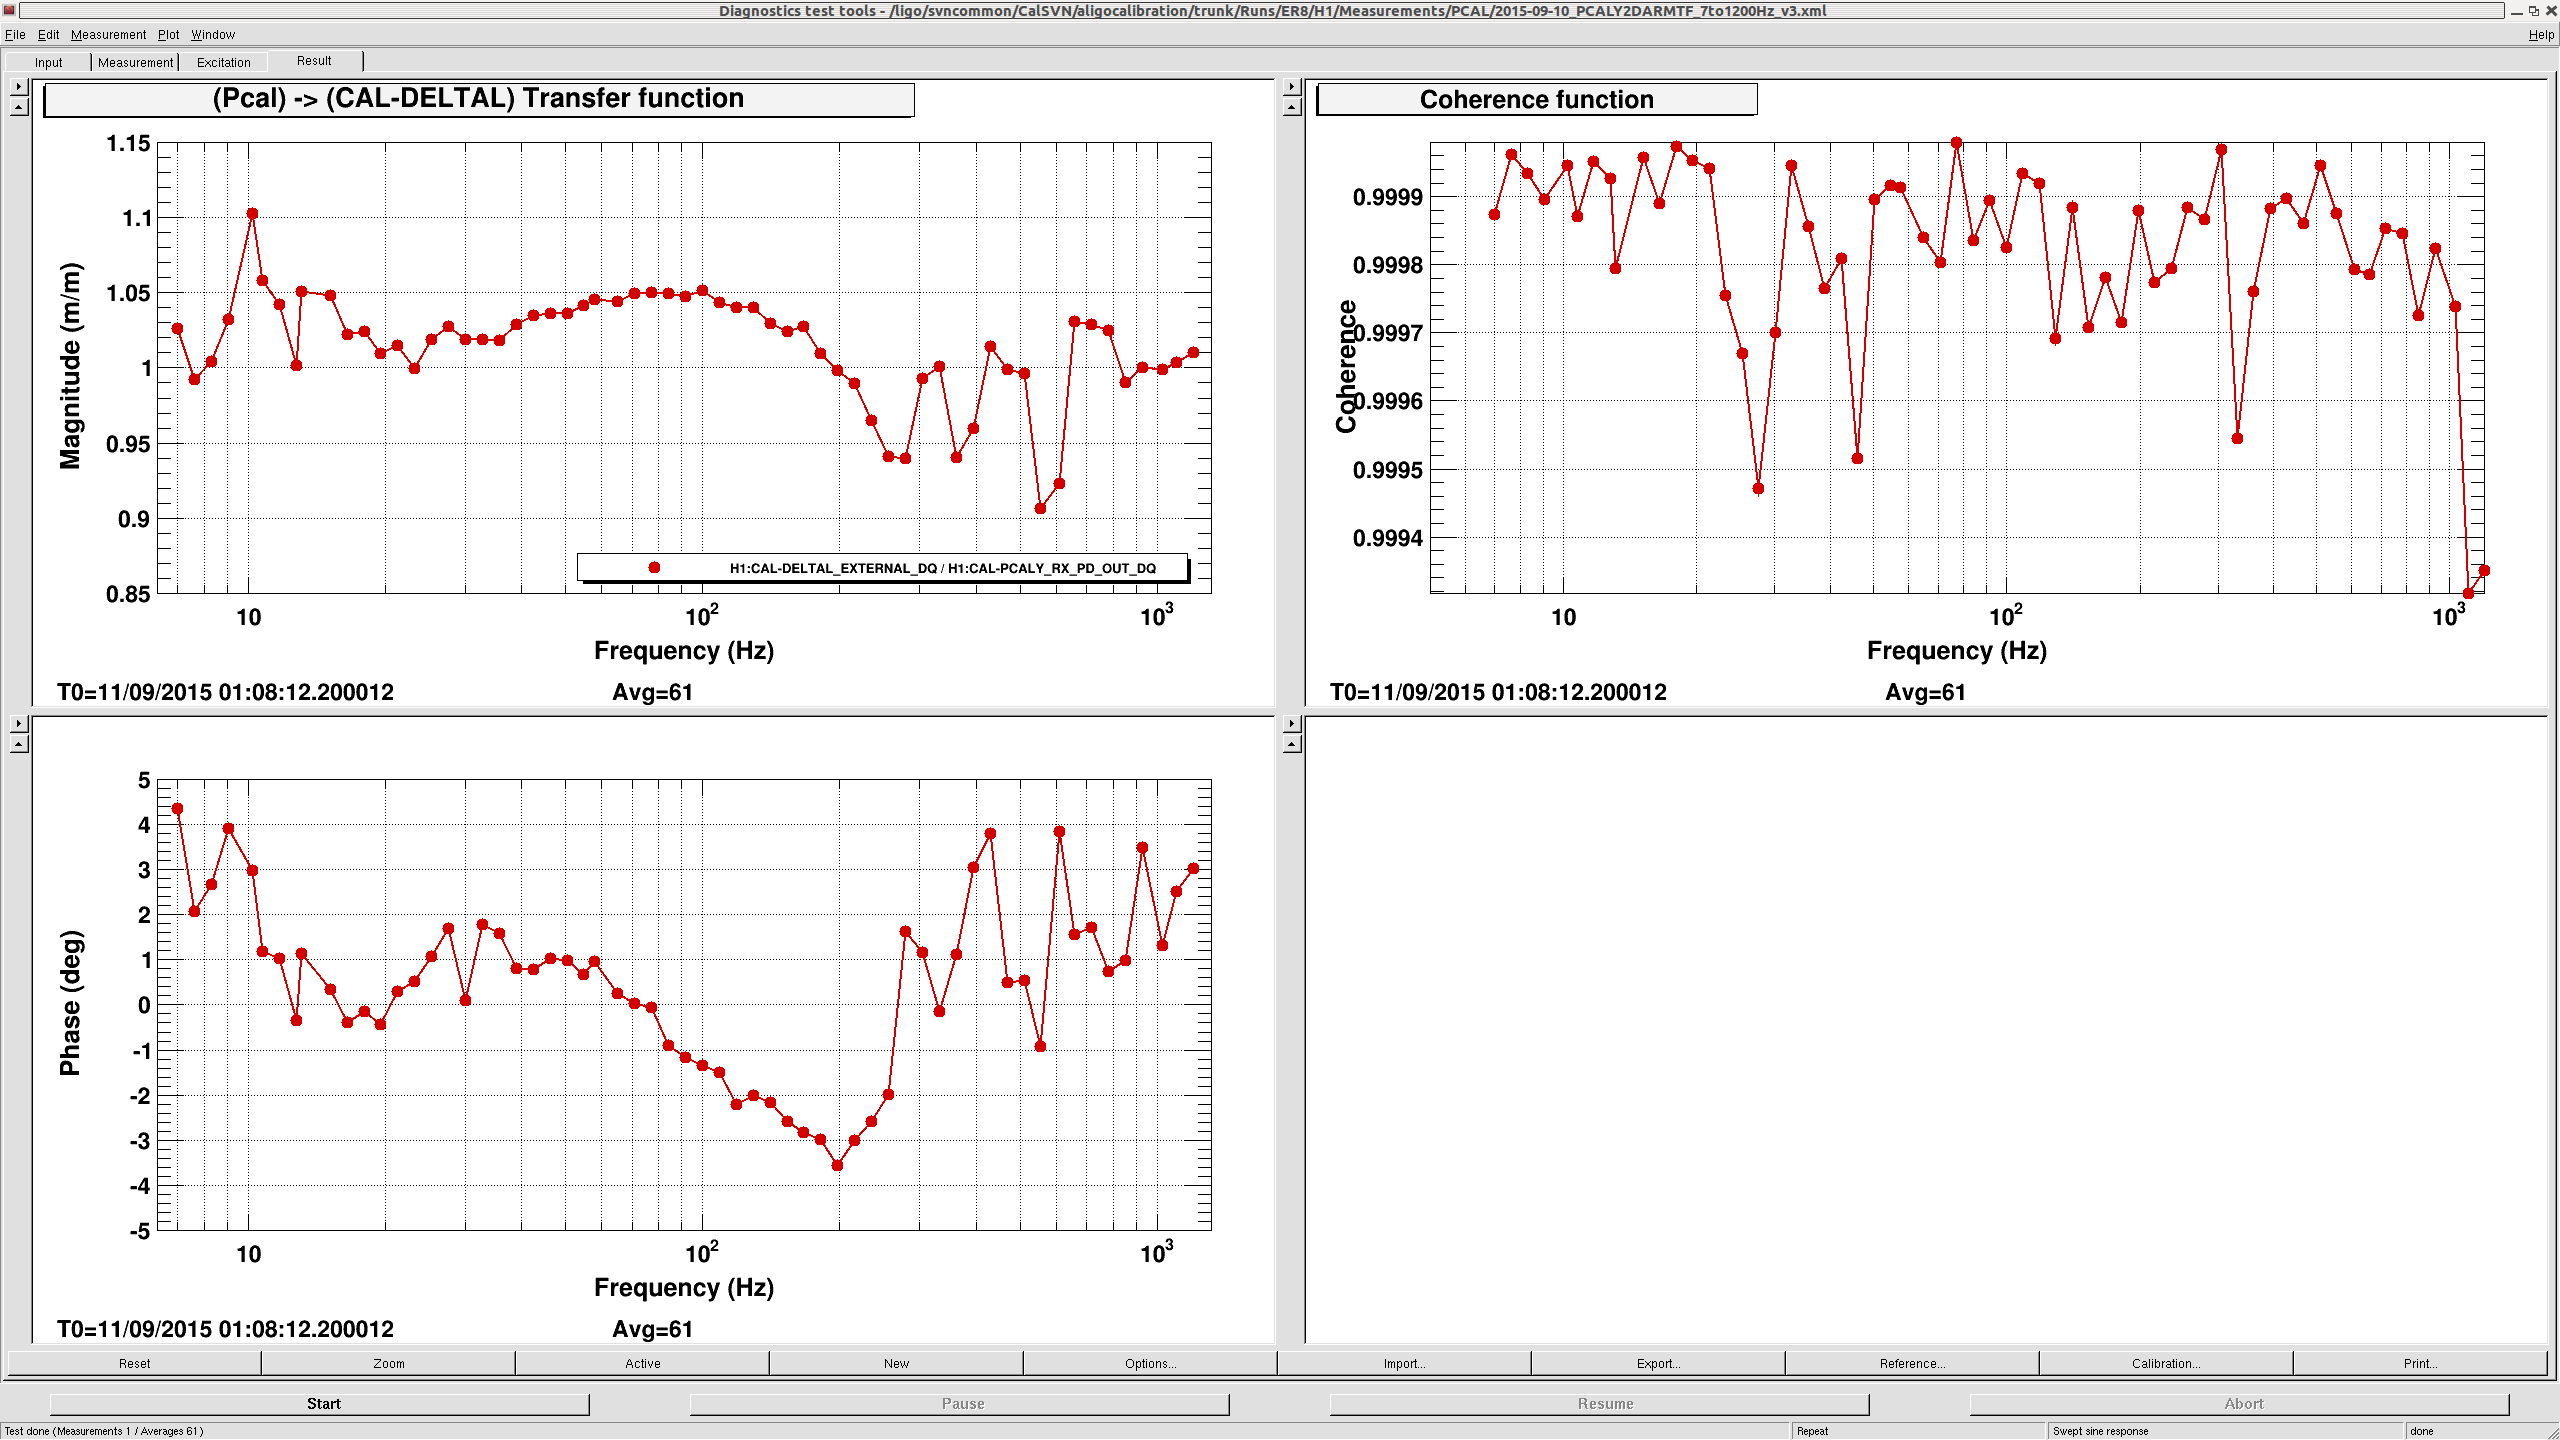
The above screen shot shows a measured transfer function from displacement estimated by Pcal Y to displacement estimated by CAL-CS. They agree within +/- 10 % in magnitude and +/- 5 deg in phase all across the frequency band we swept. Note that one data point at 10 Hz showed magnitude that is slightly above 10%, but this was not repeatable and therefore we don't think it is a reliable data point. We measured the same transfer function three times within the same lock stretch and saw the magnitude changing to a value between 0.85 and 1.1 at this particular frequency point. We are guessing that this is due to a bounce mode confusing our measurement.
Also, even though the coherence was high all across the frequency band, the data points below 30 Hz seemed to change in magnitude in every sweep. So we increased the integration time from 3 sec to 6 sec which seemed to improved the flatness.
The optical gain was adjusted by measuring the sensing function with a Pcal sweep within the same lock stretch. This gave me a 341 Hz cavity pole (which is the same as two nights ago, alog 21352) and an optical gain of 8.834e-7 meters/counts. Both the parameters are now loaded into the CALCS foton file and enabled.
(Phase correction)
Sudarshan will make a separate alog on this topic, but a trick to get this beautiful plot was to properly incorporate the know time delays. Based on our knowledge, we have included a 115 usec = (41 + 61 + 13 usec) time delay. If we did not remove the delay, the phase would have been off by 40 deg at 1 kHz.
(An extra measurement)
Independently of the calibration validation measurement, we did a simple measurement -- check the binary range with and without the calibration lines. Here is the relevant time stamps:
- Sep-11-2015 1:45:25 UTC, calibration lines turned off, not exctiations, fully locked at NOMINAL_LOSWNOISE
- Sep-11-2015 1:59:06 UTC, calibration lines turned back on.
- Sep-11-2015 2:50:03 UTC, unlocked
We will check the range later.
All the data are accessible at the following SVN locations:
DARM open loop measurements
aligocalibration/trunk/Runs/ER8/H1/Measurements/DARMOLGTFs/2015-09-10_H1_DARM_OLGTF_7to1200Hz.xml
aligocalibration/trunk/Runs/ER8/H1/Measurements/DARMOLGTFs/2015-09-10_H1_DARM_OLGTF_7to1200Hz_halfamp.xml
For the analysis, I have used the first measurement. The second measurement was meant to assess repeatability of the measurement by applying the half size of the usual excitation in DARM.
Pcal to DARM responses:
aligocalibration/trunk/Runs/ER8/H1/Measurements/PCAL/2015-09-10_PCALY2DARMTF_7to1200Hz.xml
aligocalibration/trunk/Runs/ER8/H1/Measurements/PCAL/2015-09-10_PCALY2DARMTF_7to1200Hz_v2.xml
aligocalibration/trunk/Runs/ER8/H1/Measurements/PCAL/2015-09-10_PCALY2DARMTF_7to1200Hz_v3.xml
The final plot, that I have posted above, is from the third measurement in which I have doubled the integration time in order to obtain better signal-to-noise ratio.
DARM paramter file (as reporeted in alog 21386):
aligocalibration/trunk/Runs/ER8/H1/Scripts/DARMOLGTFs/H1DARMparams_1125963332.m
On 2015-09-12 06:30:00, the gain from the DCPD sum to DARM IN1 was 3.477×10⁻⁷ ct/mA. Therefore, using Kiwamu's number of 8.834×10⁻⁷ m/ct, this gives the optical gain as 3.26 mA/pm. (One stage of DCPD whitening.)