Summary:
I was baffled to find that each and every omega scan I have seen so far shows some wandering lines in H1:IMC-PZT_PIT_OUT_DQ and YAW that extends to hundreds of Hz, e.g.
https://ldas-jobs.ligo-wa.caltech.edu/~nairwita/wdq/H1_1126294545/#H1:IMC
These wandaring lines seem to be irrelevant of any of the glitches, and they're there even when there is no fast feedback to the PZT (indeed, since Sept. 09 the fast feedback has been disabled https://alog.ligo-wa.caltech.edu/aLOG/index.php?callRep=21300).
This is an artefact of single precision rounding error that happens when the data is saved on frame files (in the frontend the data is double).
That tells us that we need to be careful when looking at signals with big DC and small AC.
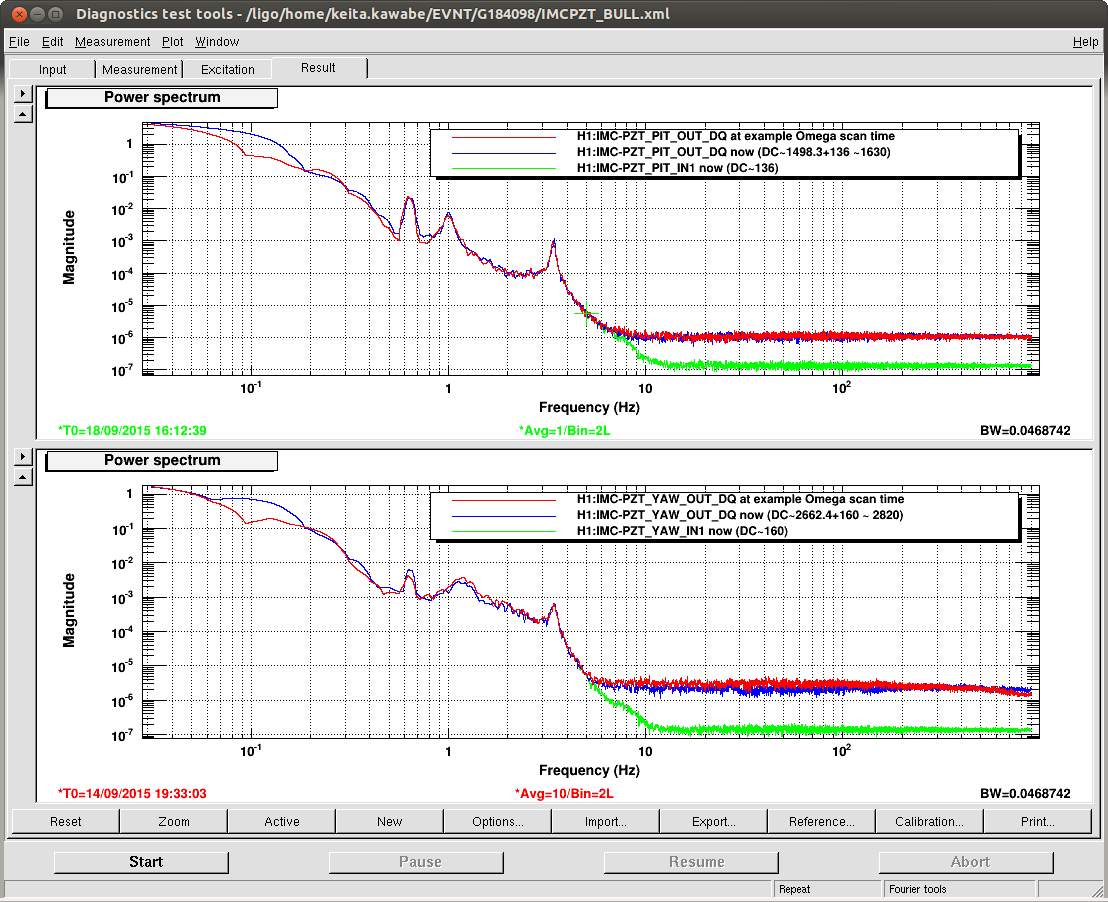
Analysis 1: Measured long data spectrum VS predicted single precision rounding error spectrum agree very well.
When you look at the first attachment, you'll see that PZT_OUT and PZT_IN1 are different now (blue and green) though the only difference should be that the former has a fixed offset added in. Also, the ratio of the noise level above 20Hz is approximately equal to the ratio of the DC value.
Though the rounding error spectrum depends on the wave form before the casting, if you take a long (relative to the frequency analyzed) data and make an average, like I did here, you can expect that it becomes white-ish. Since the RMS of the signals are totally dominated by the DC, and since I know that the exponents did not change during the measurement, you can calculate the expected white-ish noise spectrum as
2^(floor(log2(DC level))) / 2^23 / sqrt(12) / sqrt(1024),
i.e. 1.1E-6 /sqrtHz and 2.2E-6 for PZT PIT and YAW OUT respectively, which perfectly agree with the measured noise floor. 1/2^23 is a "1-bit" fraction, and 1/sqrt(12) because the RMS of +-0.5 bit fraction is 1/sqrt(12) bits when you assume a uniform distribution, and sqrt(1024) because this is first down sampled into 2kHz and then cast into single.
Analysis 2: Short data spectrum shows wandering structures
Since what we really want to know is short term variability at around 100Hz, I looked at the 6Hz BW spectrum.
In the video attachment, on the top is IMC-DOF_3_Y_IN1_DQ signal, which is the error point of one of ASC sensors and that's the only signal that goes to PZT YAW. On the bottom is the IMC-PZT_YAW_OUT_DQ.
Red are short data spectrum (2 averages exponential), blue are the long spectrum (0.047HZ, 10 averages fixed). This is from around the same GPS time as the example omega scan time.
Look how variable the bottom is, you can easily see the same thing as Omega scan!
This is not the case with the top plot. This is because the DOF3 signal is NOT limited by the single precision casting due to small DC value relative to the noise floor. DOF3 signal is zero on average, and RMS is almost always smaller than 0.05, so the expected rounding error noise floor is in the vicinity of 10^-10 to 10^-11/sqrtHz.
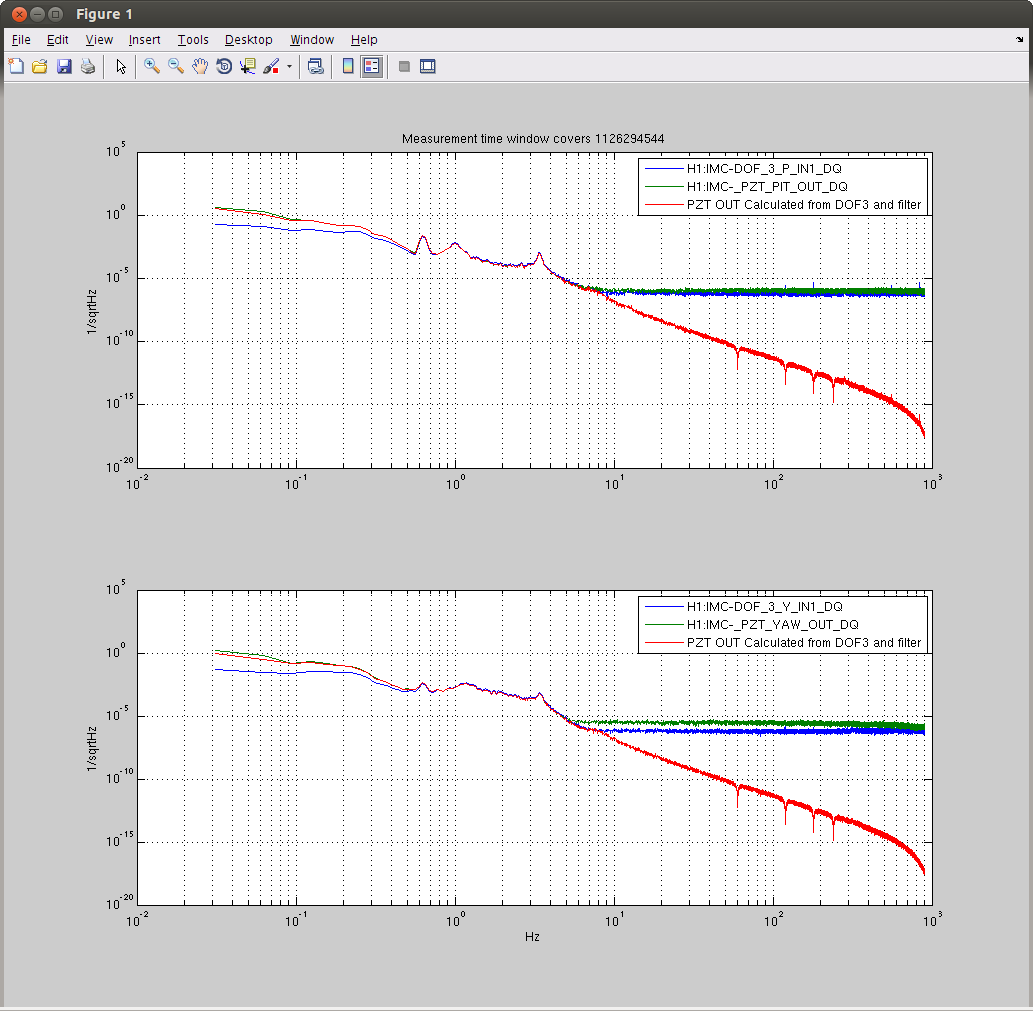
Analysis 3: How large is the "true" noise going to PZTs?
Third attachment shows DOF_3_PIT_IN1_DQ and YAW (these are the only source of PZT feedback after Sept. 09) at the example omega scan time, projected on the PZT output using the DOF3 filter. This can be regarded as the "true" noise as the high frequency noise of DOF3 is not limited by the rounding error.
Anyway, as you can see, PZT_OUT spectrum is at least 5 orders of magnitude larger than the "true" noise level at 100Hz, and there's nothing to worry about.