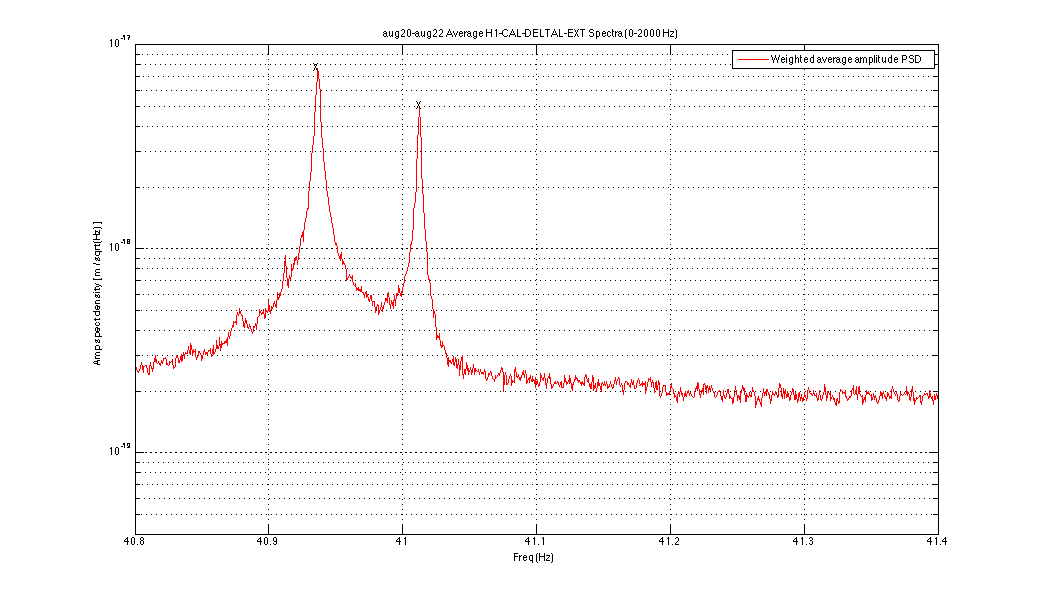
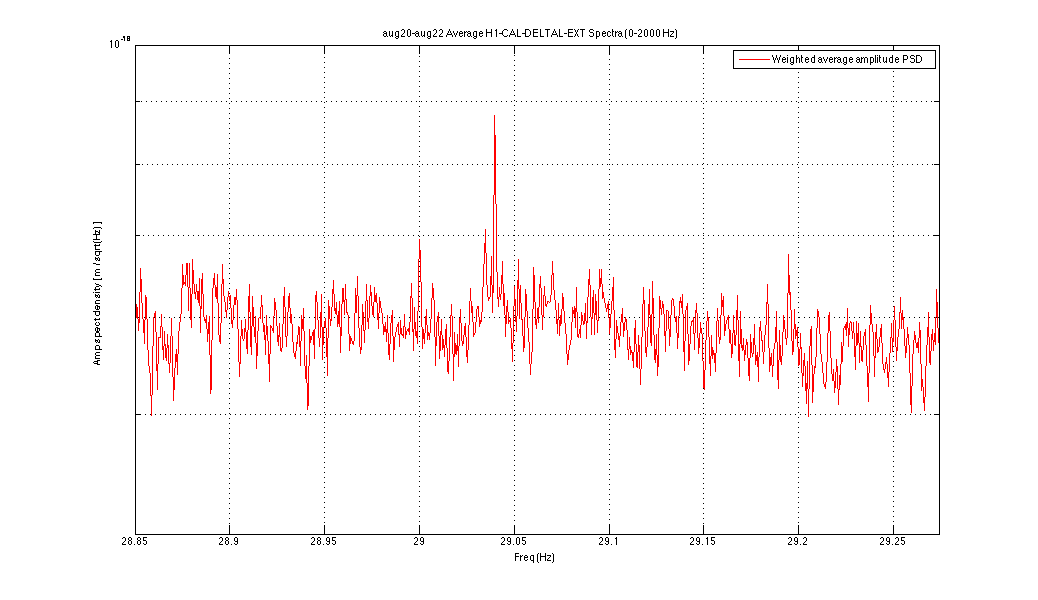
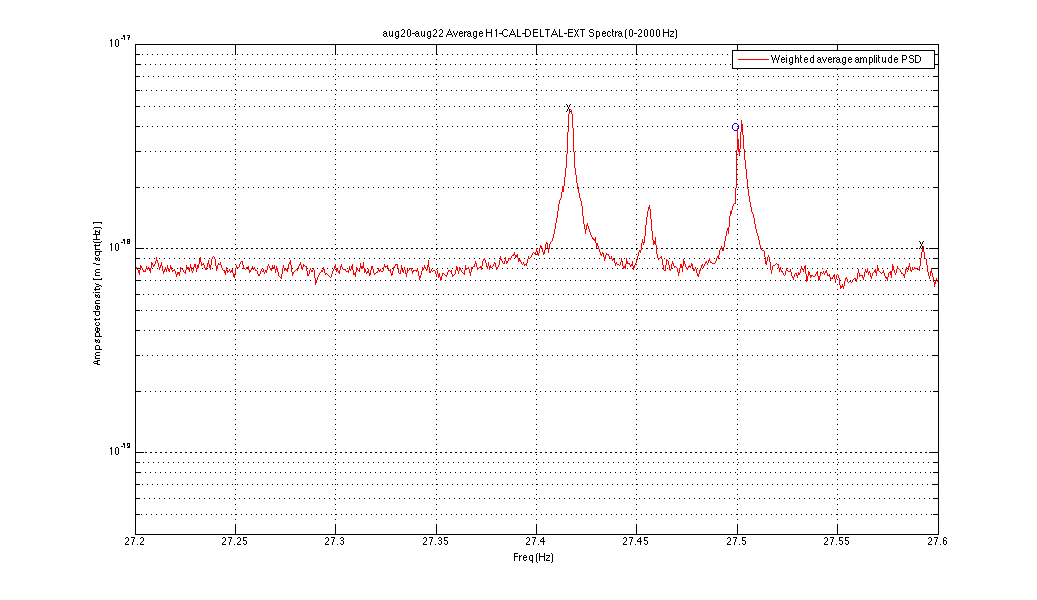
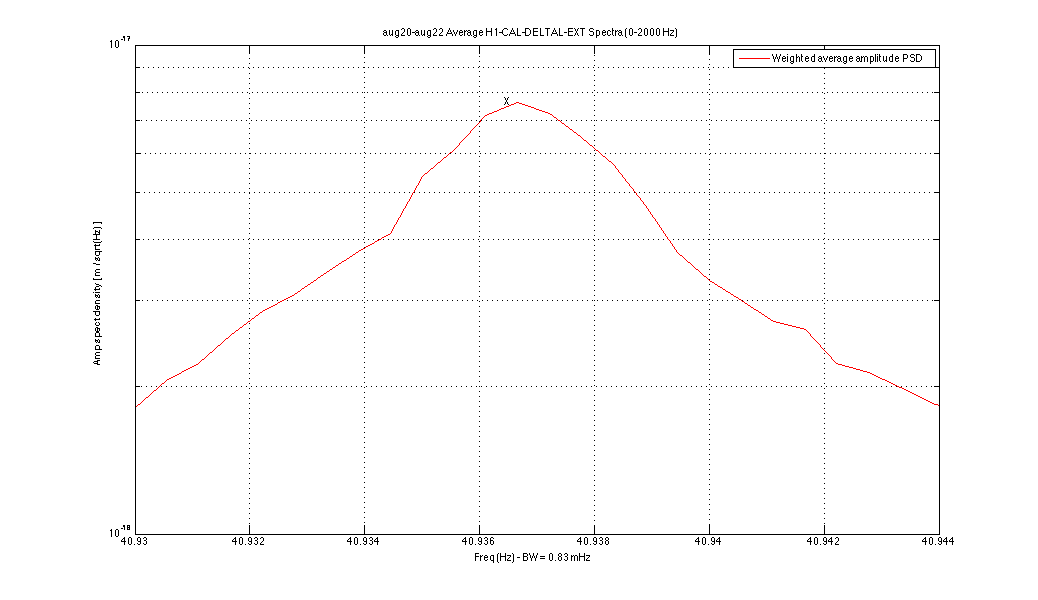
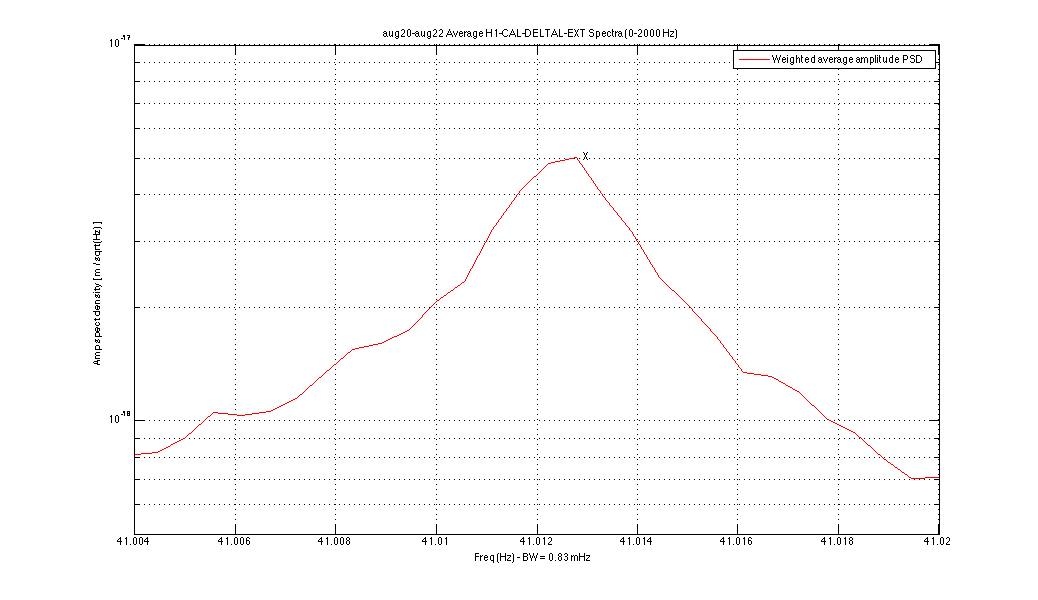
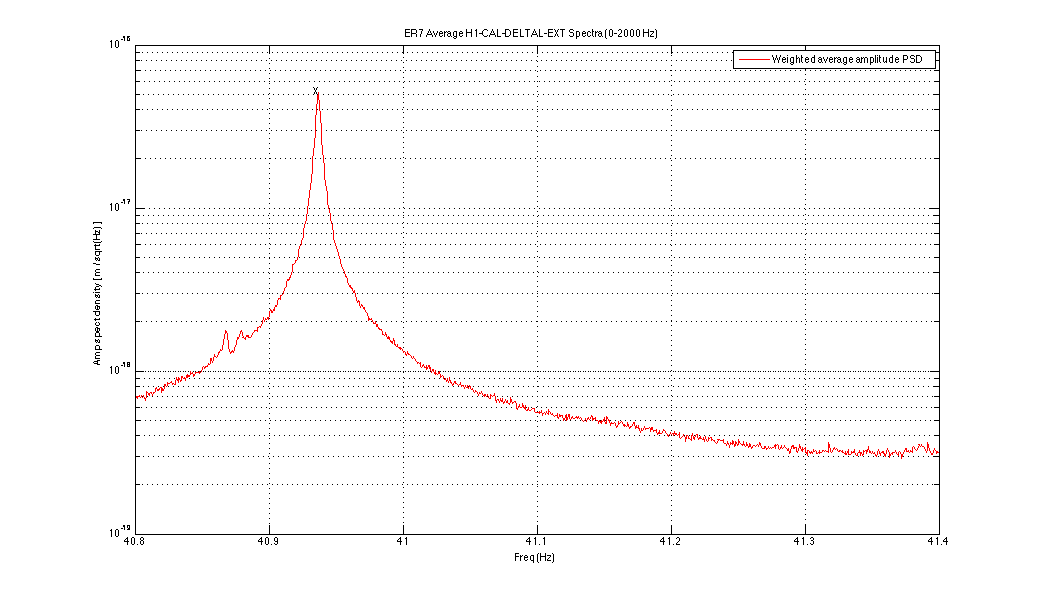
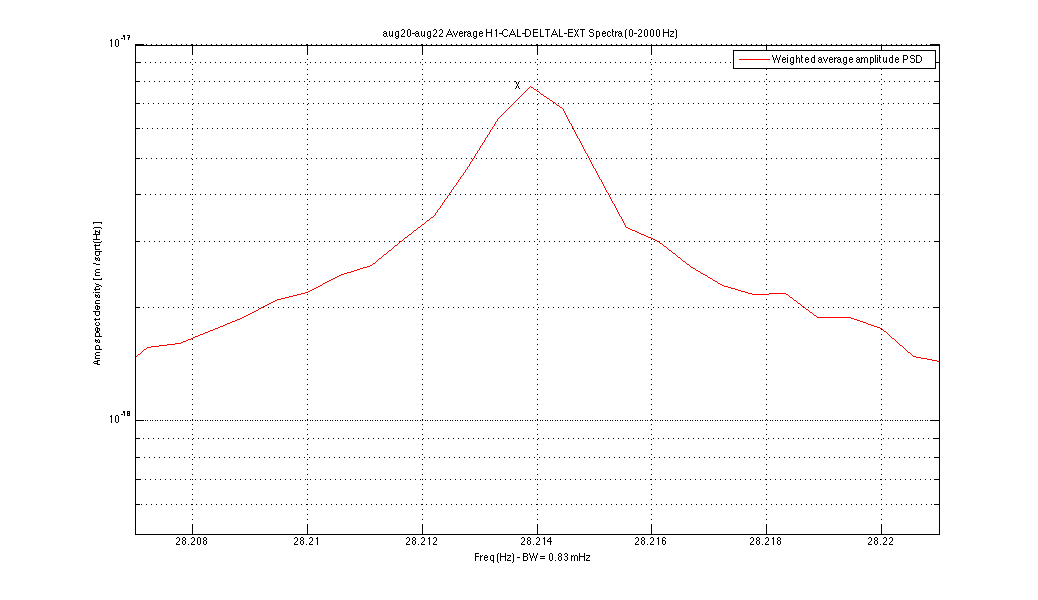
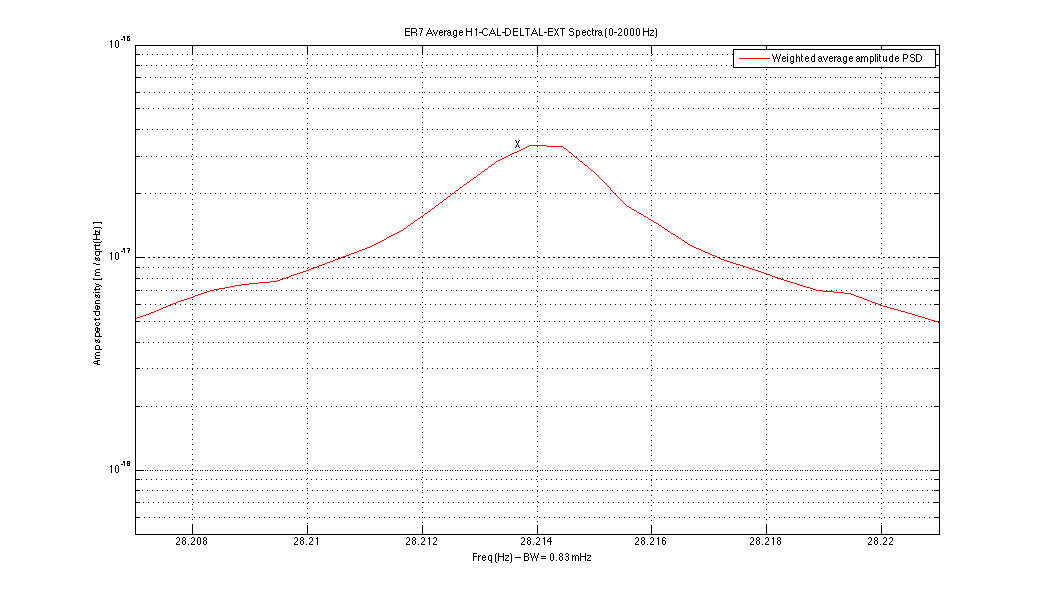
It was noted recently elsewhere that there are a pair of lines in DARM near 41 Hz
that may be the roll modes of triplet suspensions. In particular, there is
a prediction of 40.369 Hz for the roll mode labeled ModeR3.

Attached is a zoom of displacement spectrum in that band from 50 hours of early
ER8 data. Since one naively expects a bounce mode at 1/sqrt(2) of the roll mode,
also attached is a zoom of that region for which the evidence of
bounce modes seems weak. The visible lines are much narrower,
and one coincides with an integer frequency.

For completeness, I also looked at various potential subharmonics  and harmonics
of these lines, in case the 41-Hz pair come from some other source with non-linear coupling.
The only ones that appeared at all plausible were at about 2/3 of 41 Hz.

Specifically, the peaks at 40.9365 and 41.0127 Hz have potential 2/3 partners at
27.4170 and 27.5025 Hz (ratios: 0.6697 and 0.6706) -- see 3rd attachment. The
non-equality of the ratios with 0.6667 is not necessarily inconsistent with a harmonic
relation, since we've seen that quad suspension violin modes do not follow a strict harmonic
progression, and triplets are almost as complicated as quads. On the other hand, I do not see
any evidence at all for the 4th or 5th harmonics in the data set, despite the comparable strain
strengths seen for the putative 2nd and 3rd harmonics.

Notes:
* The frequency ranges of the three plots are chosen so that the two peaks would
appear in the same physical locations in the graphs if the nominal sqrt(2) and 2/3 relations were exact..
* There is another, smaller peak of comparable width between the two peaks near 27 Hz,
which may be another mechanical resonance.
* The 27.5025-Hz line has a width that encompasses a 25.5000-hz line that is part of a
1-Hz comb with a 0.5-Hz offset reported previously.
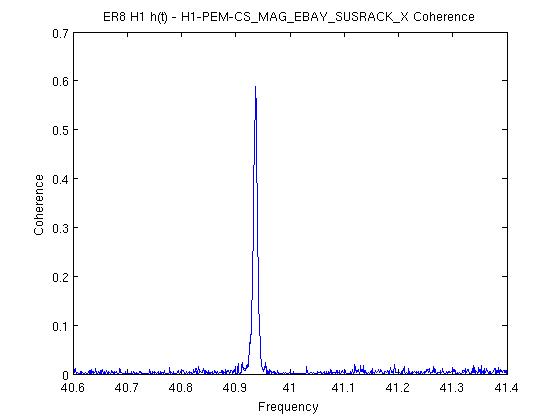
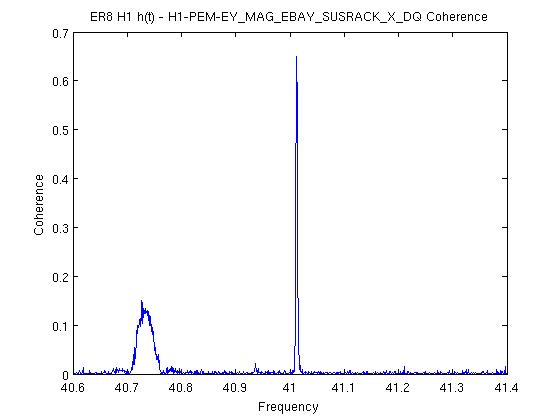
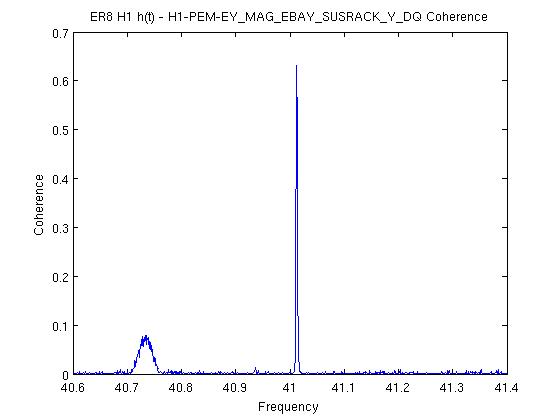
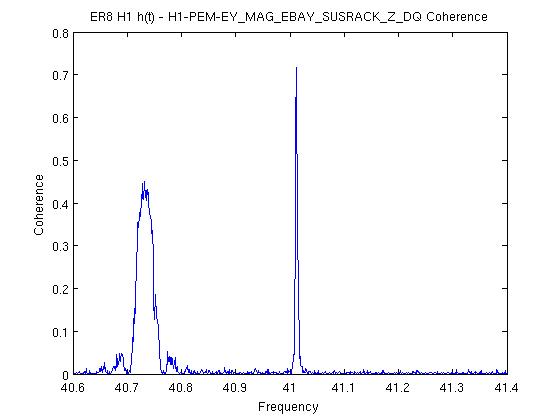
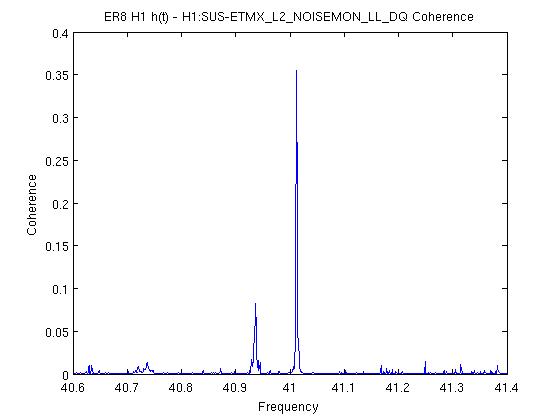
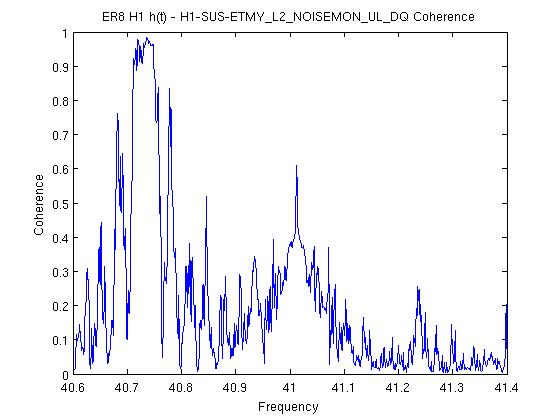
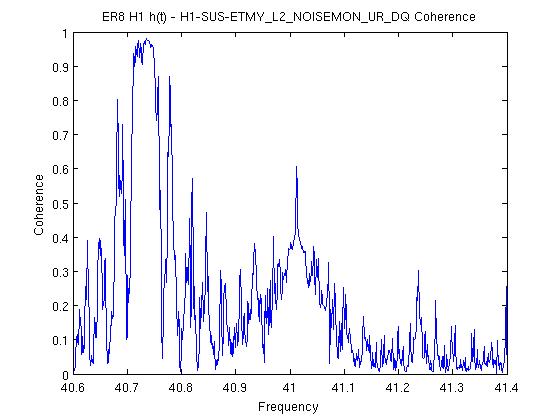
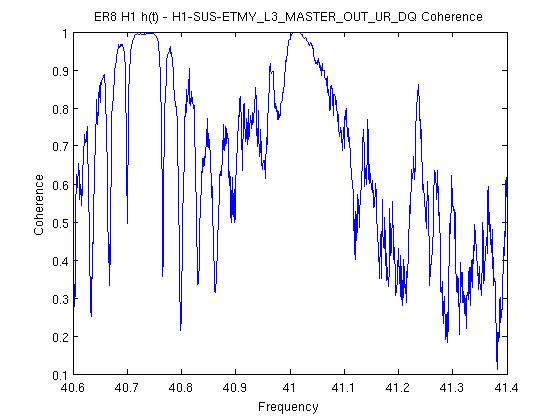
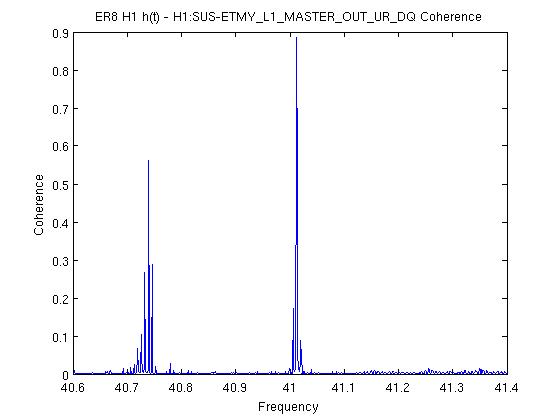
We are looking for the source of the 41 Hz noise lines.
We used the coherence tool results for a week of ER8, with 1 mHz resolution:
https://ldas-jobs.ligo-wa.caltech.edu/~eric.coughlin/ER7/LineSearch/H1_COH_1123891217_1124582417_SHORT_1_webpage/
and as a guide looked at the structure of the 41 Hz noise, as seen in the PSD posted above by Keith.
Michael Coughlin then ran the tool that plots coherence vs channels,
https://ldas-jobs.ligo-wa.caltech.edu/~mcoughlin/LineSearch/bokeh_coh/output/output-pcmesh-40_41.png
and made the following observations

Please see below. I would take a look at the MAGs listed, they only seem to be spiking at these frequencies.
The channels that spike just below 40.95:
 H1:SUS-ETMY_L3_MASTER_OUT_UR_DQ
 H1:SUS-ETMY_L3_MASTER_OUT_UL_DQ
 H1:SUS-ETMY_L3_MASTER_OUT_LR_DQ
 H1:SUS-ETMY_L3_MASTER_OUT_LL_DQ
 H1:SUS-ETMY_L2_NOISEMON_UR_DQ
 H1:SUS-ETMY_L2_NOISEMON_UL_DQ
 H1:PEM-CS_MAG_EBAY_SUSRACK_Z_DQ
 H1:PEM-CS_MAG_EBAY_SUSRACK_Y_DQ
 H1:PEM-CS_MAG_EBAY_SUSRACK_X_DQ

The channels that spike just above 41.0 are:

 H1:SUS-ITMY_L2_NOISEMON_UR_DQ
 H1:SUS-ITMY_L2_NOISEMON_UL_DQ
 H1:SUS-ITMY_L2_NOISEMON_LR_DQ
 H1:SUS-ITMY_L2_NOISEMON_LL_DQ
 H1:SUS-ITMX_L2_NOISEMON_UR_DQ
 H1:SUS-ITMX_L2_NOISEMON_UL_DQ
 H1:SUS-ITMX_L2_NOISEMON_LR_DQ
 H1:SUS-ITMX_L2_NOISEMON_LL_DQ
 H1:SUS-ETMY_L3_MASTER_OUT_UR_DQ
 H1:SUS-ETMY_L3_MASTER_OUT_UL_DQ
 H1:SUS-ETMY_L3_MASTER_OUT_LR_DQ
 H1:SUS-ETMY_L3_MASTER_OUT_LL_DQ
 H1:SUS-ETMY_L2_NOISEMON_UR_DQ
 H1:SUS-ETMY_L2_NOISEMON_UL_DQ
 H1:SUS-ETMY_L2_NOISEMON_LR_DQ
 H1:SUS-ETMY_L2_NOISEMON_LL_DQ
 H1:SUS-ETMY_L1_NOISEMON_UR_DQ
 H1:SUS-ETMY_L1_NOISEMON_UL_DQ
 H1:SUS-ETMY_L1_NOISEMON_LR_DQ
 H1:SUS-ETMY_L1_MASTER_OUT_UR_DQ
 H1:SUS-ETMY_L1_MASTER_OUT_UL_DQ
 H1:SUS-ETMY_L1_MASTER_OUT_LR_DQ
 H1:SUS-ETMY_L1_MASTER_OUT_LL_DQ
 H1:SUS-ETMX_L2_NOISEMON_UR_DQ
 H1:SUS-ETMX_L2_NOISEMON_LL_DQ
 H1:PEM-EY_MAG_EBAY_SUSRACK_Z_DQ
 H1:PEM-EY_MAG_EBAY_SUSRACK_Y_DQ
 H1:PEM-EY_MAG_EBAY_SUSRACK_X_DQ
 H1:PEM-CS_MAG_LVEA_OUTPUTOPTICS
 H1:PEM-CS_MAG_LVEA_OUTPUTOPTICS_QUAD_SUM_DQ

The magnetometers do show coherence at the two spikes seen in Keith's plot. The SUS channels are also showing coherence at these frequencies, sometimes broad in structure, sometimes narrow. See the coherence plots below.

Nelson, Michael Coughlin, Eric Coughlin, Pat Meyers

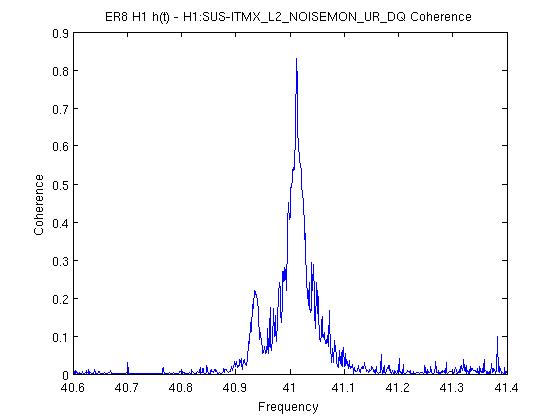
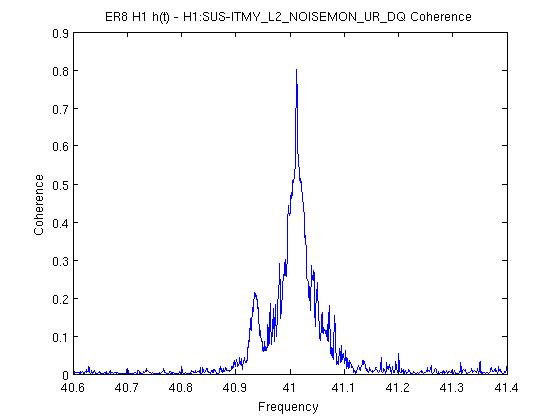
Nelson, et. al

Interesting list of channels. Though they seem scattered, I can imagine a scenario where the SRM's highest roll mode frequency is still the culprit.

All of the following channels you list are the drive signals for DARM. We're currently feeding back the DARM signal to only ETMY. So, any signal your see in the calibrated performance of the instrument, you will see here -- they are part of the DARM loop.
 H1:SUS-ETMY_L3_MASTER_OUT_UR_DQ
 H1:SUS-ETMY_L3_MASTER_OUT_UL_DQ
 H1:SUS-ETMY_L3_MASTER_OUT_LR_DQ
 H1:SUS-ETMY_L3_MASTER_OUT_LL_DQ
 H1:SUS-ETMY_L2_NOISEMON_UR_DQ
 H1:SUS-ETMY_L2_NOISEMON_UL_DQ
 H1:SUS-ETMY_L2_NOISEMON_LR_DQ
 H1:SUS-ETMY_L2_NOISEMON_LL_DQ
 H1:SUS-ETMY_L1_NOISEMON_UR_DQ
 H1:SUS-ETMY_L1_NOISEMON_UL_DQ
 H1:SUS-ETMY_L1_NOISEMON_LR_DQ
 H1:SUS-ETMY_L1_MASTER_OUT_UR_DQ
 H1:SUS-ETMY_L1_MASTER_OUT_UL_DQ
 H1:SUS-ETMY_L1_MASTER_OUT_LR_DQ
 H1:SUS-ETMY_L1_MASTER_OUT_LL_DQ

Further -- though we'd have to test this theory by measuring the coherence between, say the NoiseMon channels and these SUS rack magnetometers, I suspect these magnetometers are just sensing the requested DARM drive control signal
 H1:PEM-EY_MAG_EBAY_SUSRACK_Z_DQ
 H1:PEM-EY_MAG_EBAY_SUSRACK_Y_DQ
 H1:PEM-EY_MAG_EBAY_SUSRACK_X_DQ

Now comes the harder part. Why the are ITMs and corner station magnetometers firing off? The answer: SRCL feed-forward / subtraction from DARM and perhaps even angular control signals. Recall that the QUAD's electronics chains are identical, in construction and probably in emission of magnetic radiation.
 H1:PEM-CS_MAG_EBAY_SUSRACK_Z_DQ
 H1:PEM-CS_MAG_EBAY_SUSRACK_Y_DQ
 H1:PEM-CS_MAG_EBAY_SUSRACK_X_DQ
sound like they're in the same location for the ITMs as the EY magnetometer for the ETMs. We push SRCL feed-forward to the ITMs, and SRM is involved in SRCL, and also there is residual SRCL to DARM coupling left-over from the imperfect subtraction. That undoubtedly means that the ~41 [Hz] mode of the SRM will show up in DARM, SRCL, the ETMs and the ITMs. Also, since the error signal / IFO light for the arm cavity (DARM, CARM -- SOFT and HARD) angular control DOFs have to pass through HSTSs as they come out of the IFO (namely SRM and SR2 -- the same SUS involved in SRCL motion), they're also potentially exposed to this HSTS resonance. We feed arm cavity ASC control signal to all four test masses.

That would also explain why the coil driver monitor signals show up on your list:
 H1:SUS-ITMY_L2_NOISEMON_UR_DQ
 H1:SUS-ITMY_L2_NOISEMON_UL_DQ
 H1:SUS-ITMY_L2_NOISEMON_LR_DQ
 H1:SUS-ITMY_L2_NOISEMON_LL_DQ
 H1:SUS-ITMX_L2_NOISEMON_UR_DQ
 H1:SUS-ITMX_L2_NOISEMON_UL_DQ
 H1:SUS-ITMX_L2_NOISEMON_LR_DQ
 H1:SUS-ITMX_L2_NOISEMON_LL_DQ

The 41 Hz showing up in
 H1:SUS-ETMX_L2_NOISEMON_UR_DQ
 H1:SUS-ETMX_L2_NOISEMON_LL_DQ
(and not in the L3 or L1 stage) also is supported by the ASC control signal theory -- we only feed ASC to the L2 stage, and there is no LSC (i.e. DARM) request to ETMX (which we *would* spread among the three L3, L2, and L1 stages.). Also note that there's a whole integration issue about how these noise monitor signals are untrustworthy (see Integration Issue #9), and the ETMX noise mons have not been cleared as "OK," and in fact have been called out explicitly for their suspicious behavior in LHO aLOG 17890

I'm not sure where this magnetometer lives:
 H1:PEM-CS_MAG_LVEA_OUTPUTOPTICS
 H1:PEM-CS_MAG_LVEA_OUTPUTOPTICS_QUAD_SUM_DQ
but it's clear from the channel names that these is just two different versions of the same magnetometer.

I'm surprised that other calibrated LSC channels like
H1:CAL-CS_PRCL_DQ
H1:CAL-CS_PRCL_DQ
H1:CAL-CS_PRCL_DQ
don't show up on your list. I'm staring at the running ASD of these channels on the wall and there's a line at 41 [Hz] that in both the reference trace and the current live trace (though, because PRCL, SRCL, and MICH all light that bounces off of HSTSs, I suspect that you might find slightly different frequencies in each).

"I see your blind list of channels that couple, and raise you a plausible coupling mechanism that explains them all. How good is your hand?!"
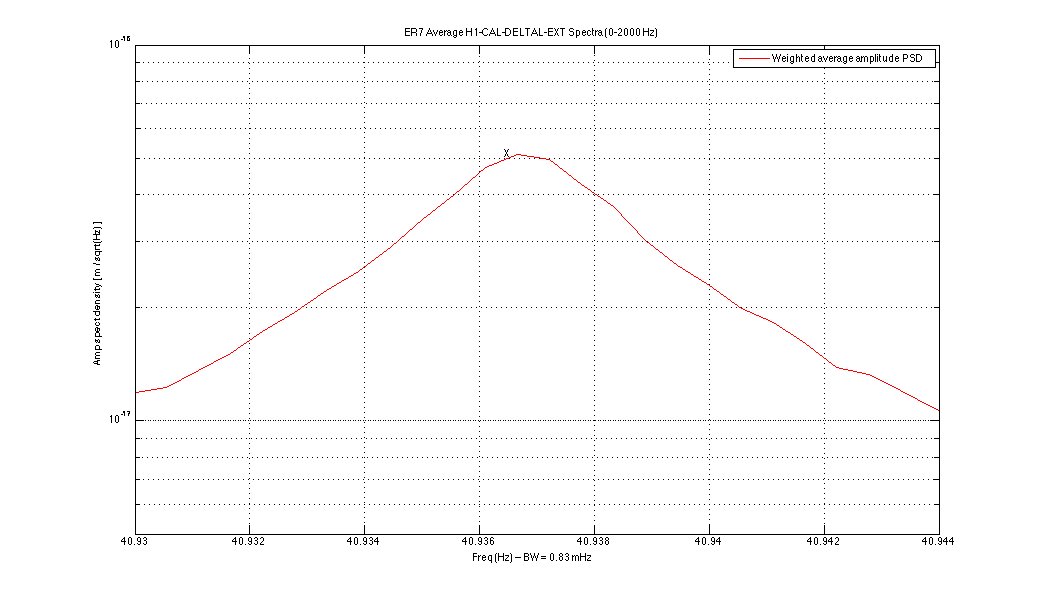
I neglected to state explicitly that the spectra I posted are taken
from non-overlapped Hann-windowed 30-minute SFTs,
hence with bins 0.5556 mHz wide and BW of about 0.83 mHz.
Attached are close-in zooms of  the bands around 41 Hz peaks,
from the ER8 50-hour data integration, allowing an estimate of
their Q's (request from Peter F).

For the peak at about 40.9365 Hz, one has:
FWHM ~ 0.0057 Hz
-> Q = 40.94/.0057 = 7,200

For the peak at about 41.0127 Hz, one has:
FWHM ~ 0.0035 Hz
-> Q = 41.01/0.0035 = 12,000

Also attached are zooms and close-in zooms for the peak at 41.9365 Hz
from 145 hours of ER7 data when the noise floor and the peak were
both higher. The 41.0127-Hz peak is not visible in this data set integration.

In the ER7 data set, one has for 41.9365 Hz:
FWHM ~  0.0049 Hz
-> Q = 40.94/0.0049 = 8,400

Peter expected Q's as high as 4000-5000 and no lower than 2000 for
a triplet suspension. These numbers are high enough to qualify.
Andy Lundgren pointed out that there is a line at about 28.2 Hz that
might be close enough to 40.9365/sqrt(2) = 28.95 Hz to qualify as
the bounce-mode counterpart to the suspected roll mode.

So I've checked its Q in the 50-hour ER8 set and the 145-hour ER7 set
and am starting to think Andy's suspicion is correct (see attached spectra).
I get Q's of about 9400 for ER and 8600 for ER7, where the line in
ER7 is much higher than in ER8, mimicking what is seen at 41 Hz.
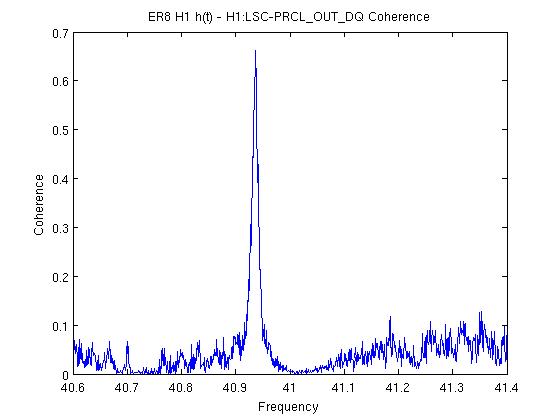
In an email Gabriele Vajente has stated, "...the noise might be correlated to PRCL." There is a coherence spike between h(t) and H1:LSC-PRCL_OUT_DQ at 40.936 Hz. Here is the coherence for a week in ER8.
Peter F asked if Q of ~ 10,000 for bounce and roll modes was plausible.

Answer is yes. We have evidence that the material loss can at least a factor of 2 better than 2e-4 - e.g. see our paper (due to be published soon in Rev Sci Instrum,) P1400229, where we got an average 1.1 x 10^-4 loss for music wire. Q = 1/loss.
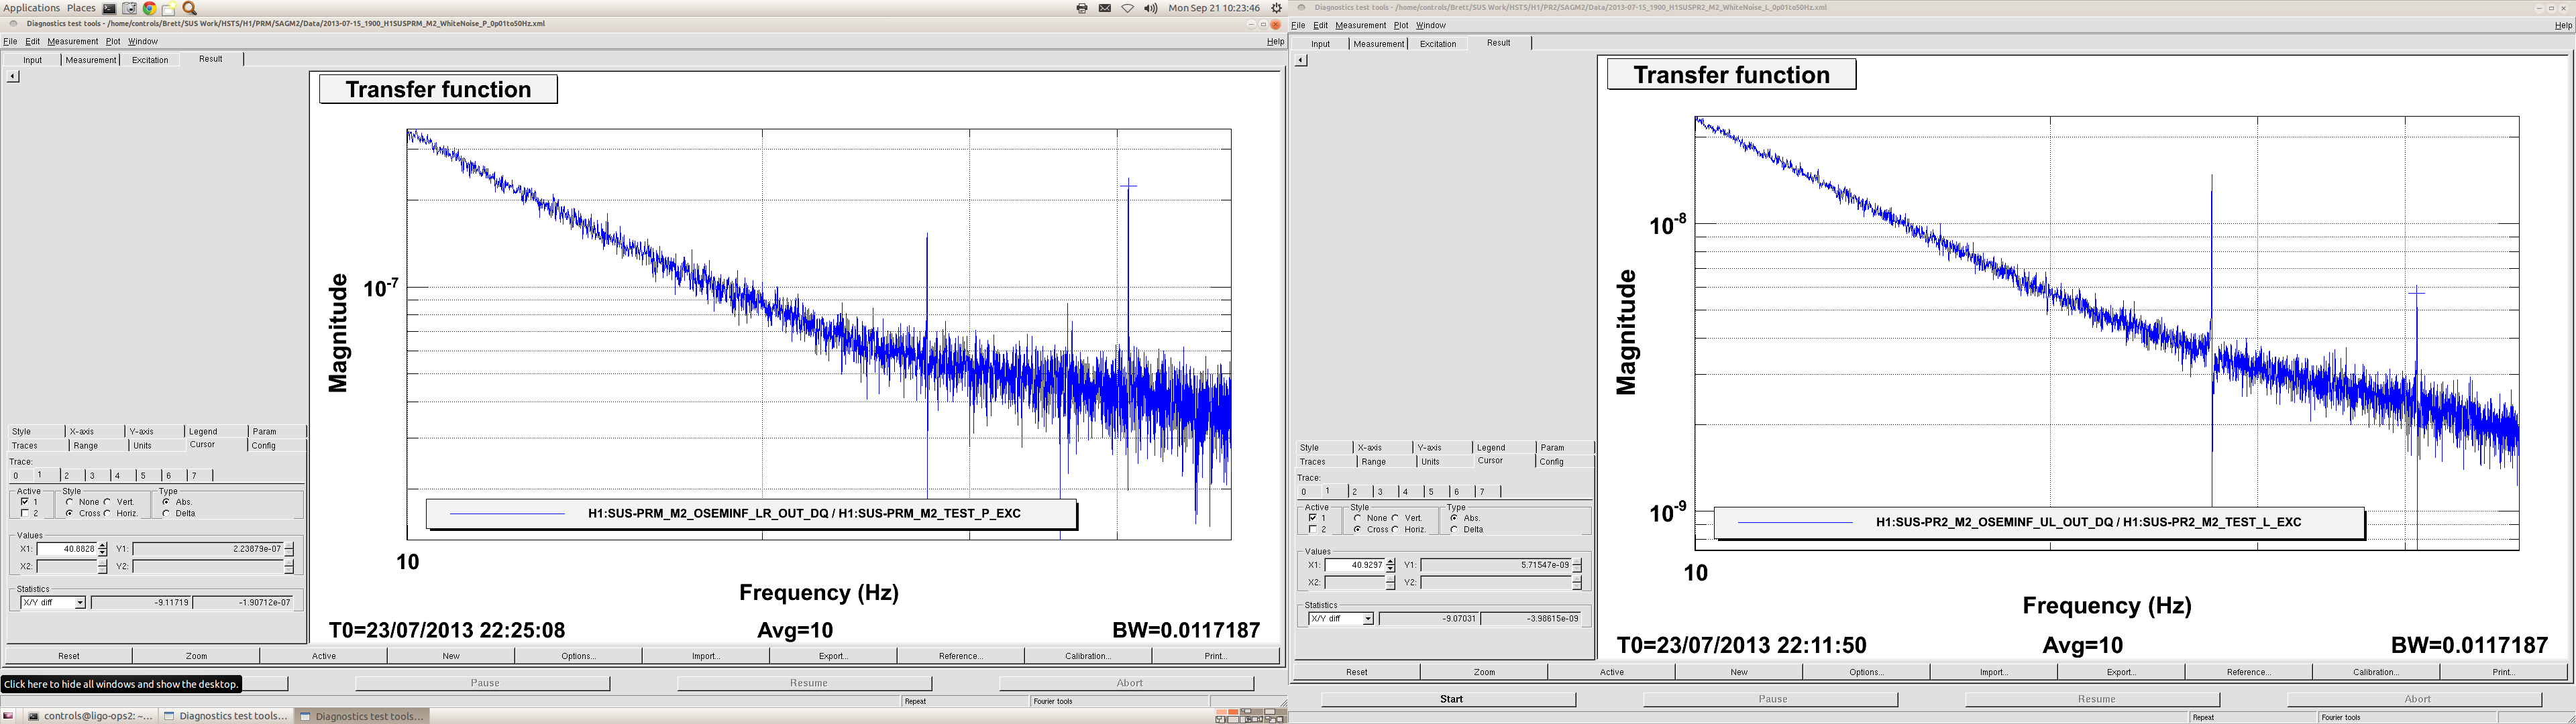
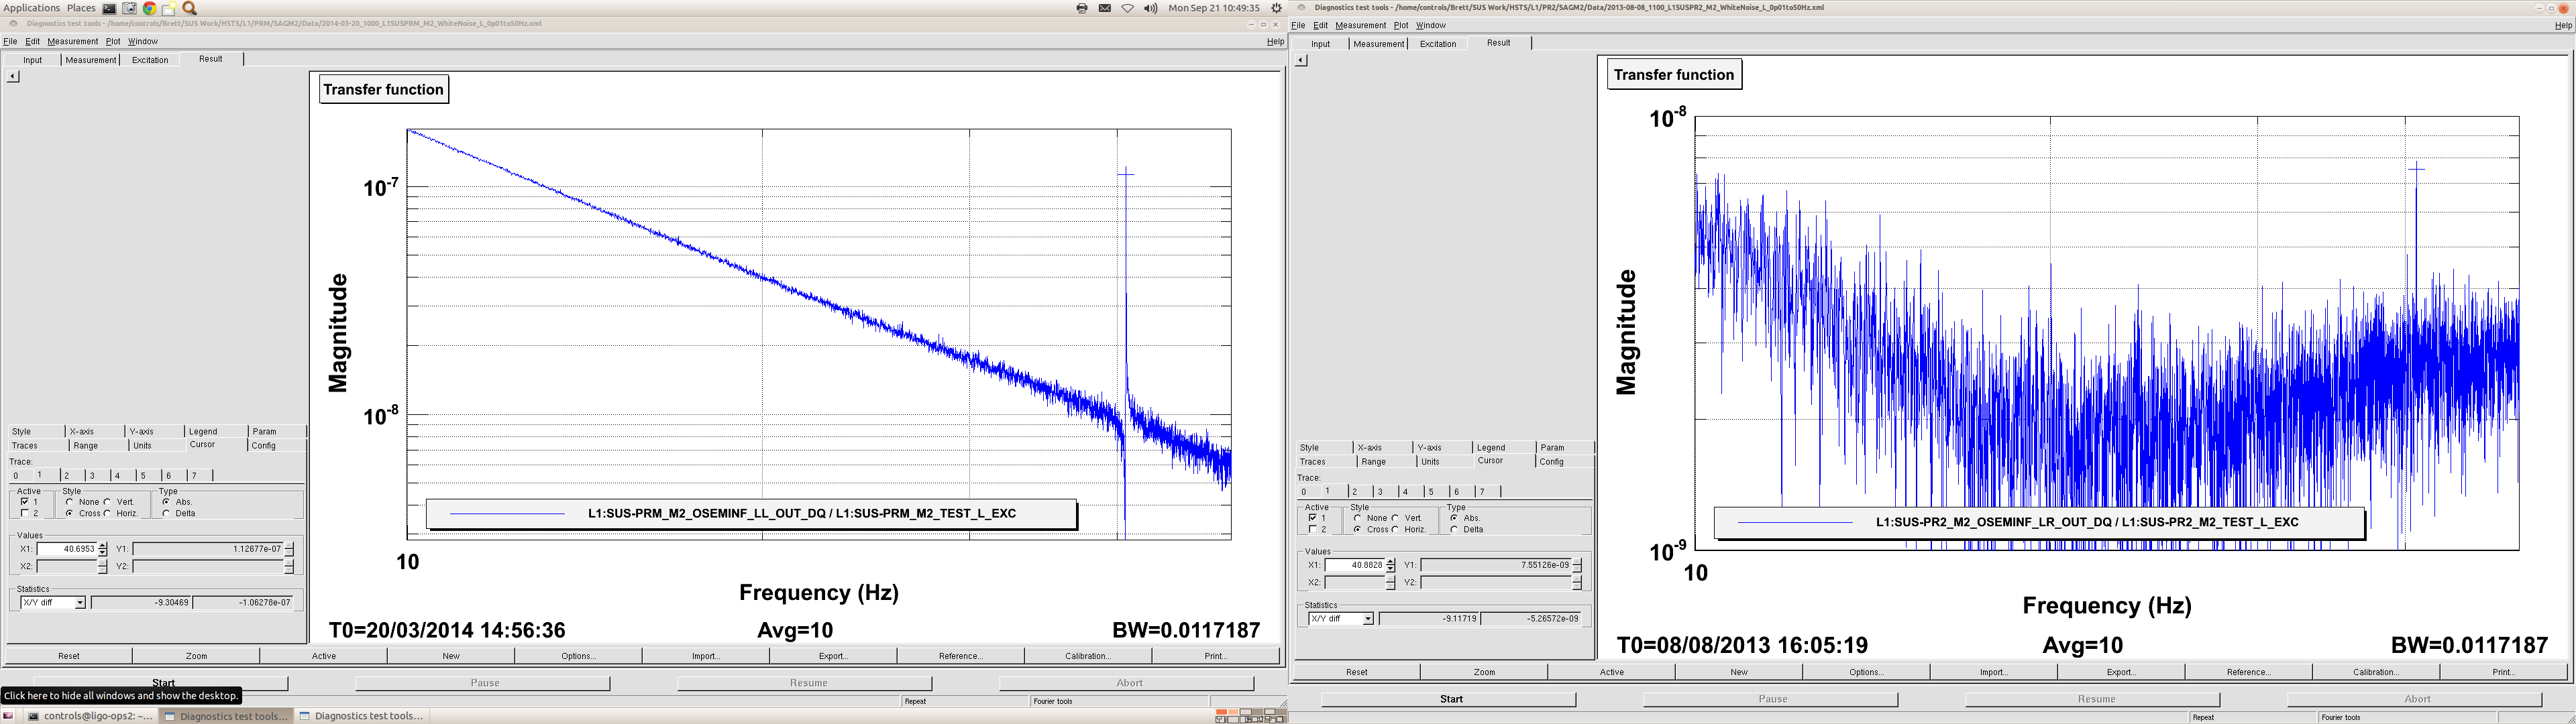
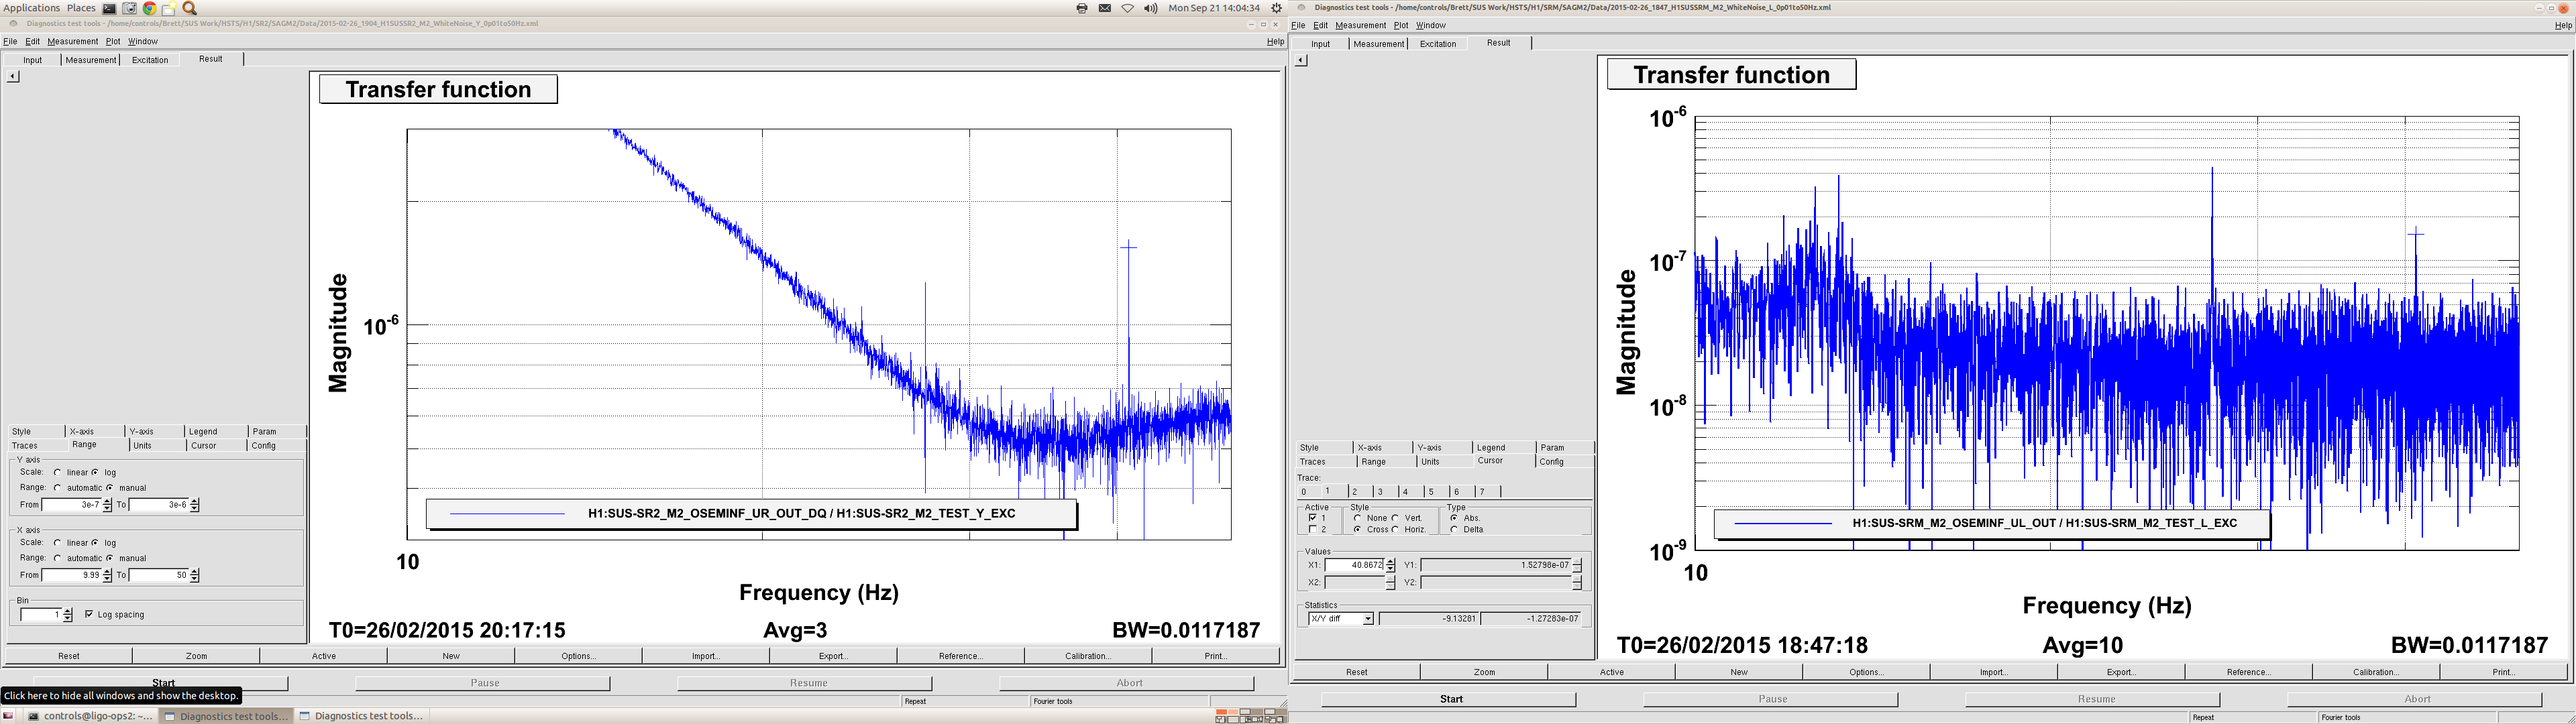
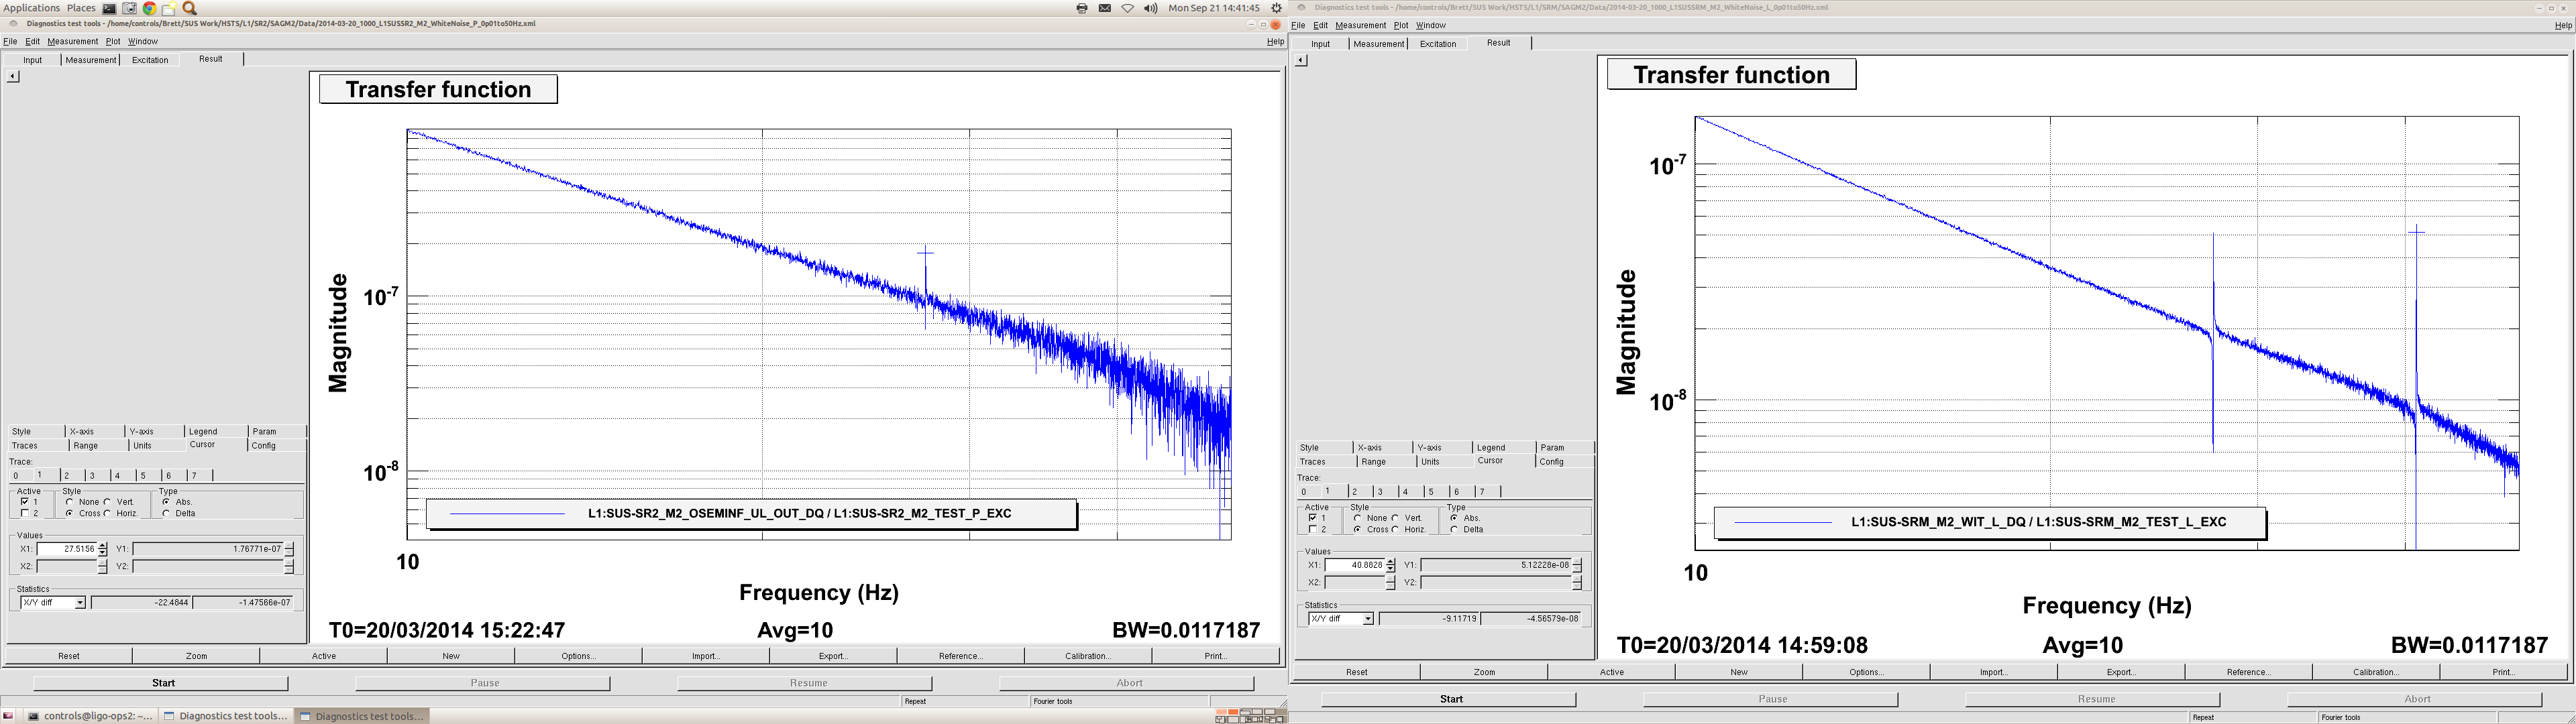
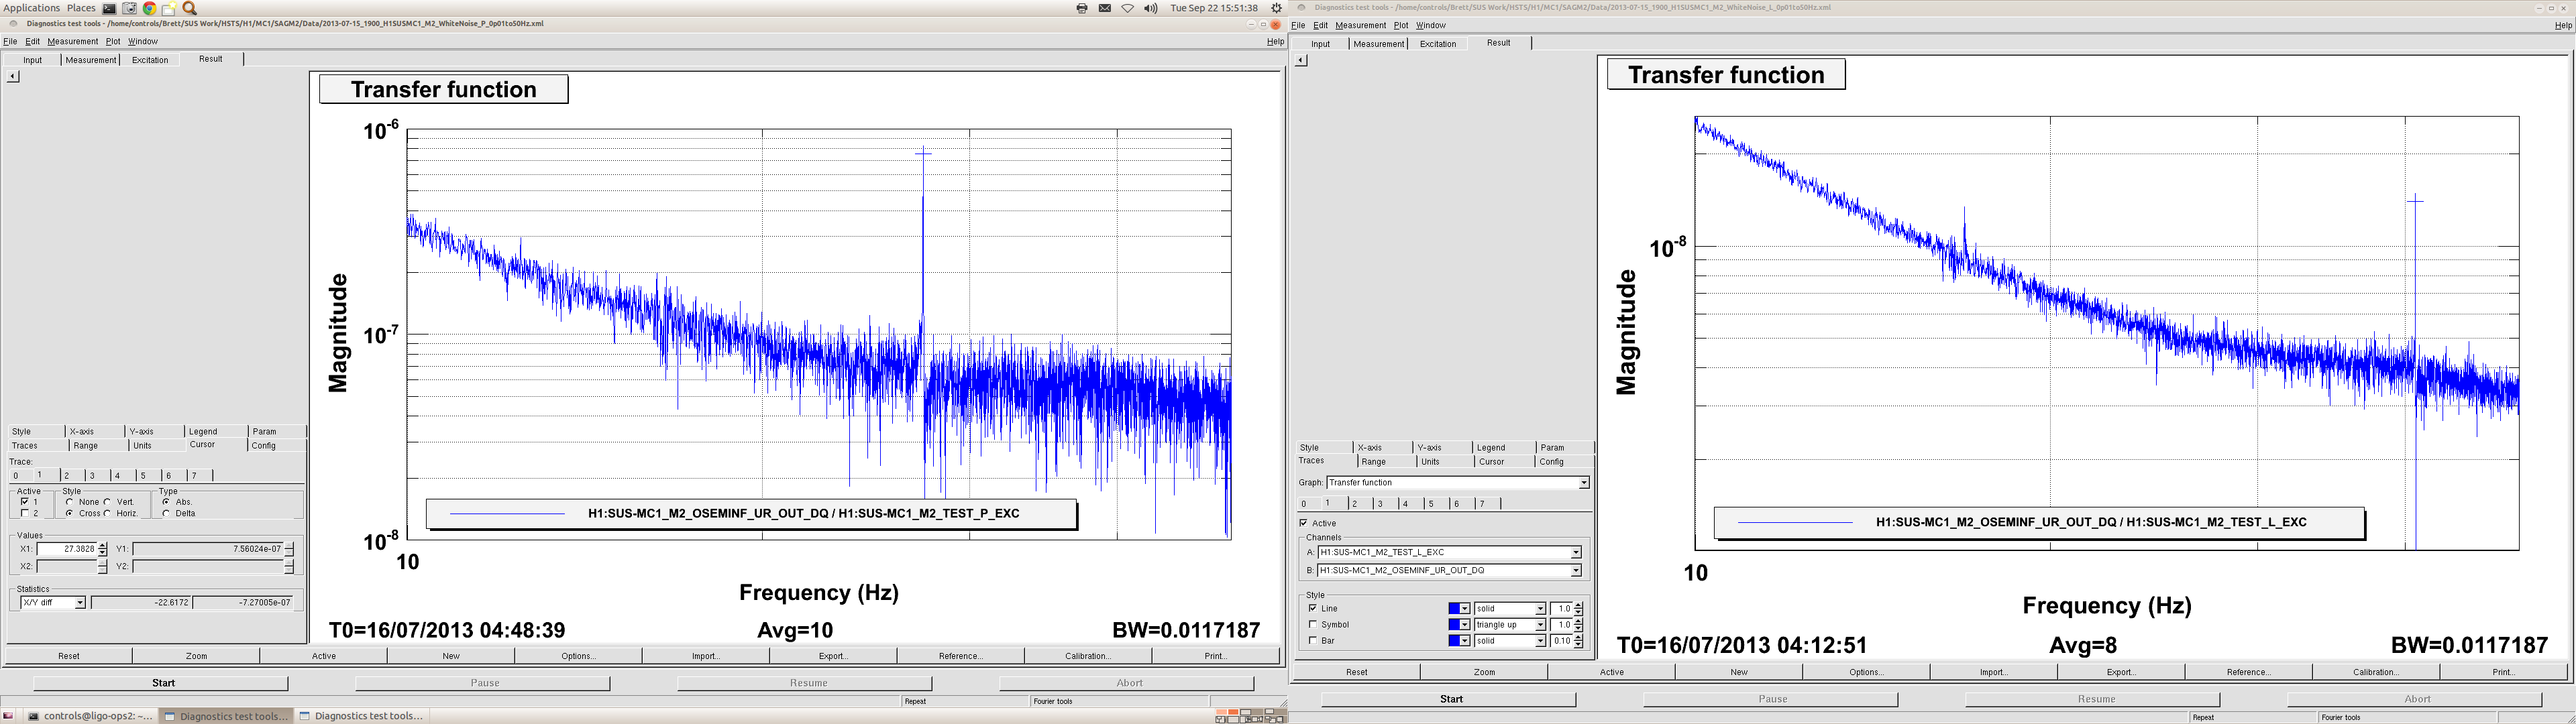
[Stuart A, Jeff K, Norna R]

After having looked through acceptance measurements, taken in-chamber (Phase 3), for all H1 HSTSs, it should be noted that our focus was on the lower frequency modes of the suspensions, so we have little data to refine the estimates of the individual mode frequencies for each suspension.

No vertical (modeV3 at ~27.3201 Hz) or roll (modeR3 at ~40.369 Hz) modes are present in the M1-M1 (top-to-top) stage TFs of the suspensions.

Some hints of modes can be observed in M2-M2 and M3-3 TFs (see attached below), as follows:-

1) M2-M2, all DOFs suffer from poor coherence above 20 Hz. However, there are some high Q features that stand out in the L DOF for SRM, at frequencies of 27.46 Hz and 40.88 Hz. In Pitch, there is a high Q feature at 27.38 Hz for PR2. In Yaw, a feature at 40.81 Hz is just visible for MC1.

2) M3-M3, again all DOFs suffer very poor coherence above 20 Hz. However, a feature can be seen standing above the noise at 26.7 Hz for MC2 in the L DOF. Also, a small peak is present at 40.92 Hz for SR2 in the Yaw DOF.

We currently don't have any bandstops for these modes on the tripples, except for in the top stage length path to SRM and PRM. It would not impact our ASC loops to add bandstops to the P+Y input on all triples. We will do this next time we have a chance to put some changes in.
Ryan Derosa mentioned that he took some low resolution measurements that include an L1 SR2 roll mode at 41.0 Hz.
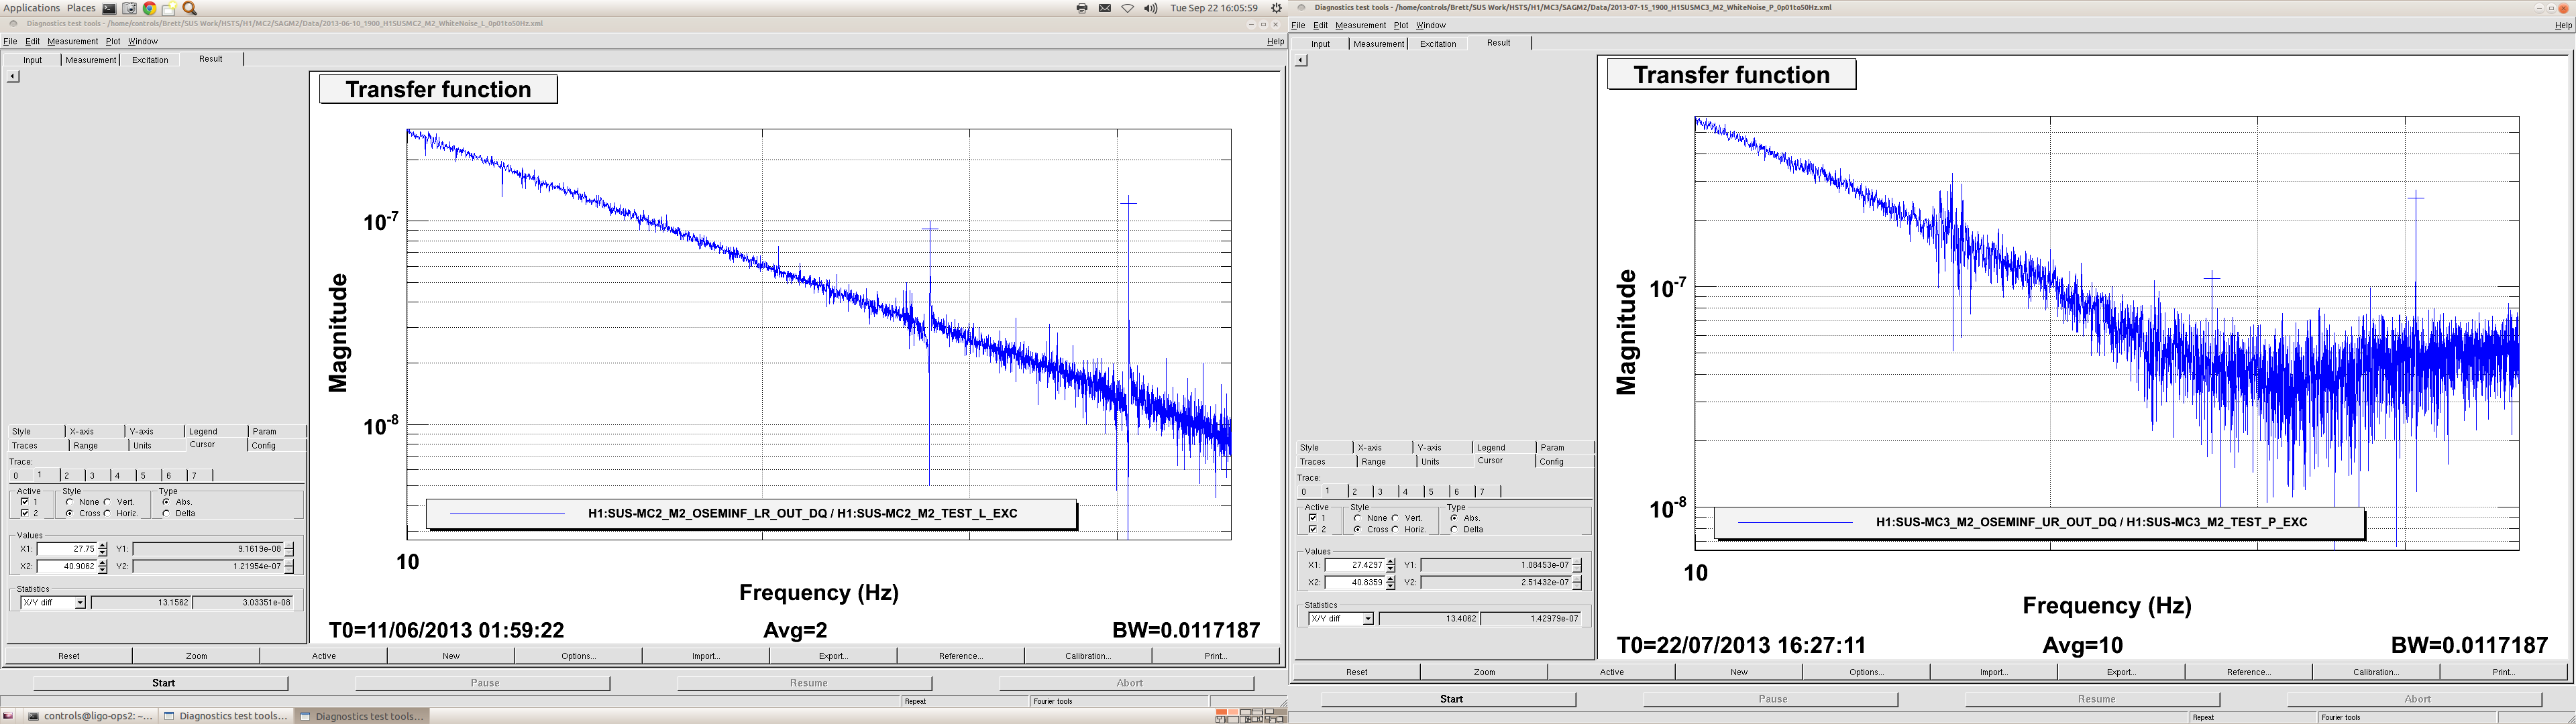
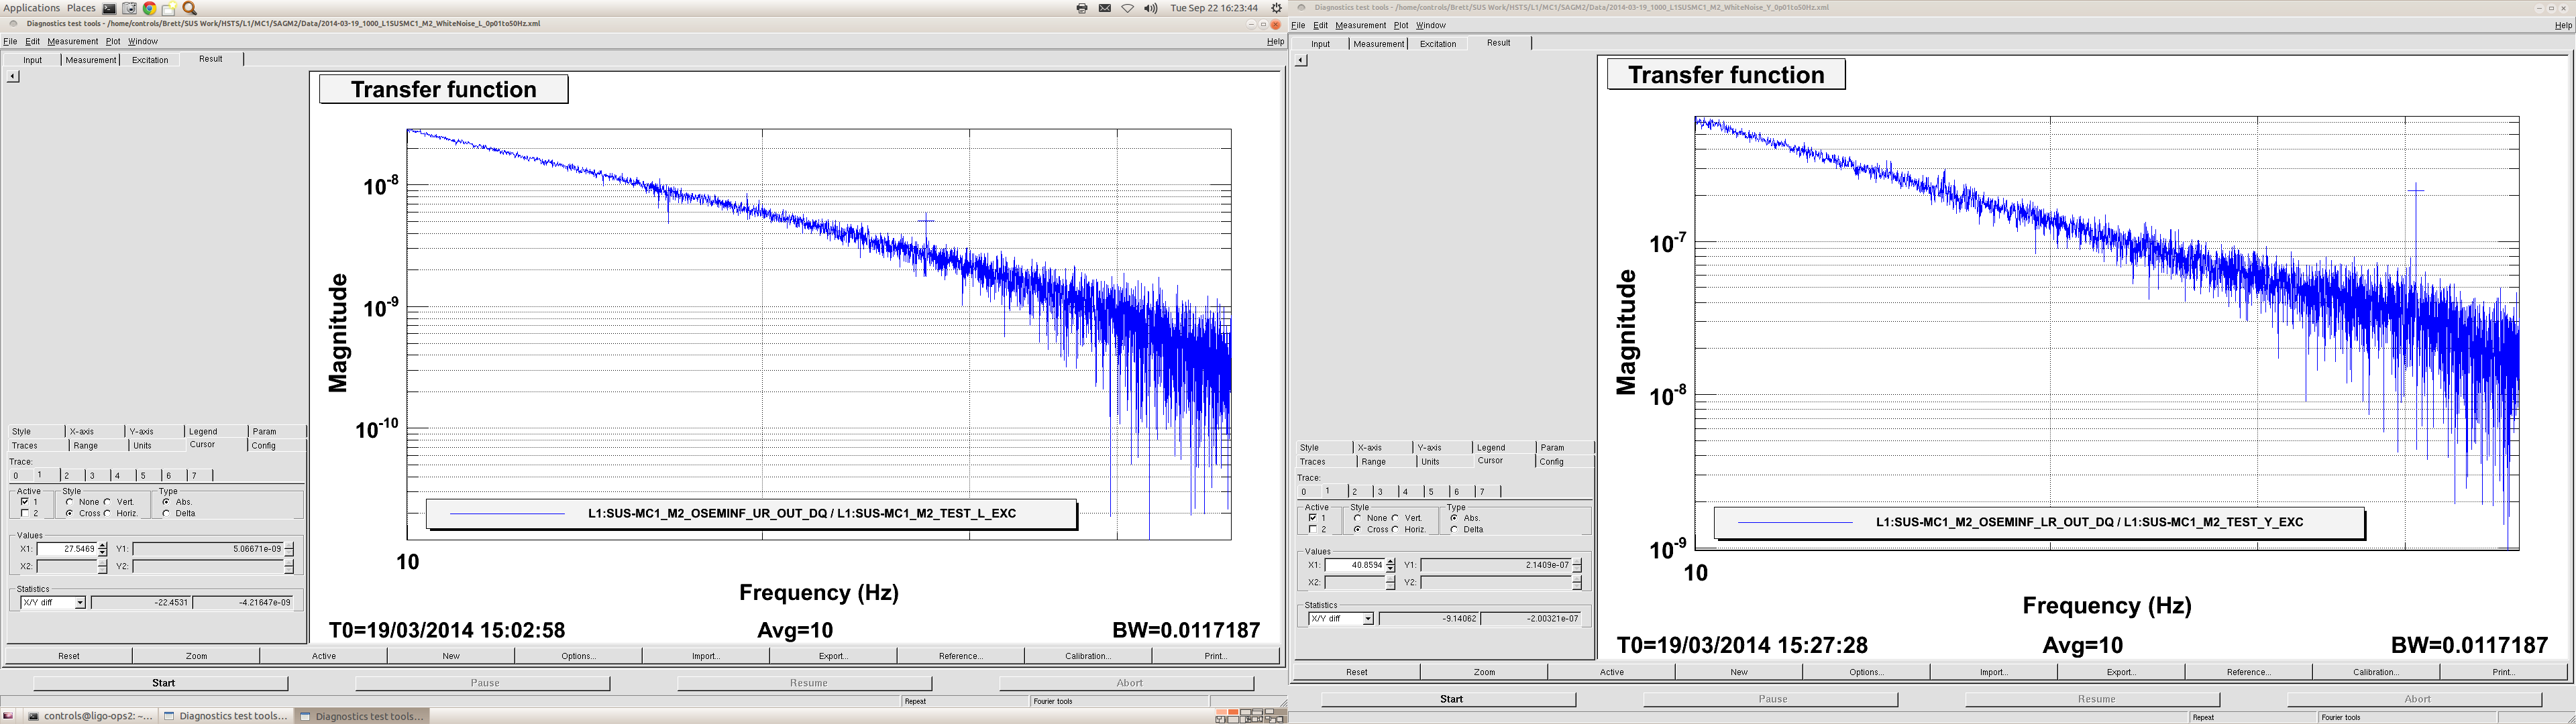
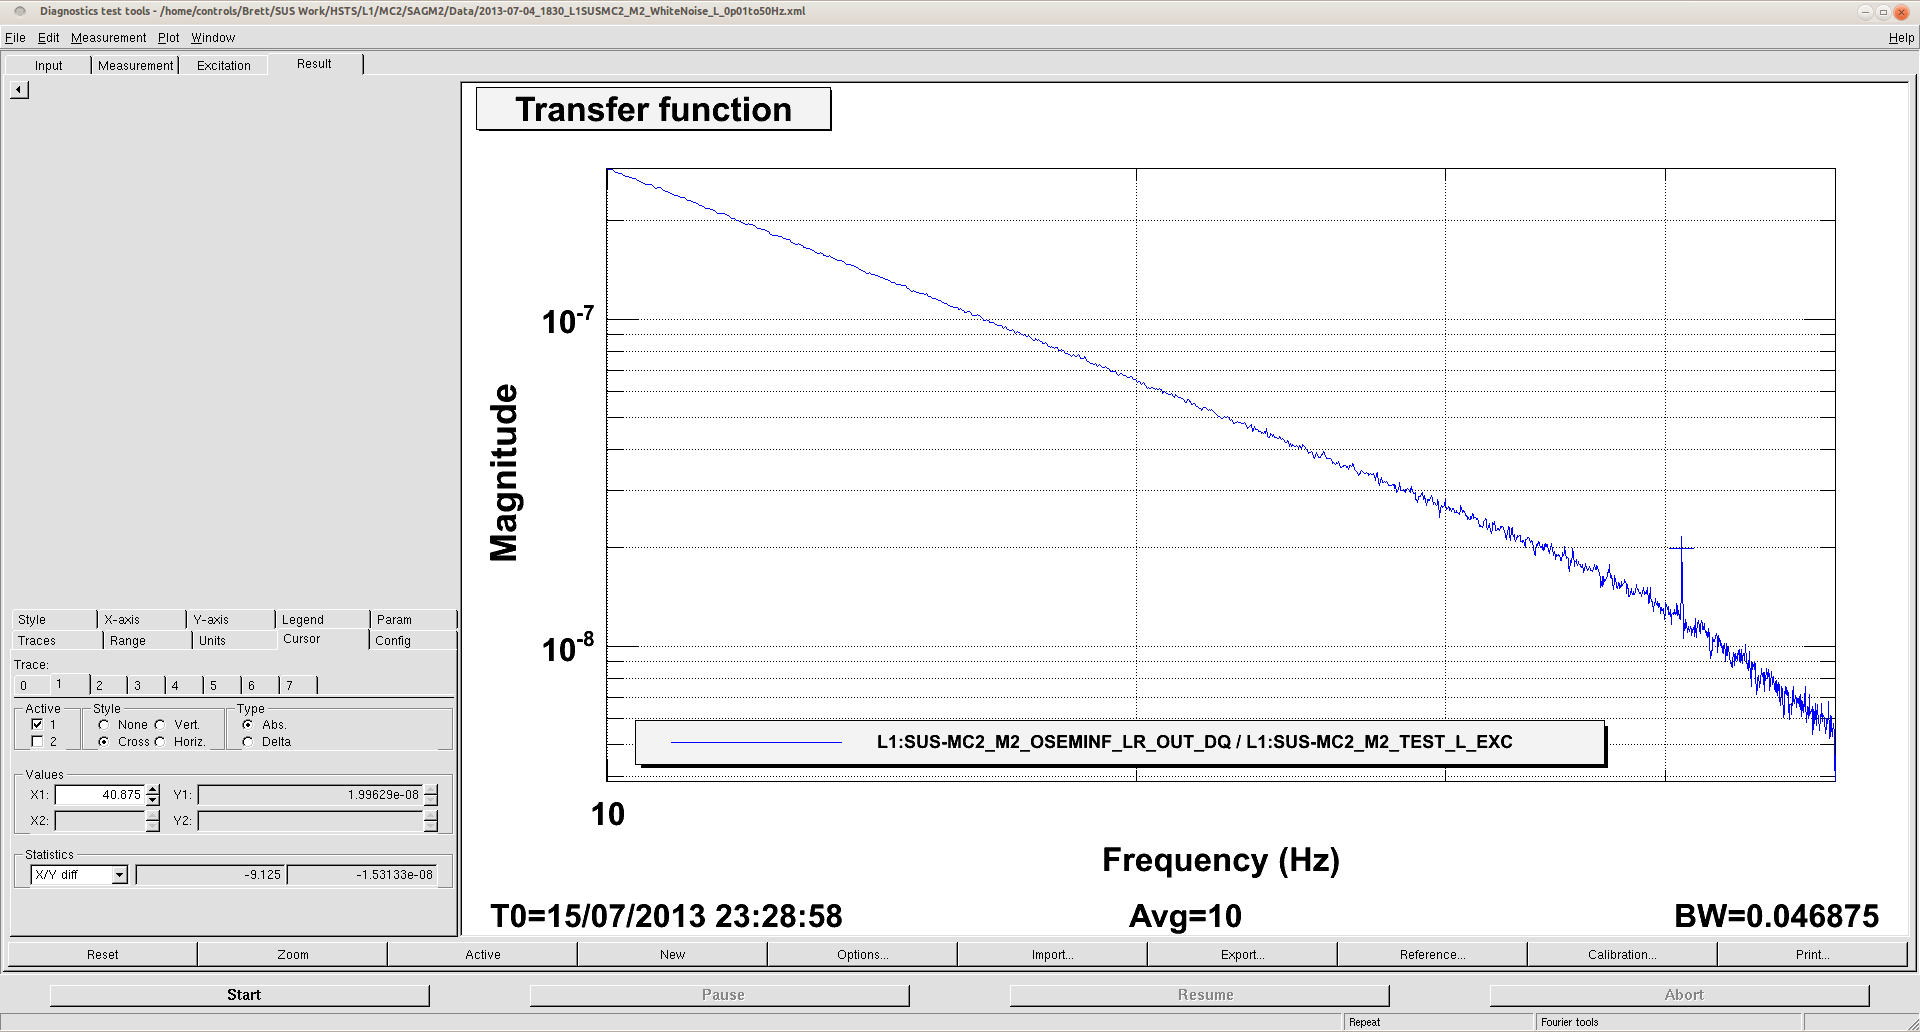
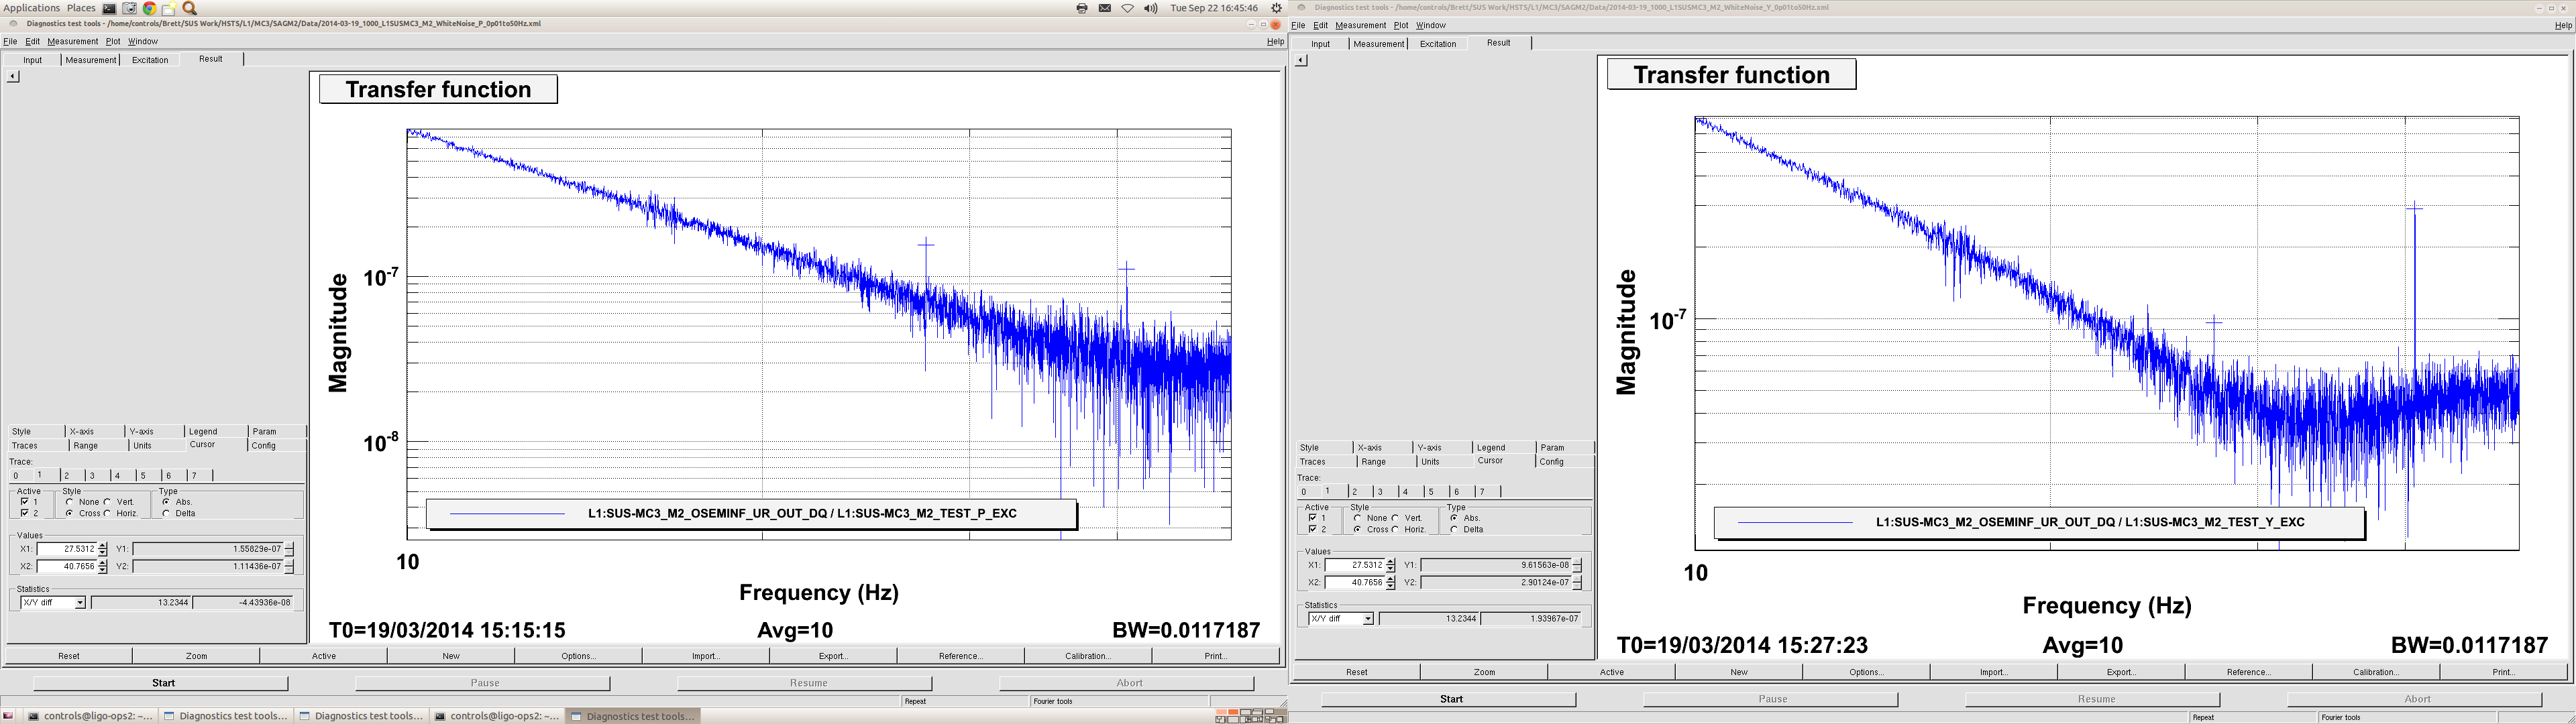
I have now looked at the data for all the MCs, to complement the PRs and SRs above in log 21741. Screenshots of the data are attached, a list of the modes found are below.
H1
SUS bounce (Hz) roll (Hz)
MC1 27.38 40.81
MC2 27.75 40.91
MC3 27.43? 40.84
L1
SUS bounce (Hz) roll (Hz)
MC1 27.55? 40.86
MC2 --- 40.875
MC3 27.53 40.77
Error bars of +- 0.01 Hz.
I am not sure about the bounce modes for H1 MC3 and L1 MC1 since the peaks are pretty small. I couldn't find any data on L1 MC2 showing a bounce mode.
Expanding the channel list to include all channels in the detchar O1 channel list:
https://wiki.ligo.org/DetChar/O1DetCharChannels
I ran a coherence study for a half our of data towards the end of ER8.
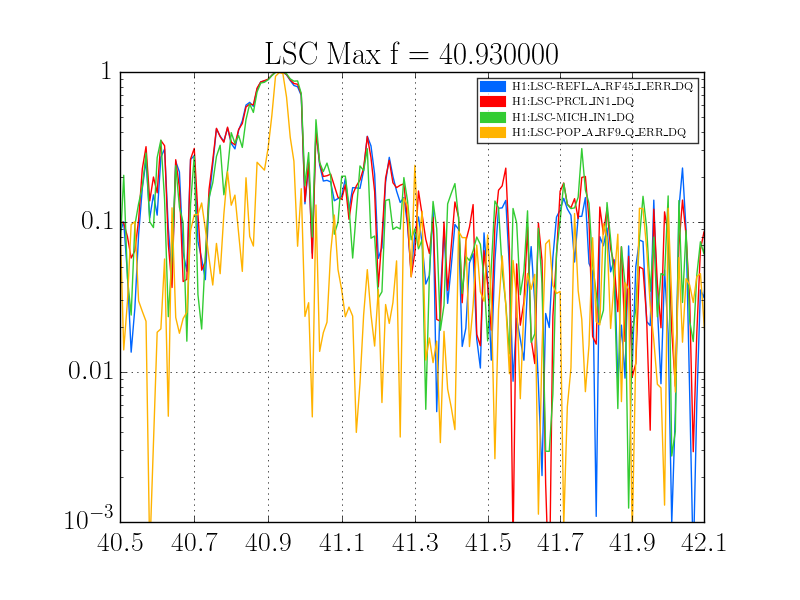
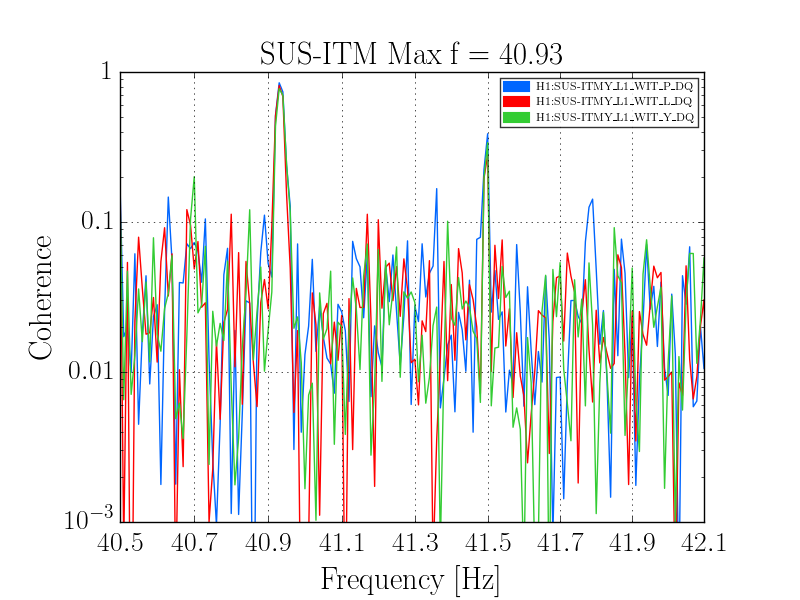
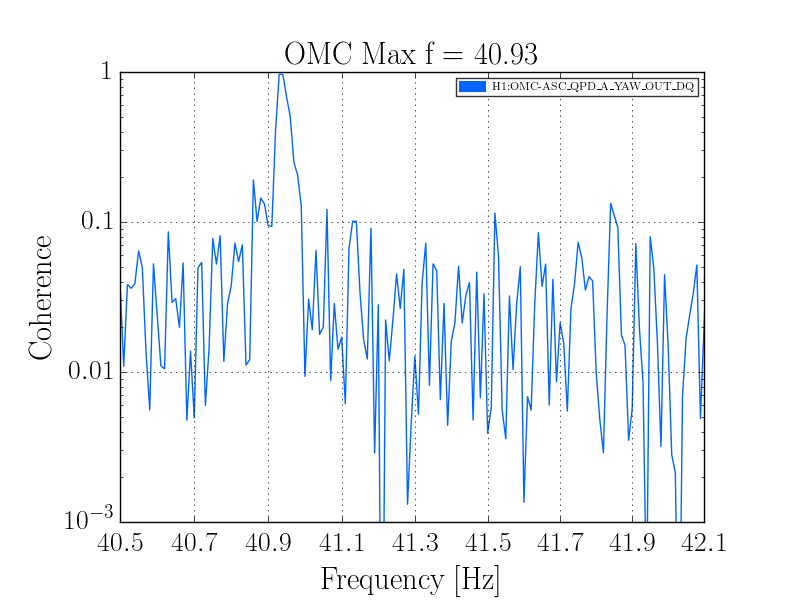
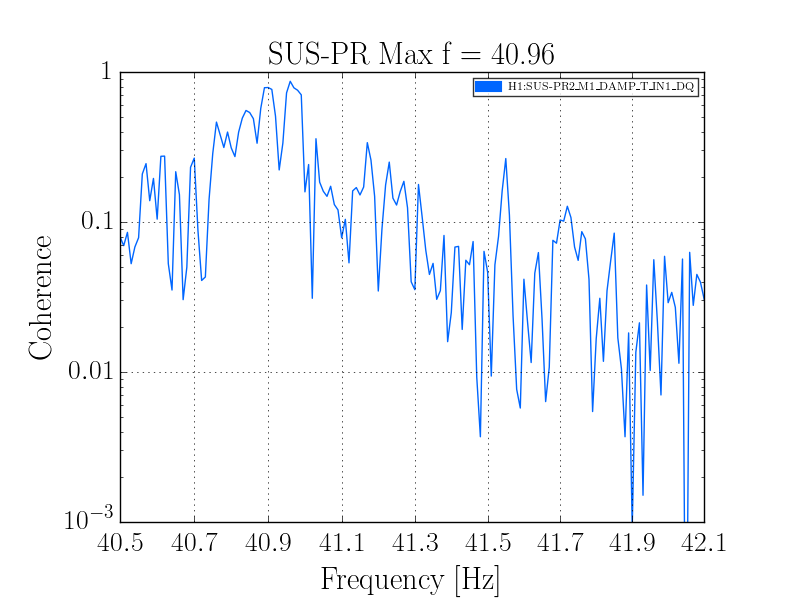
I see particularly high coherence at 40.93Hz in many channels in LSC, OMC, ITM suspensions, and also a suspension for PR2. It seems to me like this particularly strong line is probably due to PR2 based on these results, Keith's ASDs, and Brett's measurements, and it seems to be very highly coherent.
Full results with coherence matrices and data used to create them (color = coherence, x axis = frequency, y axis = channels) broken down roughly by subsystem can be found here:
https://ldas-jobs.ligo-wa.caltech.edu/~meyers/coherence_matrices/1126258560-1801/bounce_roll4.html
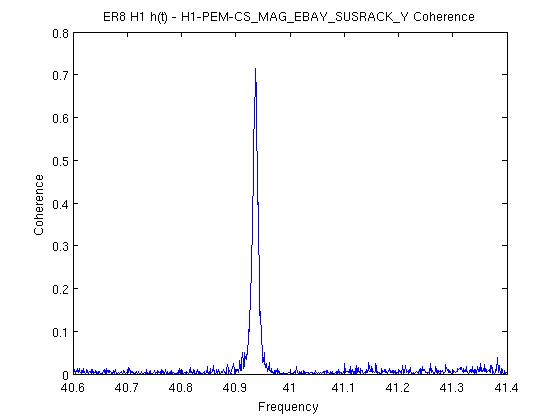
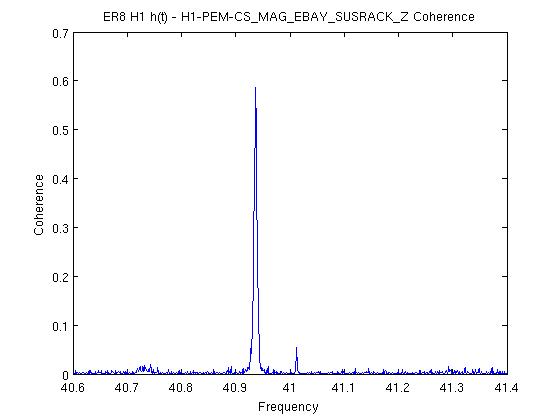
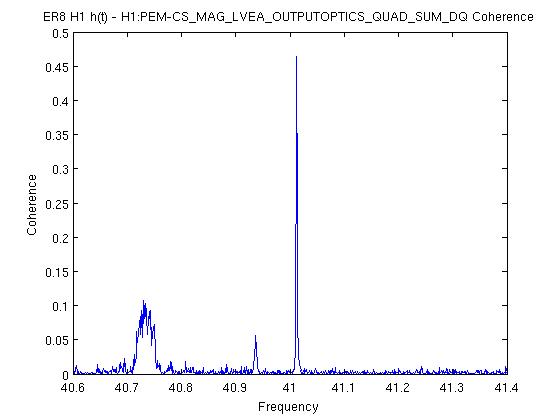
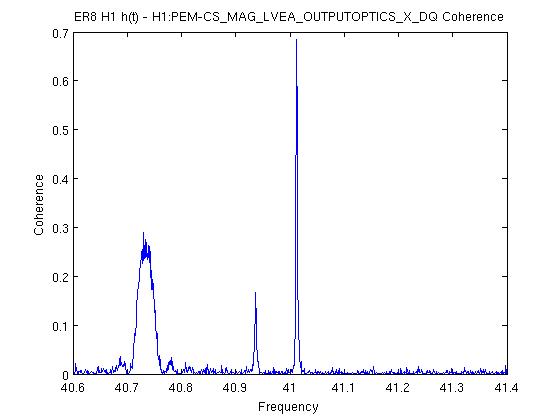
Attached are several individual coherence spectra that lit up the coherence matrices with the frequency of maximum coherence in that range picked out.
-Pat