Summary:
In an effort to create a inverse actuation filter for Hardware injection through Pcal infrastructure, we use the transfer function between RxPD and excitation of which RxPD is calibrated in terms of metres of displacement. . Using this RxPD calibration and the measured transfer fumction we calibrate the excitation [cts] in terms of metres and use it to create the inverse actuation filter. This will be installed in one of the excitation channel, possibly swept sine channel, for testing purpose.
Detail:
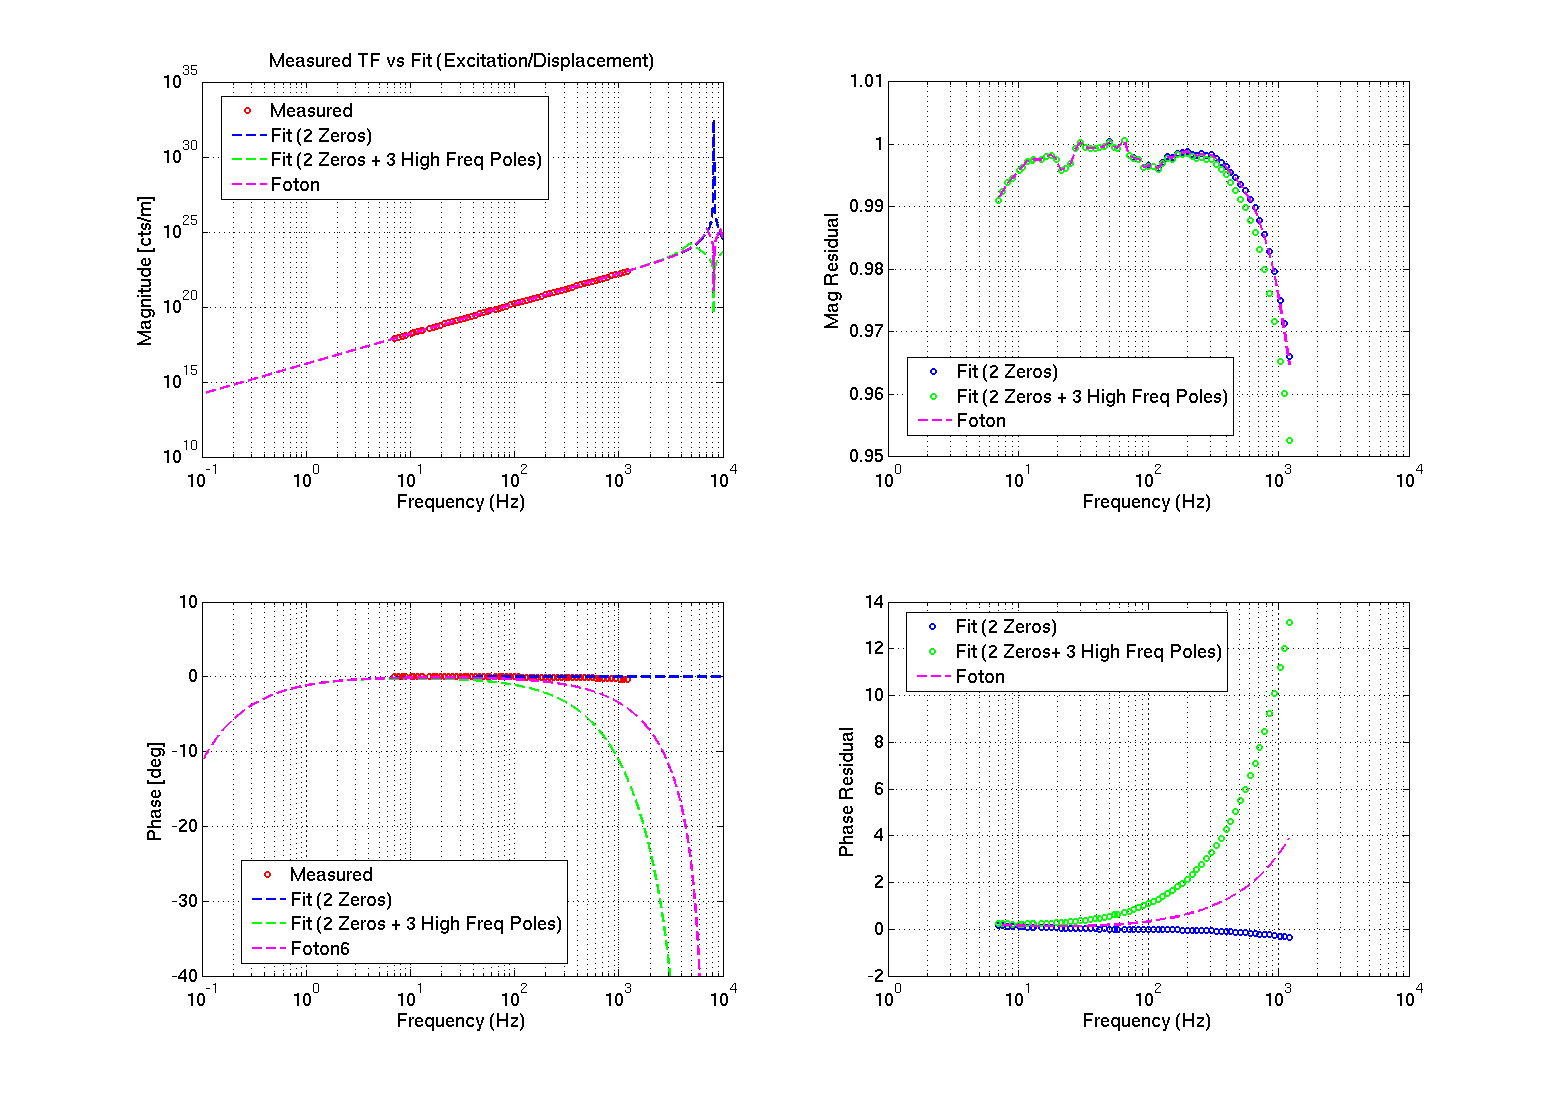
In the above plot, the two left plots are the actual magnitude and phase of the measurement and different fits. The red plot is the inverse of measured transfer function between calibrated RxPD and pcal excitation. In short, it is cts of excitation to metres of test mass displacement. The rest of the plots are fit to that measured TF. In this case, the residual plots on the right side are more informative. The blue plot is the residual between measured TF and the fit that includes two zeros. The residual looks pretty good for this case but we do not have the luxury of only using two zeros. We need equal or greater number of poles to roll off the signal at higher frequency. For this we use a complex pole pair at 7 Khz and an additional real pole at same frequency. This creates some magnitude and significant phase distortion at higher frequencies as seen in the green residual plot but this is a systematic and we can account for this in our analysis later.
The magenta plot is the foton implementation of our two zeros and three pole fit plotted in green. There is a difference between the actual matlab generated filter and the foton version of it at frequencies above KHz. This is a known effect and is described in detail in G1501013.
I have written a litlle more detail technical note and can be found at T1500496.
The script used to generate the plots above is committed to the SVN:
/ligo/svncommon/CalSVN/aligocalibration/trunk/Runs/O1/H1/Scripts/INVACT_PCAL/
The measuremnt files are in the following location
/ligo/svncommon/CalSVN/aligocalibration/trunk/Runs/O1/H1/Measurement/INVACT_PCAL/