To assess the health of the HEPI Actuator Parker Valves, which are very susceptable to blockage from fluid contaminants, LLO has regularly done the "Valve_Check" test. I have never successfully managed to make this work at LHO mainly because of missing files and lack of understanding of all the components to the test.
It also requires the HEPIs to be deisolated as 3hz sines waves are driven to the valves to assess the health of the valve. The results are posted on a plot and compared to previous values and trends and dramatic changes are spotted indicating a valve problem. Again, since we don't like taking the HEPI platforms down, and, I haven't been able to get the valve check to run here, an alternative which doesn't require de-isolating the platform is being searched for.
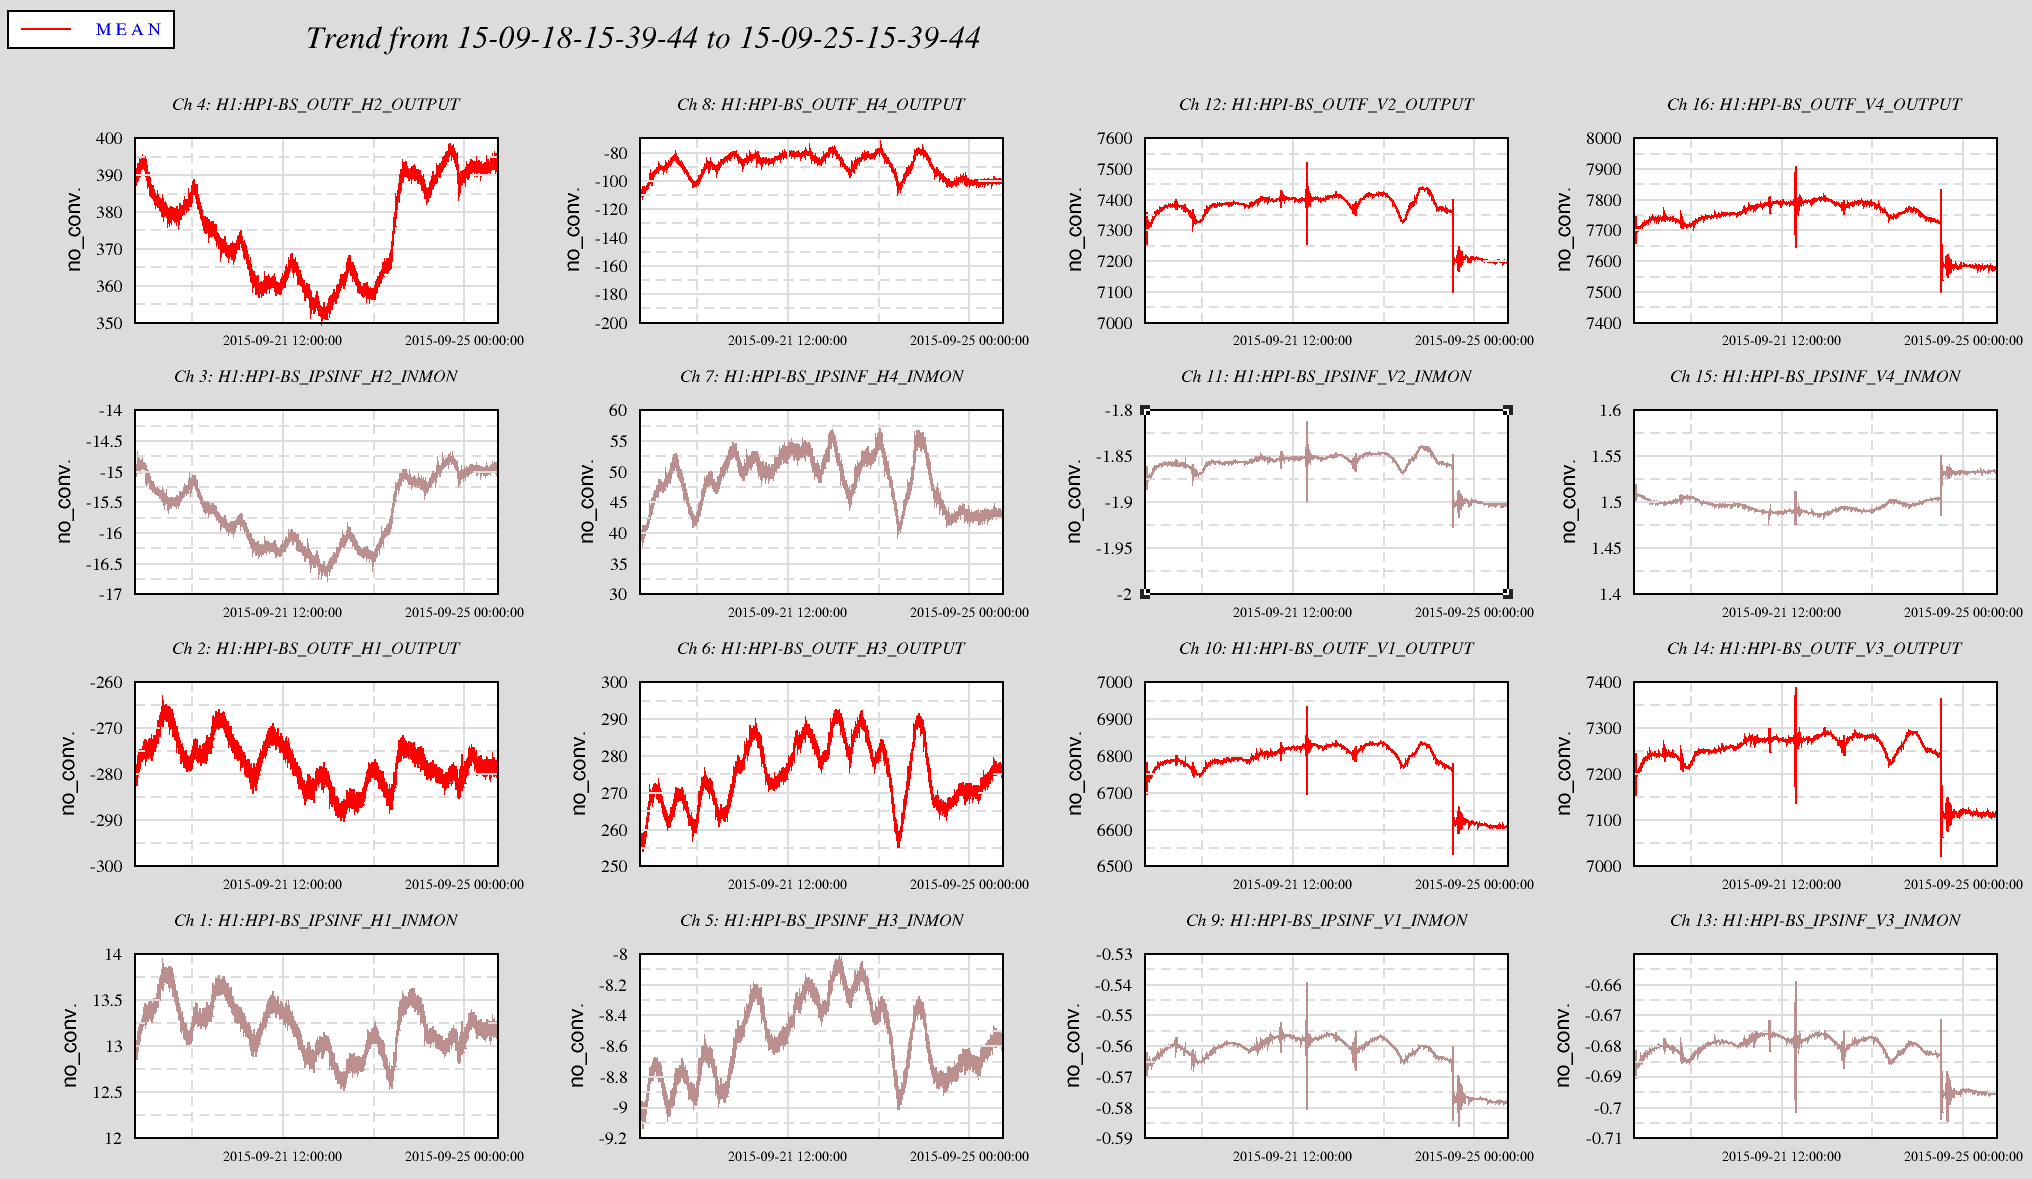
As we are looking for changes in the valve's effectiveness, it seems simple enough to look at the postion of the Actuator (IPS) in response to the Actuator Drive (OUTF.) So in dataviewer, I was just going to plot the local basis IPS INMON and the OUTF_OUTPUT. Upon further study, we might find it better to extract from other points of the chain such as IPS OUTPUT to get nm but for now I just grabbed the overview elements which is counts (0.001"/655cts) and the OUTF_OUTPUT...which should be nm in IPS space, not drive to make nm, I think... Anyway, at this point we are just looking for bad trends or steps that can not be explained.
I was going to start with 14 days of data (LLO runs the valve check weekly) but there was some zero elements that I can't figure out how to remove with DV so I'm getting divide by zero errors. So here is just a week's data for the BS.
In the attached plot I put the 8 each IPS reading and OUTF drive pairs adjacent (H1 in Chs 1 & 2, H2 in Chs 3 & 4, etc.) I then made the ratio of reading to drive and put it in the Ch1 graph hiding the original IPS reading. So the graphs with the brown traces are the ratios between the IPS not seen and the red trace drive in the graph just above.
So what stands out?
Regarding valve health...there are no monotonic trends but it is only a week so maybe not useful.
There is a shift in all vertical channels but they are all about the same magnitude in OUTPUT. I'd think a bad valve would stand out as a larger shift and the other are just making up a smaller portion of the total load. While the shift is clear on the Drive OUTF, on the IPS reading it is at the few counts level, related to IFO state maybe and otherwise insignificant?
The ratios are much closer to unity for the verticals but this is just a function of the larger vertical drives as we have a nearly 1/2 mm offset on the vertical hold position on the BS.
For the Horizontal channels, the ratios for all but H4 drift, swing, oscilate around 1 or 2 units whereas H4 swings around 5 to 15 units. Does this indicate something different about H4? Other than just the zero position of the IPS or conspiring cartesian positions yielding a smaller drive to H4?
Given that the zero IPS reading is not necessarily zero, any conclusion depending on that is biased and so must be salted.
Conclusion, no changes in valve performance in the past week. More work needed to look at longer time periods. MIT(tlemen) is looking at this too.