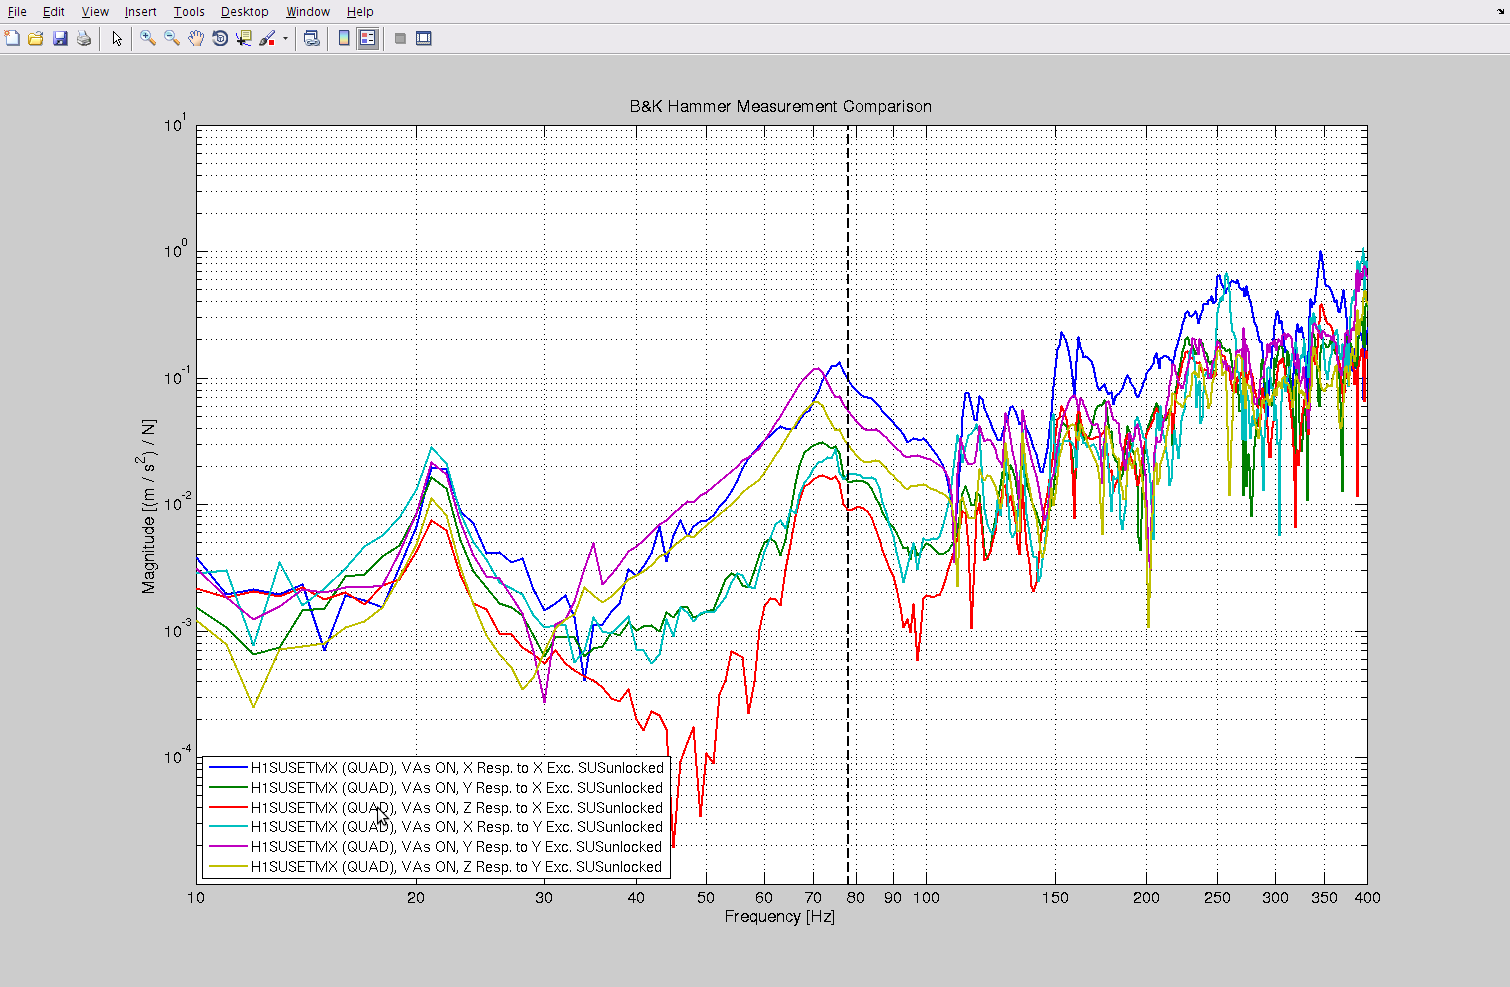
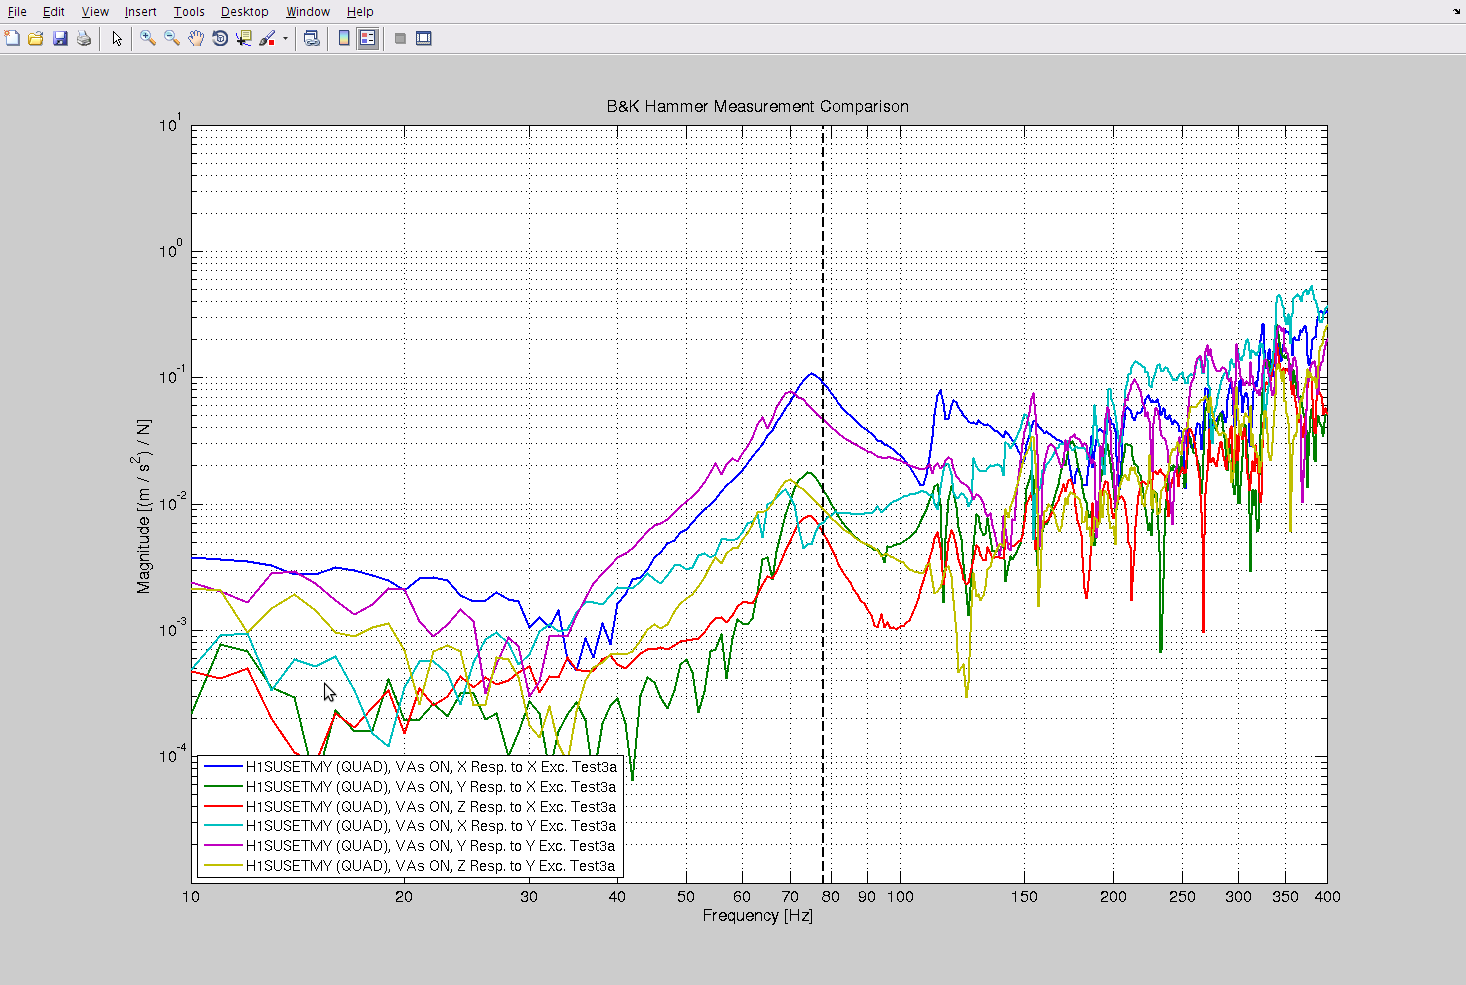
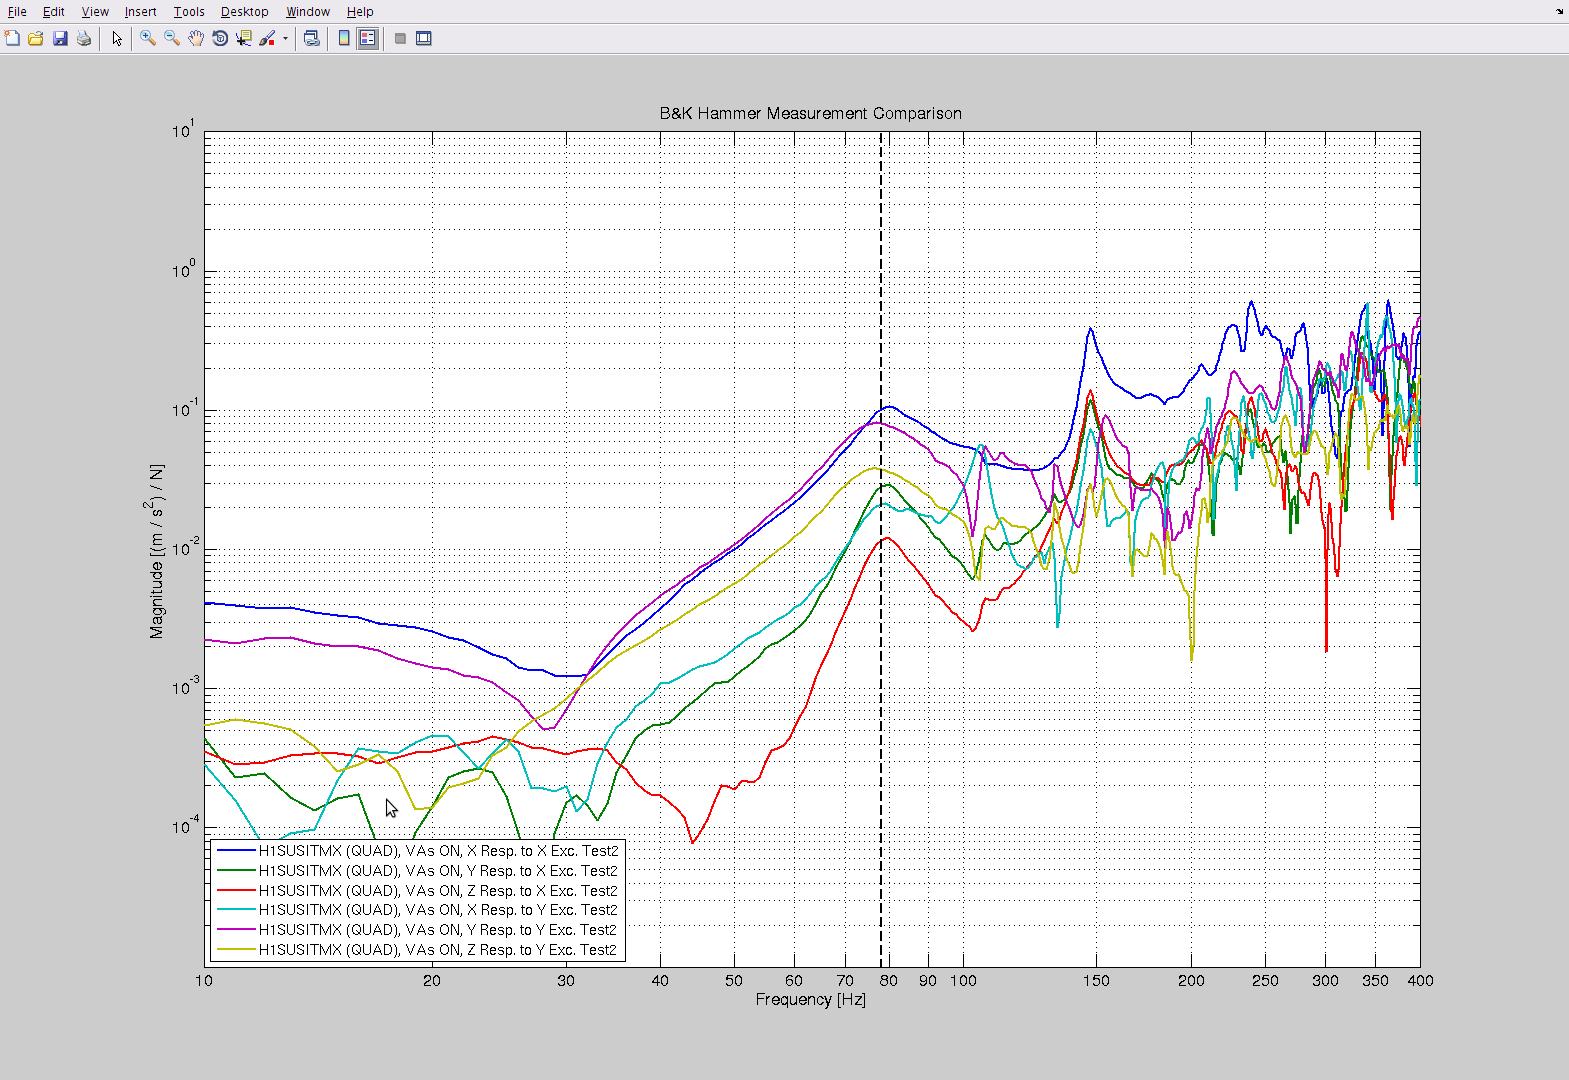
Using a nice plotting script from Stuart (maybe Arnaud?), I was able to plot a bunch of the ITM and ETM BandK hammer data that we took around installation. In all plots, the SUS was unlocked while the ISI's were locked (- it was decided long ago that there was not much change in the QUAD structure plots when comparing ISI locked and unlocked, and I confirmed this in a few cases again today). All data was taken in-chamber in the late stages of the installation.
Attached are plots of each of the 4 H1 QUADs, with a line marking 78Hz for ease of hunting, with the exception of the ITMY plot which has a marker at 75Hz. (The ITMY data was one of the first data sets taken and we did not manage to export it in the same manner as the subsequent measurements so it is posted in the BandK PDF plotting tool, and can't be imported easily into our matlab script. You can evaluate the 78Hz reagion just the same, however.)
In summary - the anticipated ~75Hz structure resonance are shown at:
ETMX 75Hz and lower ~few Hz
ETMY 75Hz and lower ~few Hz
ITMX 75Hz and higher ~few Hz
ITMY 75Hz and lower ~few Hz
I also replotted the ACB and the TMSY (no TMSX data apparently) and do not see anything around 75-78Hz.
Note, the plotting scripts can be found at:
/ligo/svncommon/SusSVN/sus/trunk/Common/MatlabTools/BandK_plot.m
Thanks to Stuart for today's help troubleshooting this.