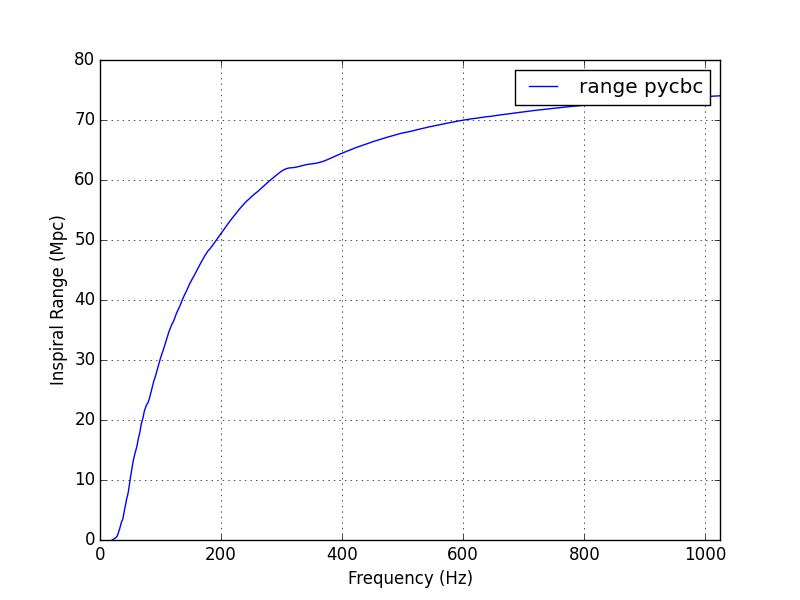
The attached plots show the inspiral range integrand, and cumulative integral, for a stretch of recent H1 strain data. This is just the standard integration of the strain noise power, weighted as (frequency)^(-7/3). I was also interested in the impact the 35-40 Hz calibration lines have on the range calculation, so the plots include a cumulative integral curve for which the calibration lines have been artificially removed from the strain spectrum (the strain noise in the 35-38 Hz band was replaced with the average strain noise at nearby frequencies). These curves (magenta) show that the calibration lines reduce the range calculation just a bit -- by just less than 1 Mpc.
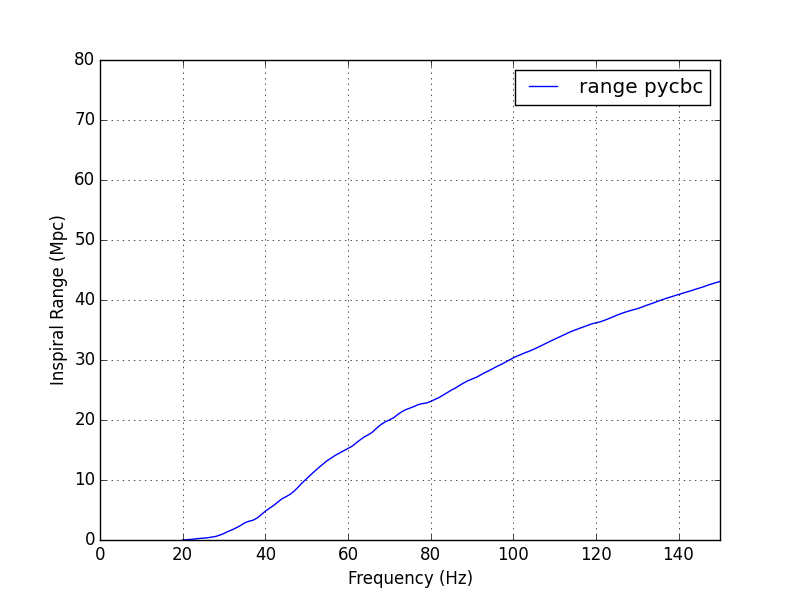
The inspiral range for the spectrum used is 75 Mpc. 90% of the total is accumulated by 150 Hz; the second plot thus shows the same data from 0-150 Hz. At the lower frequency end, 10% of the total range comes from the band 16-26 Hz.

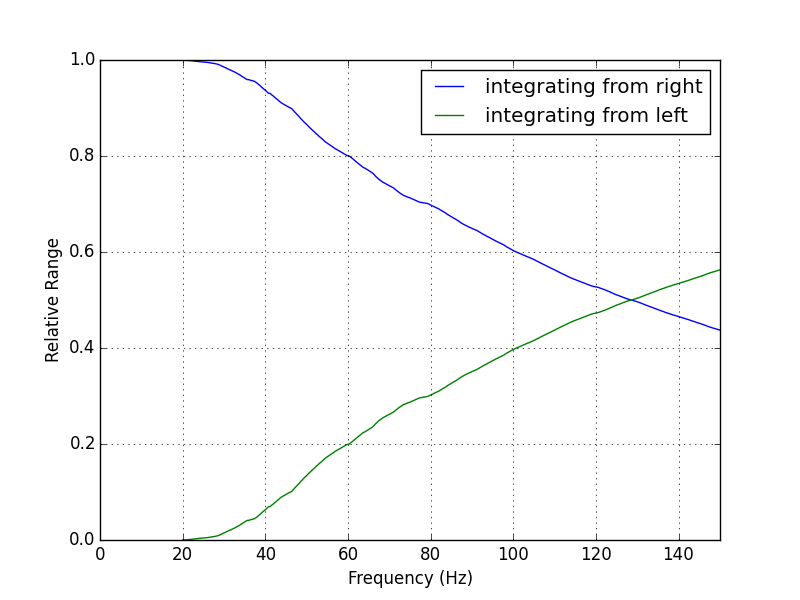
Hi Peter,

Andy pointed me to this post, indicating that this result shows we might want to filter from lower frequencies in the PyCBC offline CBC search. However, when we run our own scripts to generate the same result we don't see nearly as much range coming from the 20-30Hz band. Instead, we see only ~1% of the inspiral range coming from this band.

Initially Andy had a script that agreed with your result, however I've convinced him that there was a bug in that script. I think that it might be possible that the same bug is also present in yours.

I've attached a python script and a PSD from that time that should generate a relative range plot. I hope that it is clear enough to check if your scripts are doing the same thing.


Yes, indeed my script was making the error you allude to -- thanks for the correction. The integrand curves in my plots are correct, but the cumulative integral curves are not -- see Alex's plots for those. The corrected statements for Oct 6 - now somewhat obsolete due to reductions in the ~300 Hz periscope mount peaks - are that 90% of the range comes from the band 47 Hz - 560 Hz. About 1% of the range comes from frequencies below 29 Hz.