I have been somewhat curious about how our power recycling cavity's optical gain changes throughout a lock stretch. This is a somewhat different analysis to Sheila's from aLog 21073, where she looked at what optical gain we first lock at.
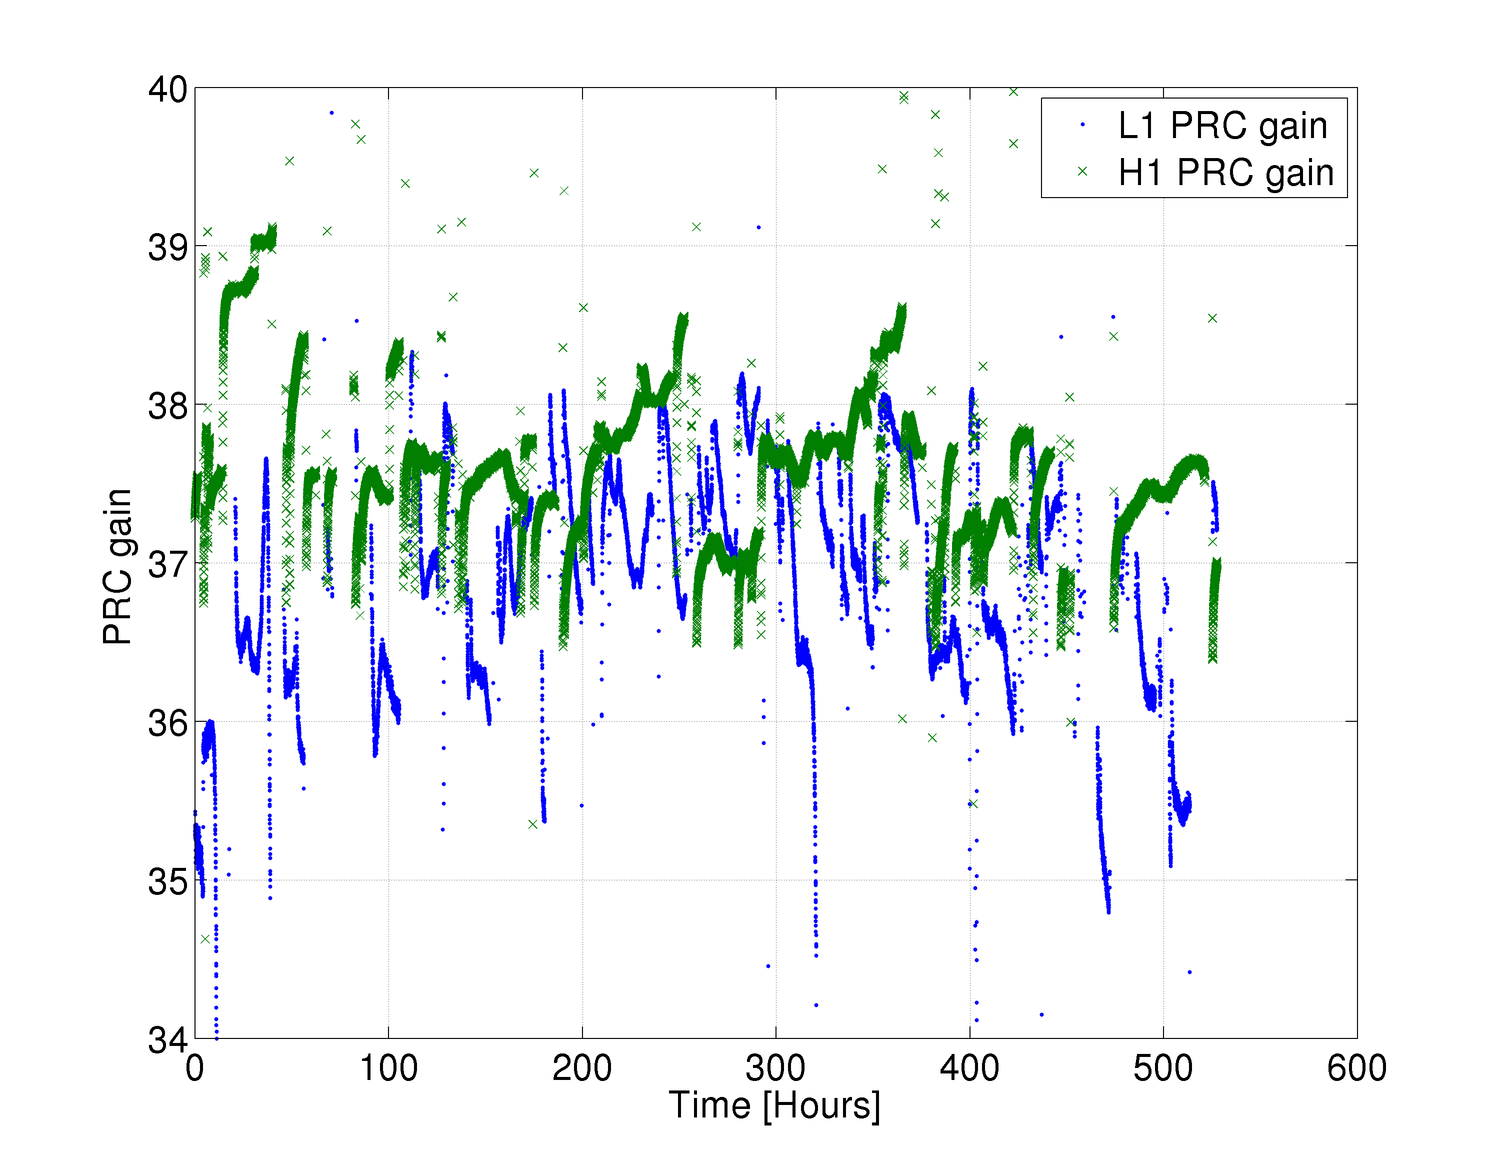
My first attachment shows the power recycling gain for both Hanford and Livingston for the first ~21 days of O1. Hanford is green xs, Livingston is blue dots. For Hanford, I estimate the PRC gain by multiplying the Yarm transmission by the PRM transmission. For Livingston, I estimate the PRC gain by dividing the POP DC power by the power input to the IFO. Both of these methods assume that the signals I'm using are appropriately calibrated, but they're the same way that seems to be used at each respective site by others. So, while I don't guarantee the absolute values of the PRC gains in my plots, the trends are what I'm looking at. Note also that these are every lock stretch that gets as far as the power-up state, regardless of comissioning/observing intent.
I am only plotting the PRC gain at times when the IFOs have completed their respective power-up states (LHO = INCREASE_POWER, LLO = RF_LOCKED_AT_25W). I don't have much to say about this plot other than that overall, LHO seems to be a little more consistent at getting to the same PRC gain each lock.
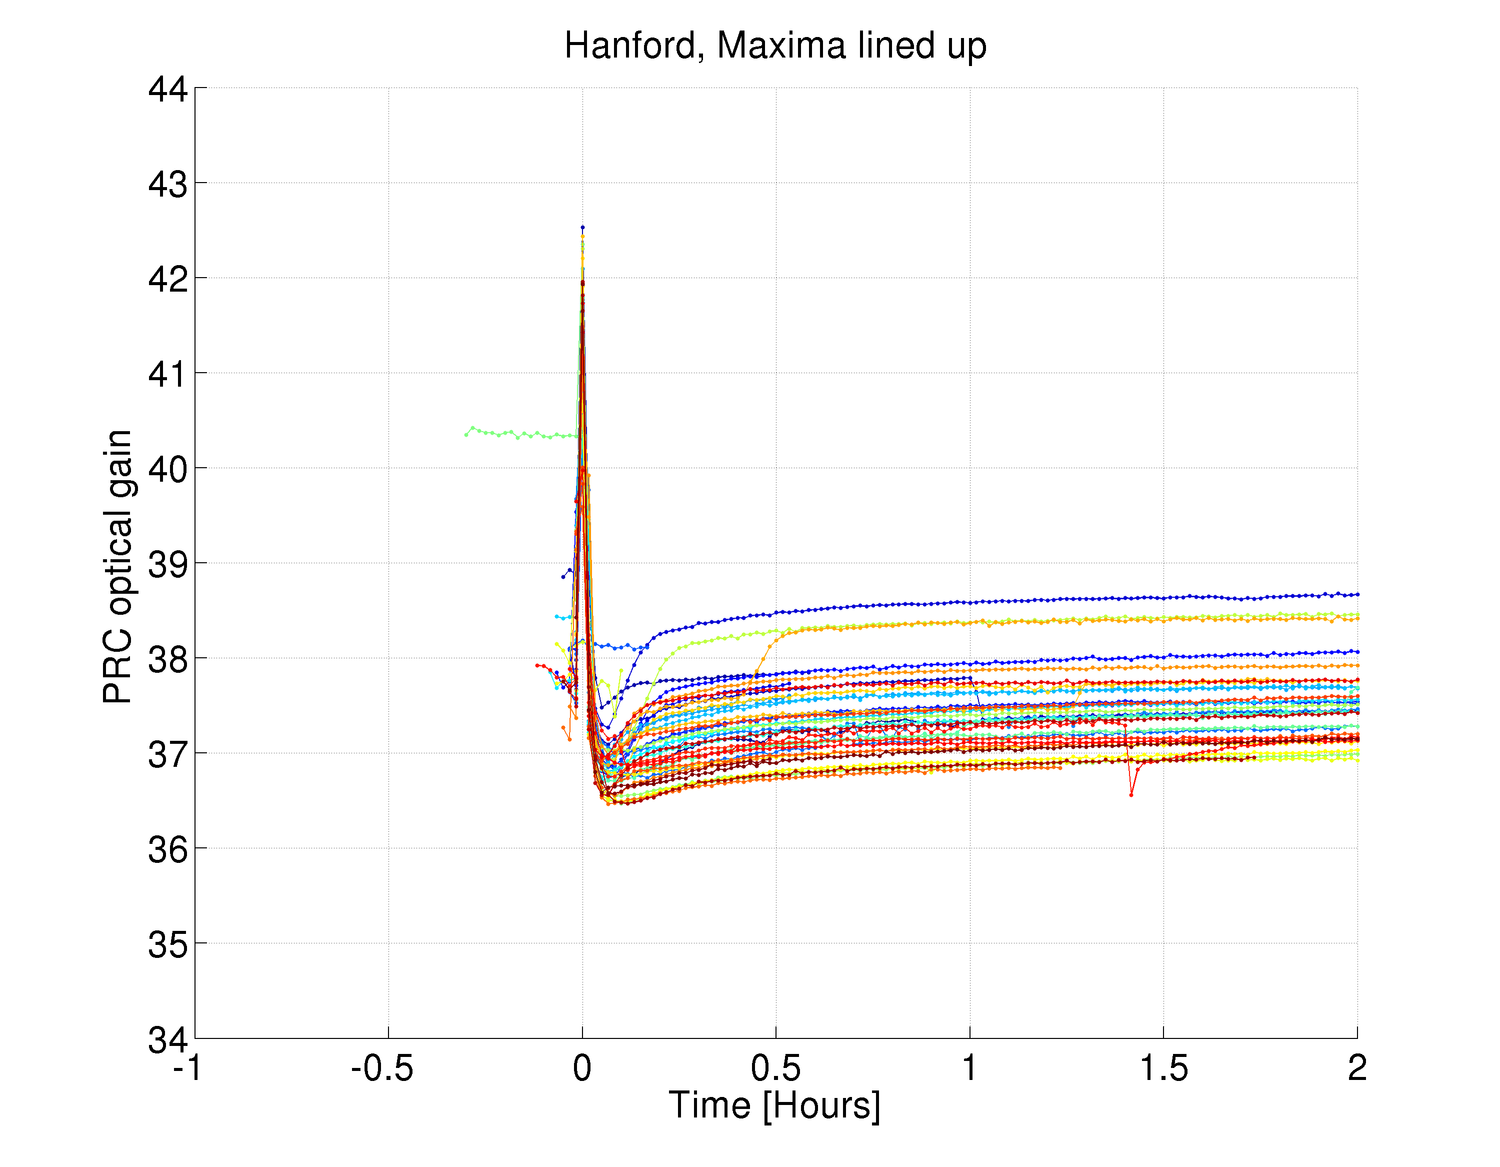
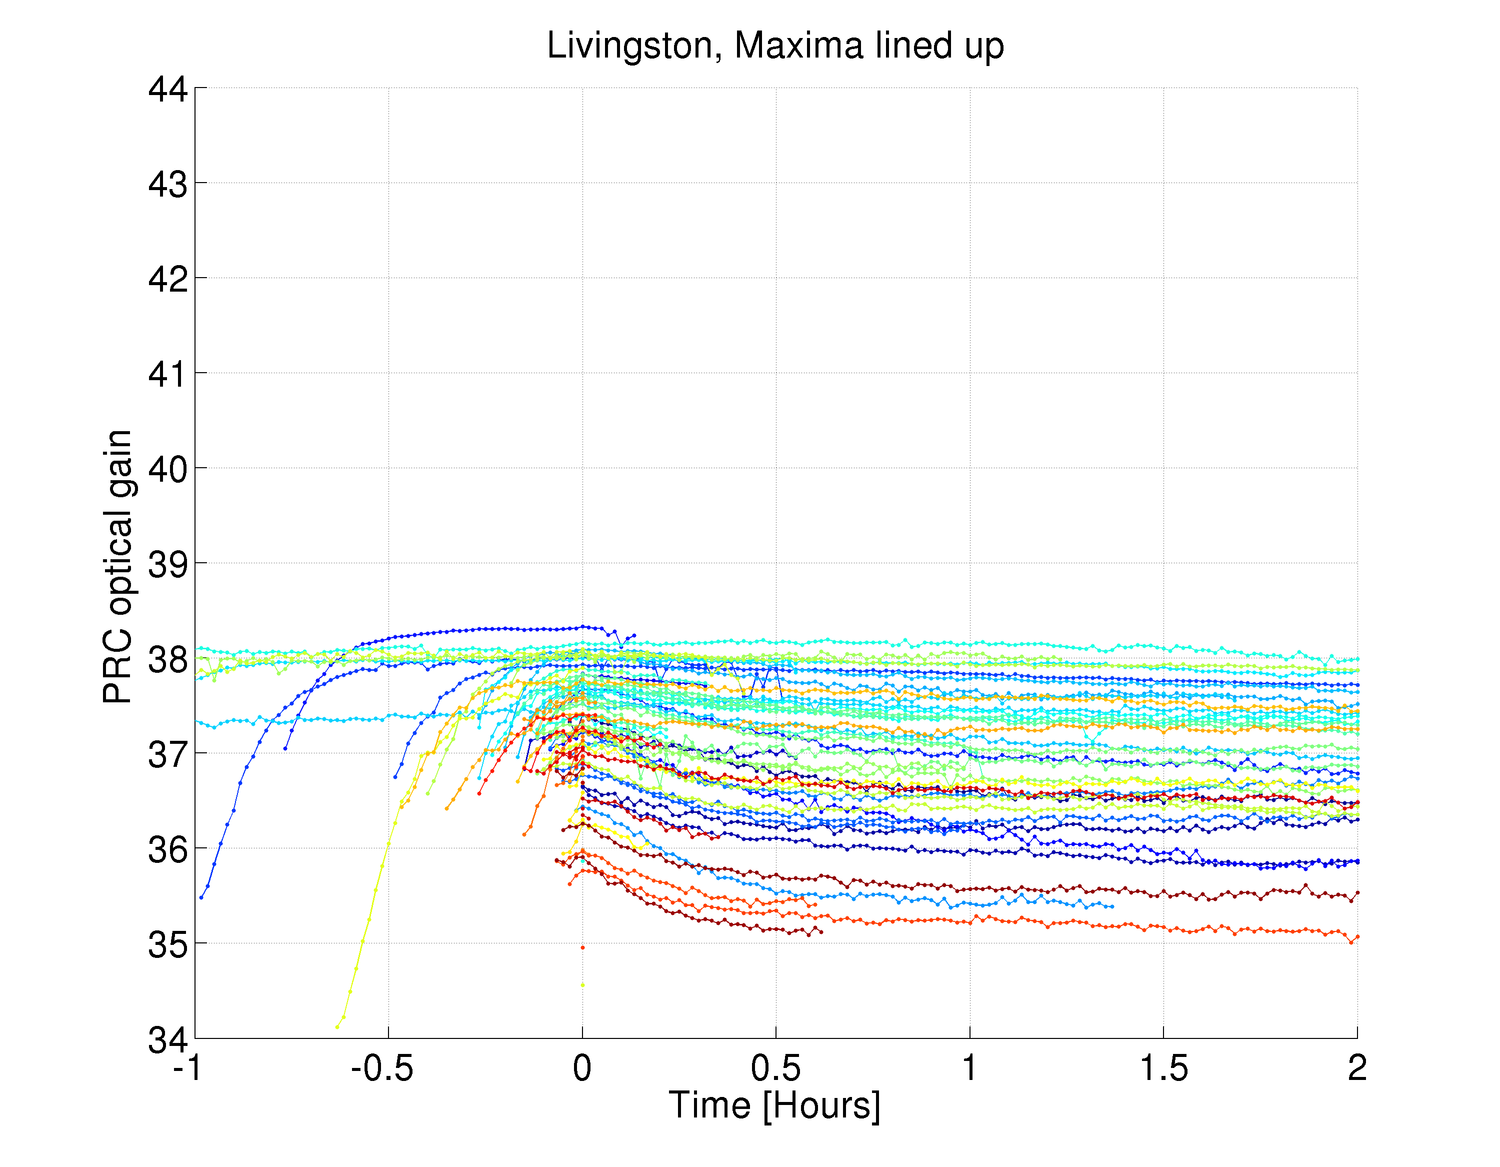
Perhaps more illuminating are the following 2 plots (one per IFO), where I have lined up the maximum PRC gain from each lock stretch (t0 for each trace is the time where the maxima occurs. The start of the traces are the time when the state following the power-up state begins). There are 49 traces on the LHO plot, and 111 on the LLO plot, so I'm just trying to look at the general character of the traces, rather than pick any one particular trace out of each plot.
Here at LHO we have a large spike in the recycling gain right after we power up, then we settle out. At LLO, they seem to have a much smaller, more smooth hump before settling out, although the time constant seems to be roughly similar between both sites. At LLO (at least according to their guardian state names) they spend some time at 10W before going to full power, so that could be the reason for the difference in character.