Josh, Andy
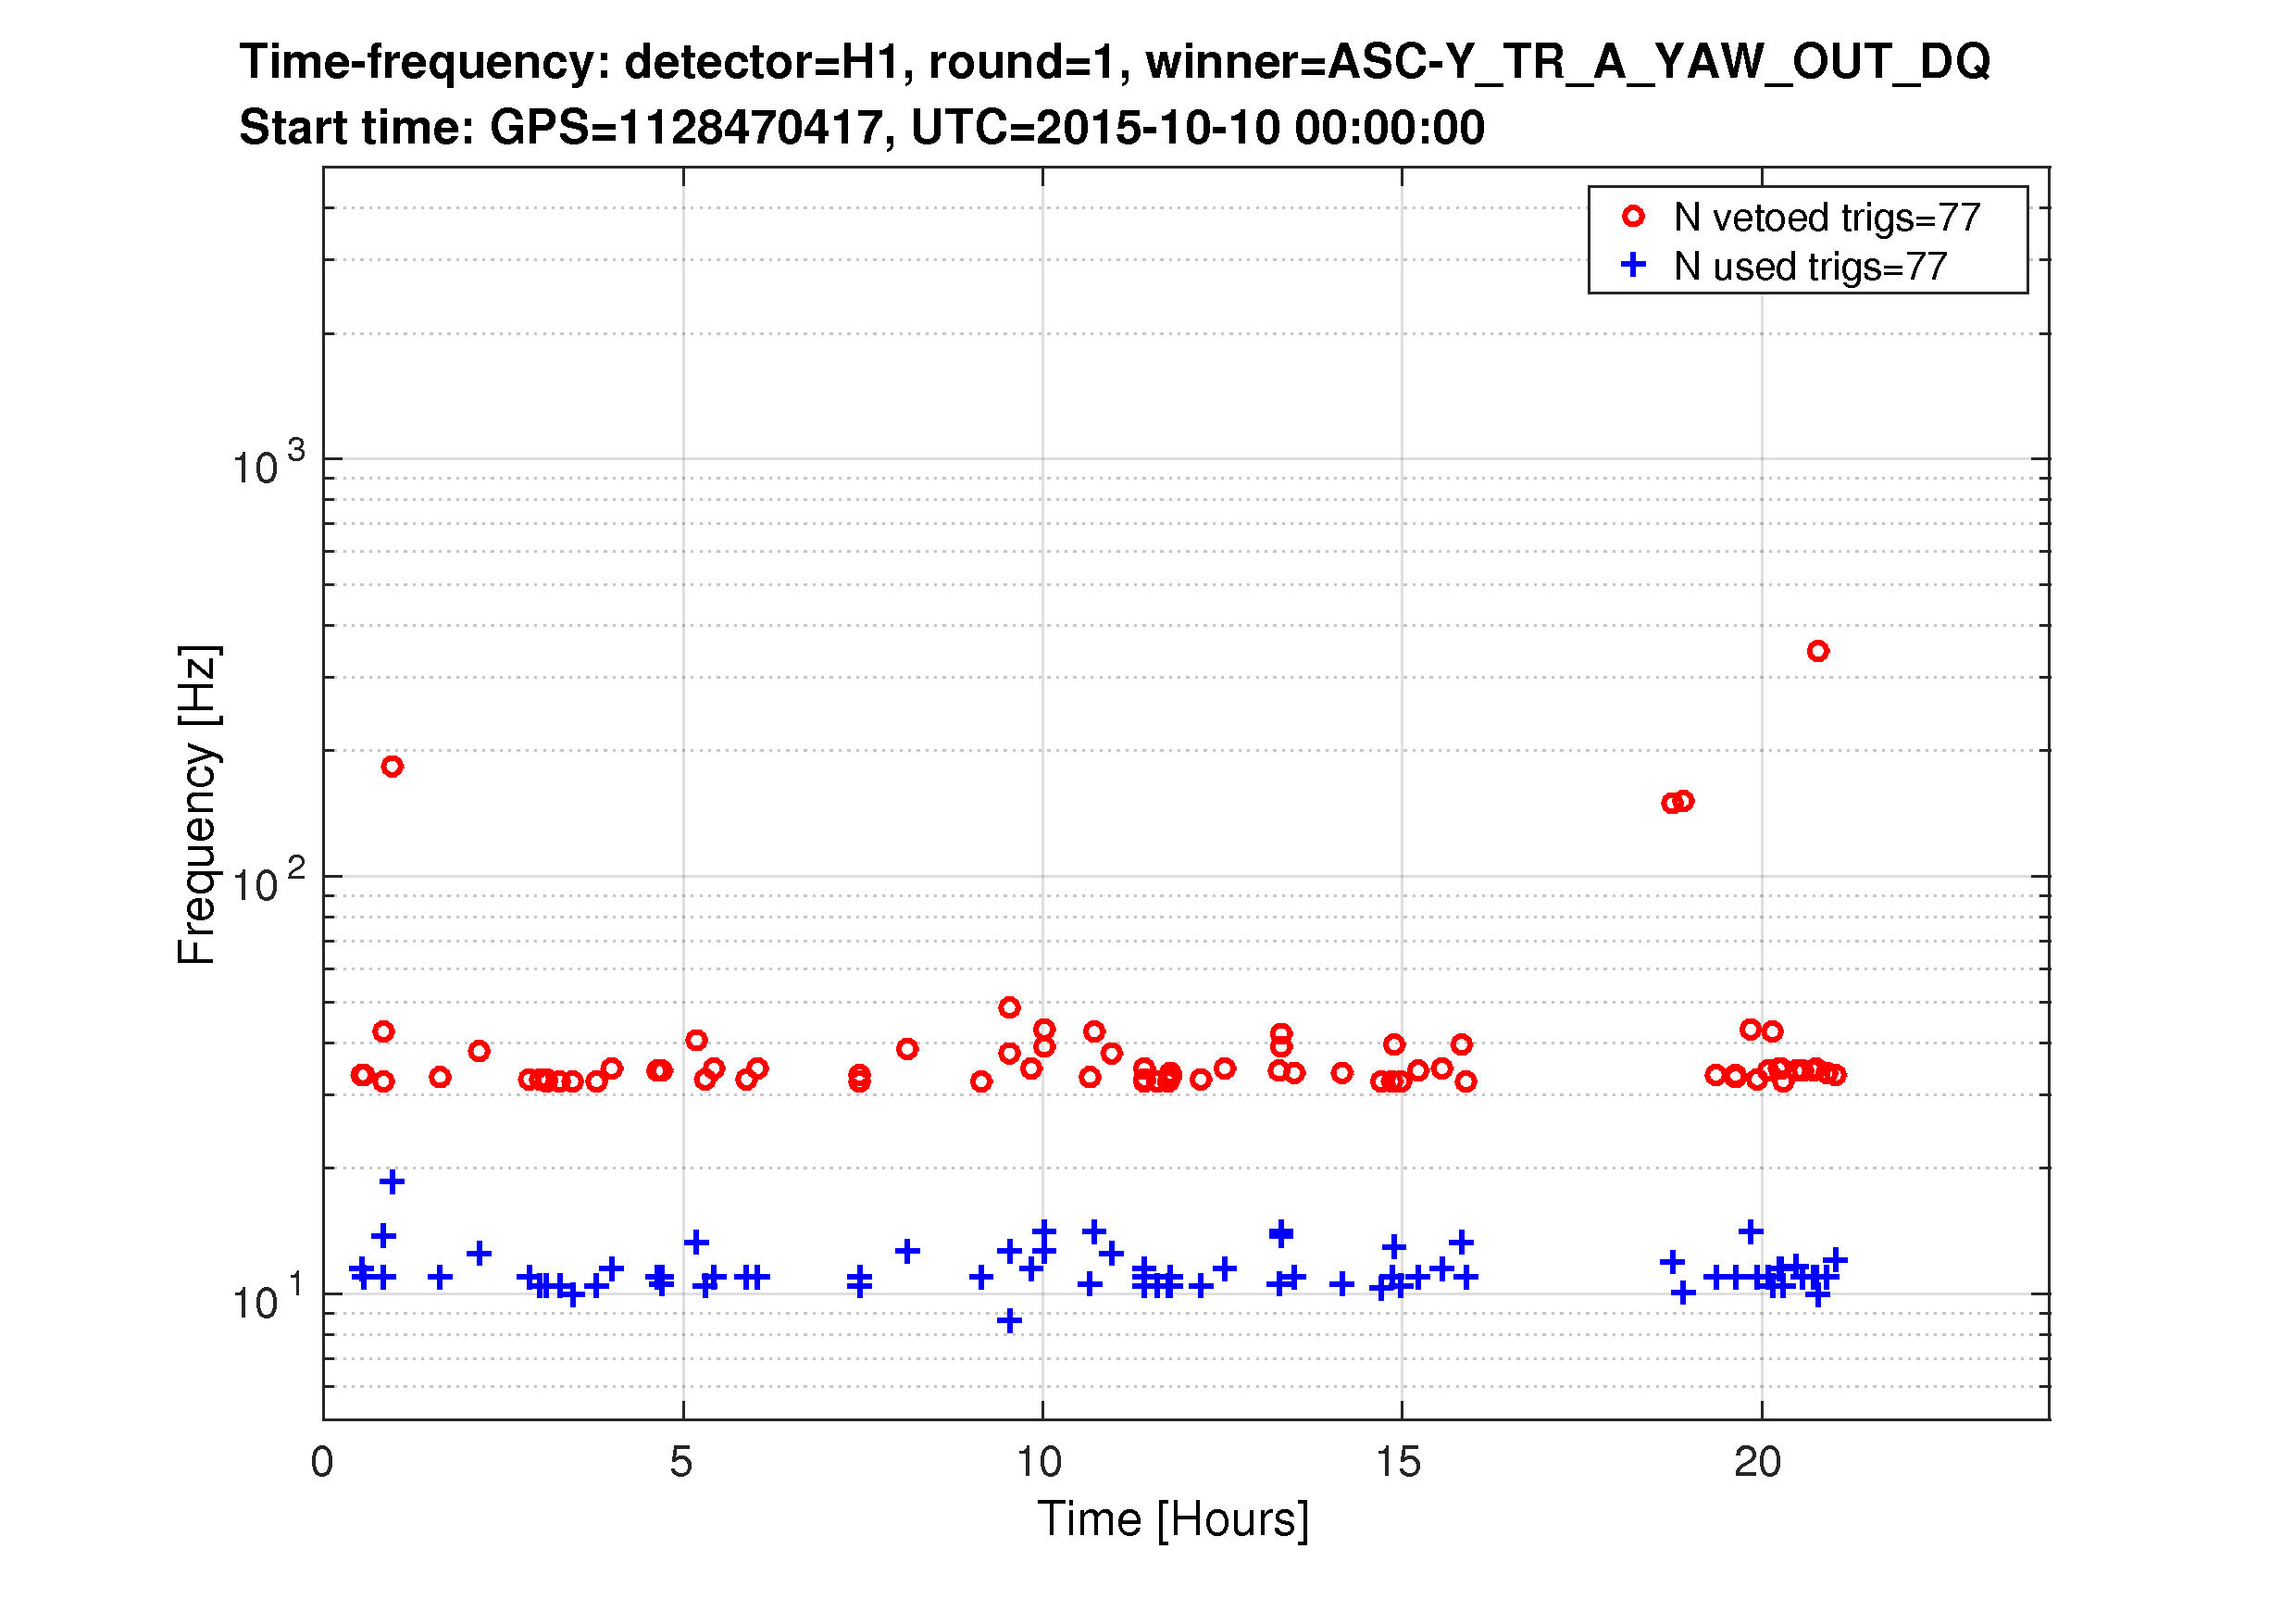
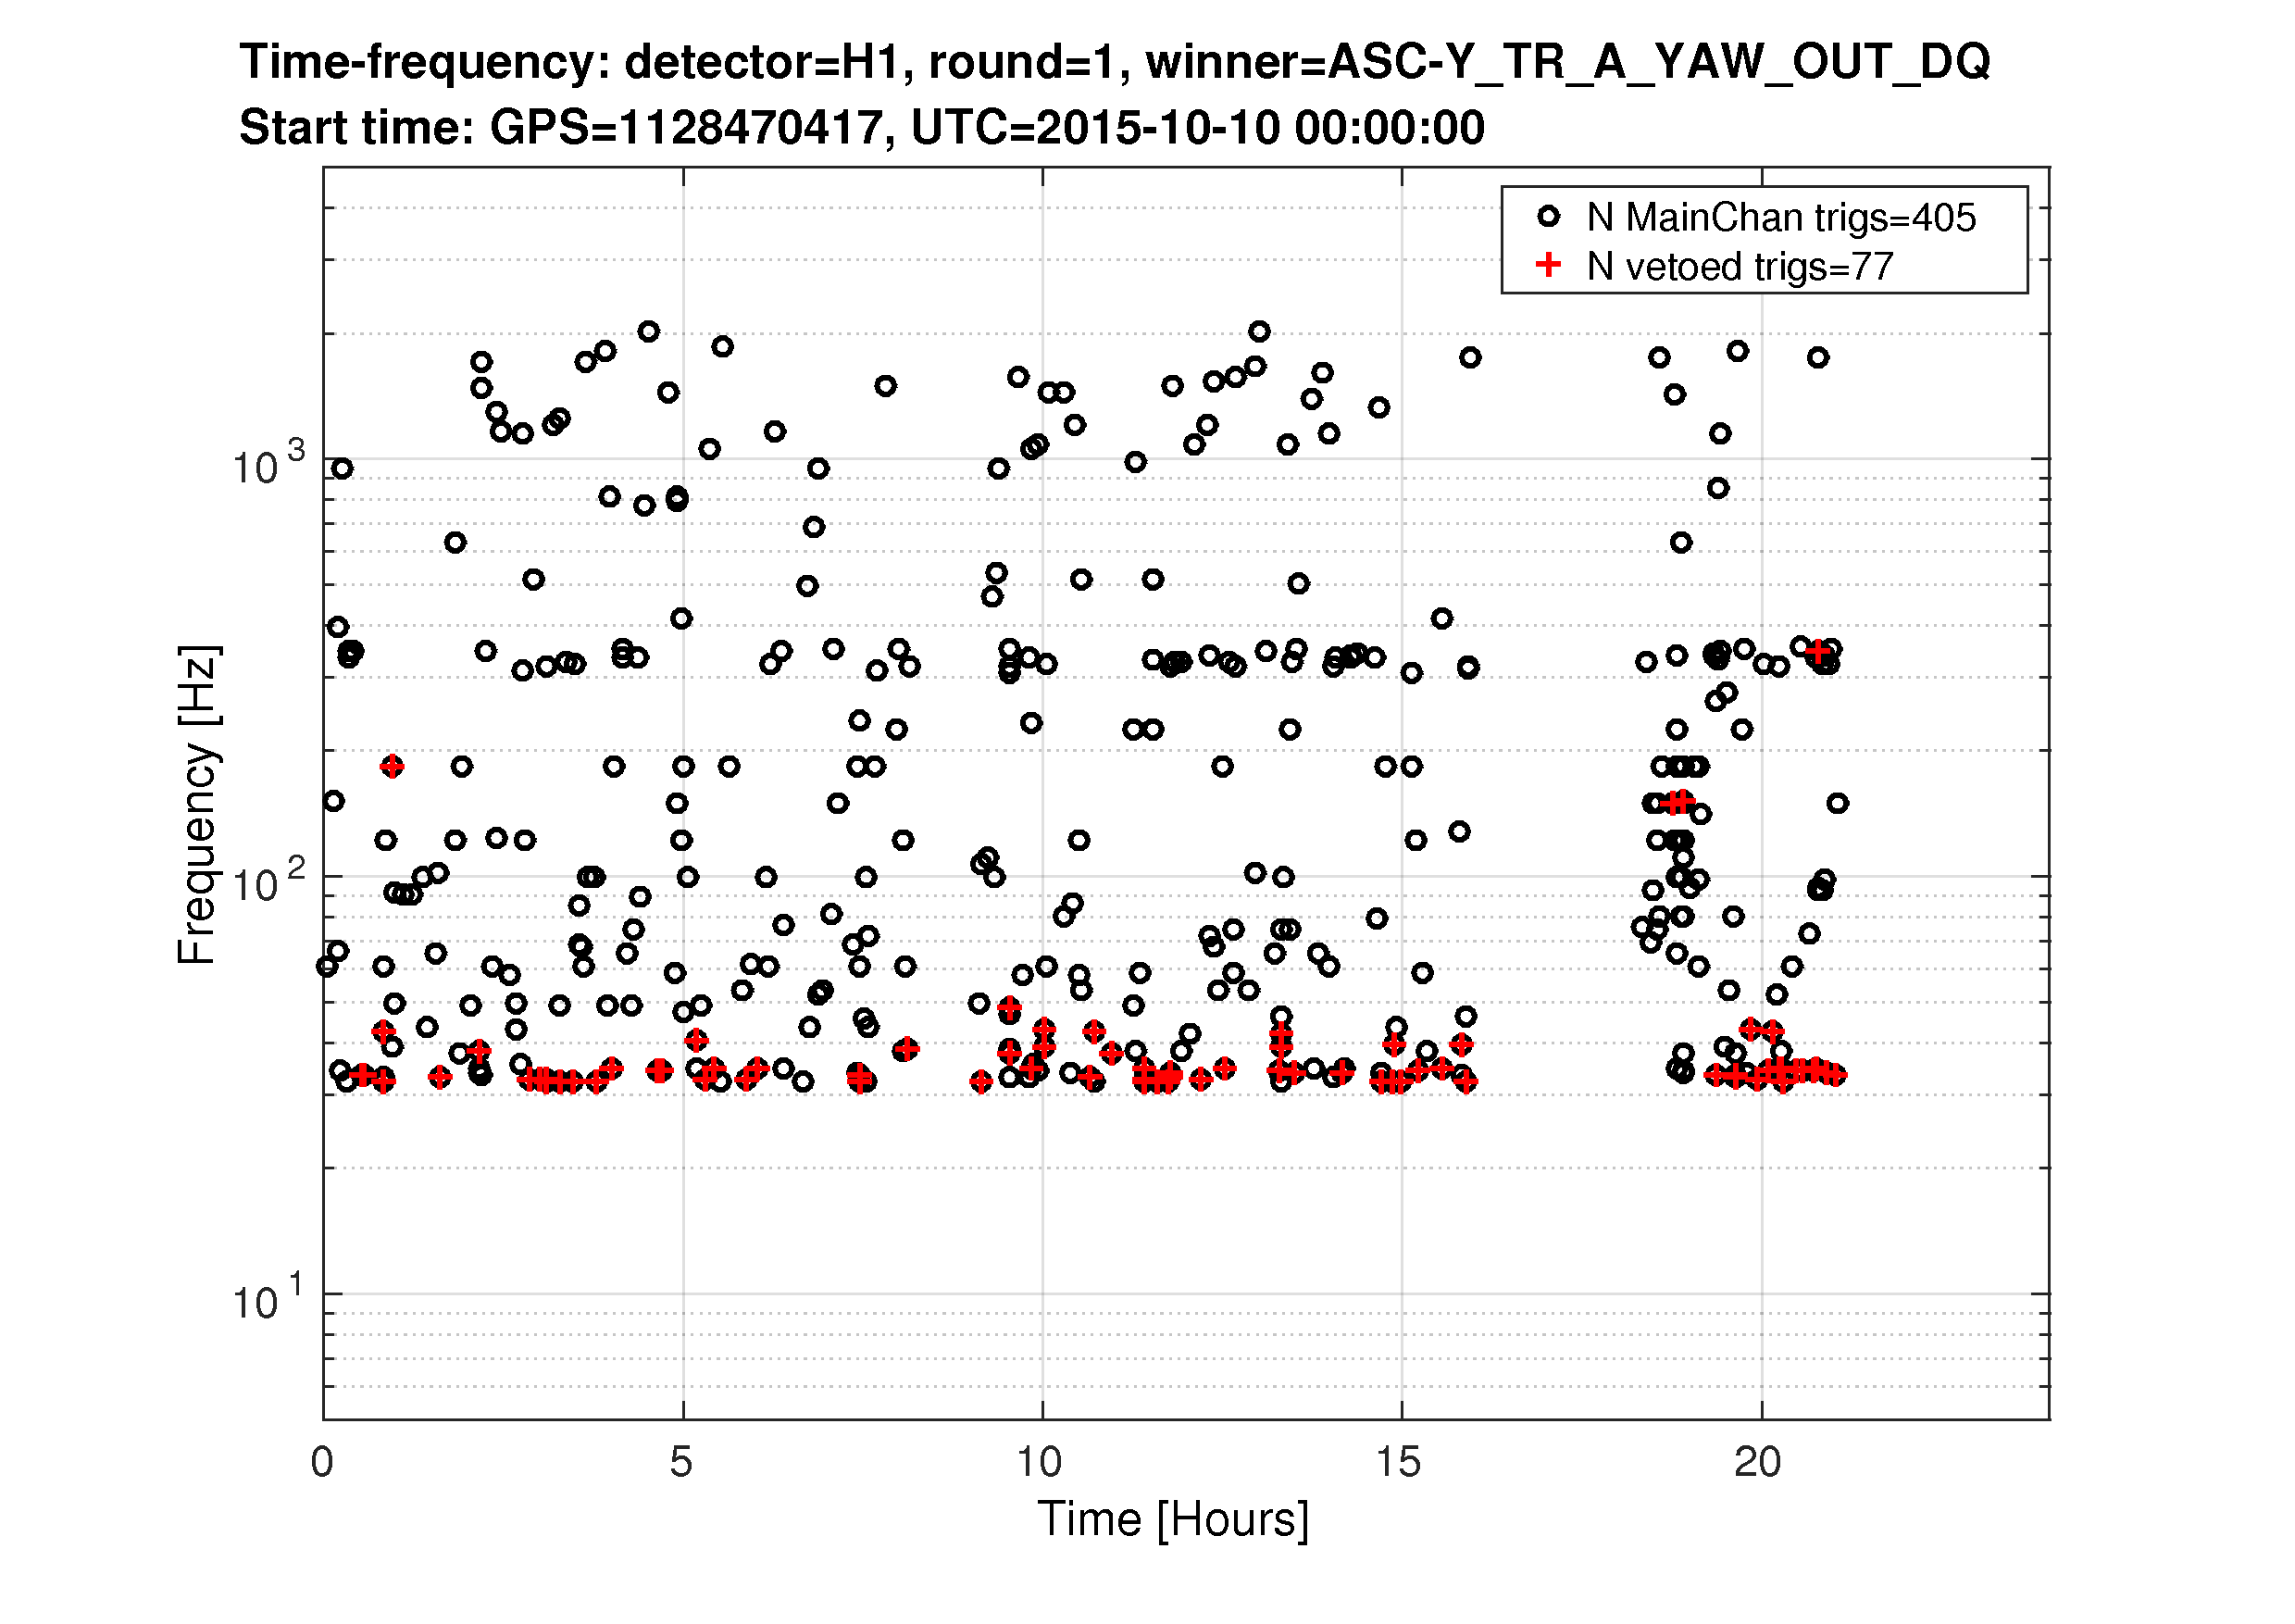
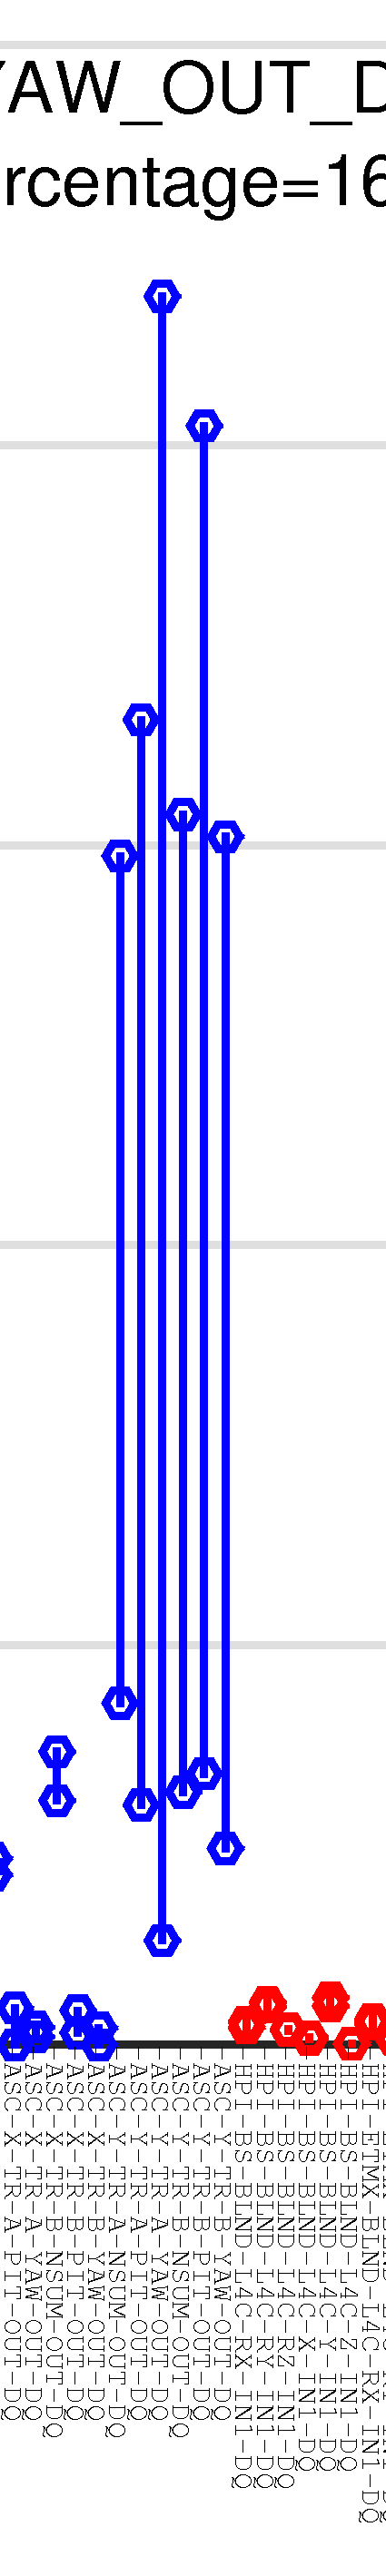
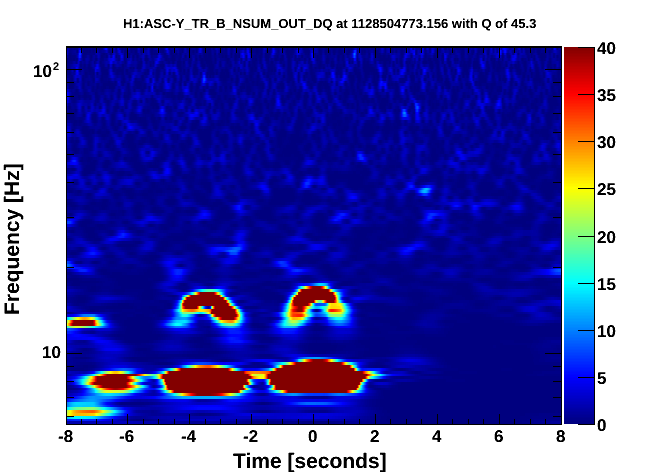
Yesterday's hveto page found a very constant rate of 30-40Hz glitches in DARM were vetoed by a population of 10-15Hz glitches in the End-Y QPDs (ASC-Y_TR_{A,B}_{NSUM,YAW,PIT}_OUT_DQ). Fig1 shows the time/freq of the DARM triggers and the ASC-Y triggers that vetoed them, Fig 2 shows the time/freq of all DARM triggers and the ones that got vetoed, and Fig 3 shows how the ranking statistic found all ASC-Y channels to be correlated. A .txt file with the times of vetoed DARM triggers is attached in case folks want to look at other channels around those times.
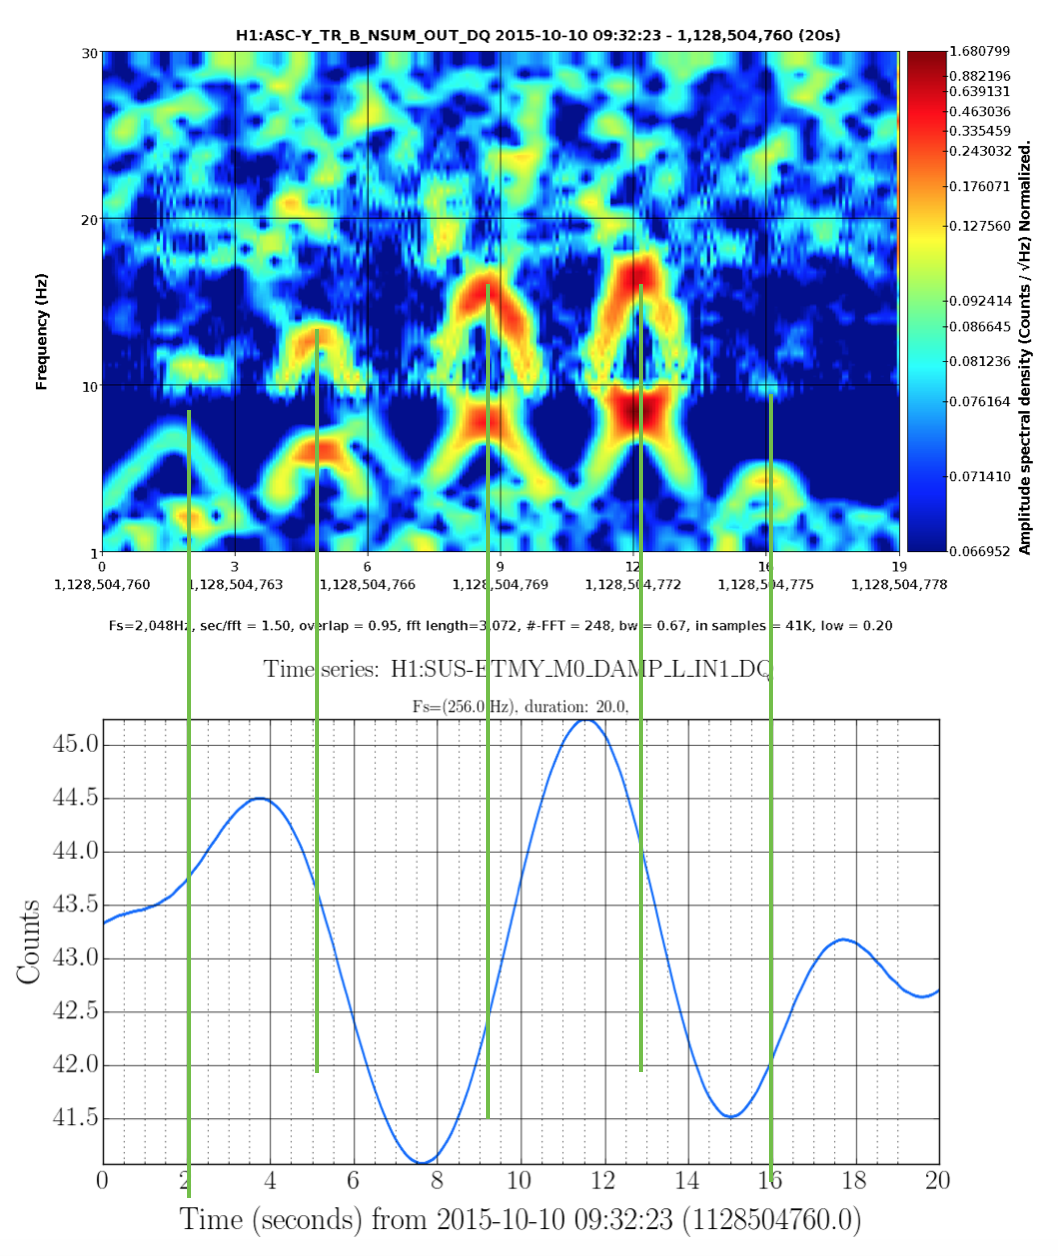
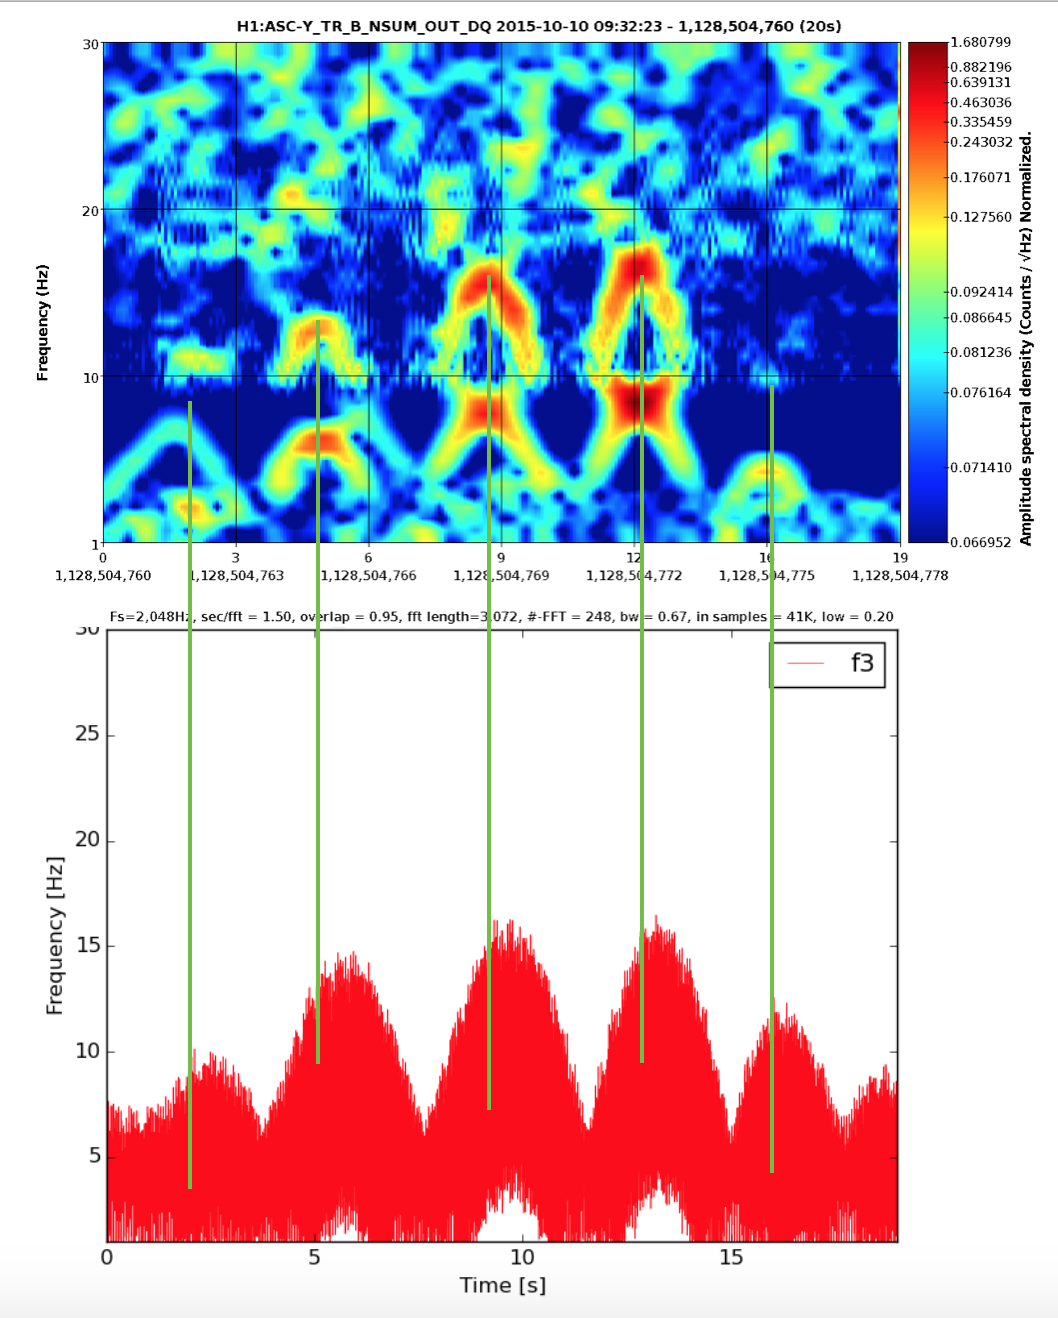
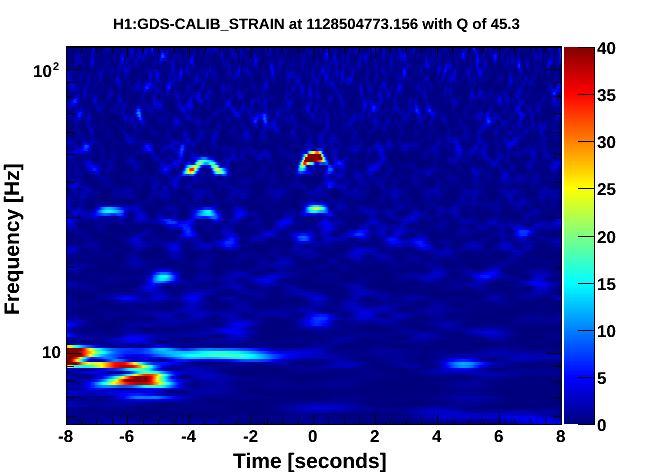
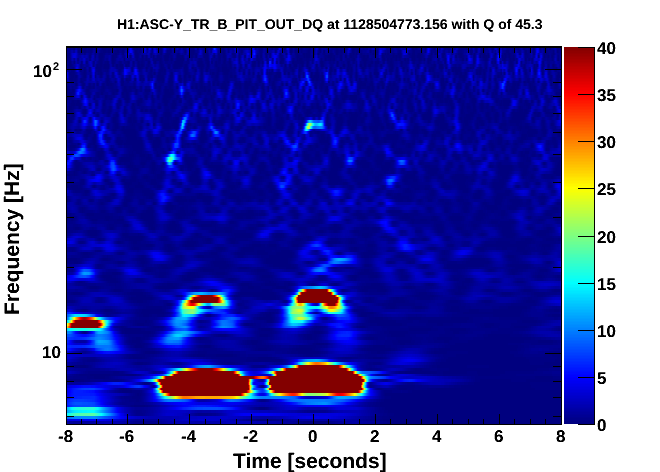
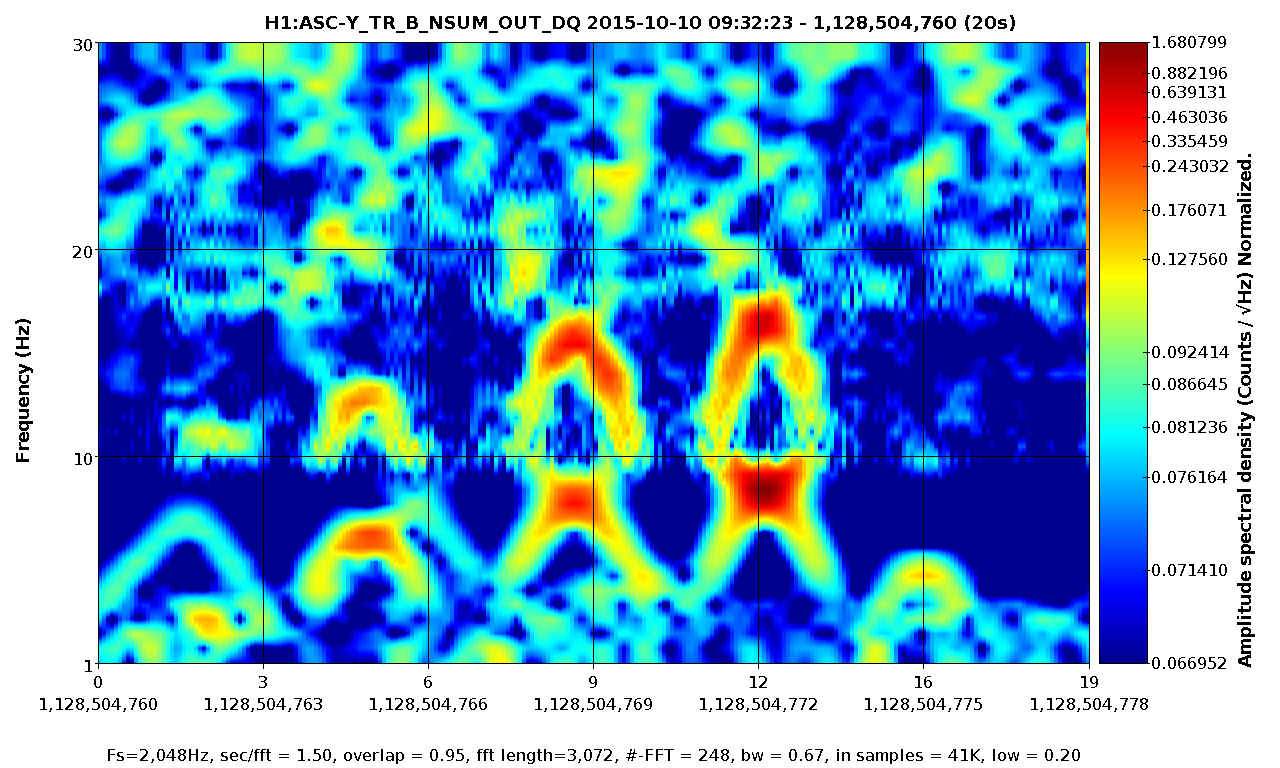
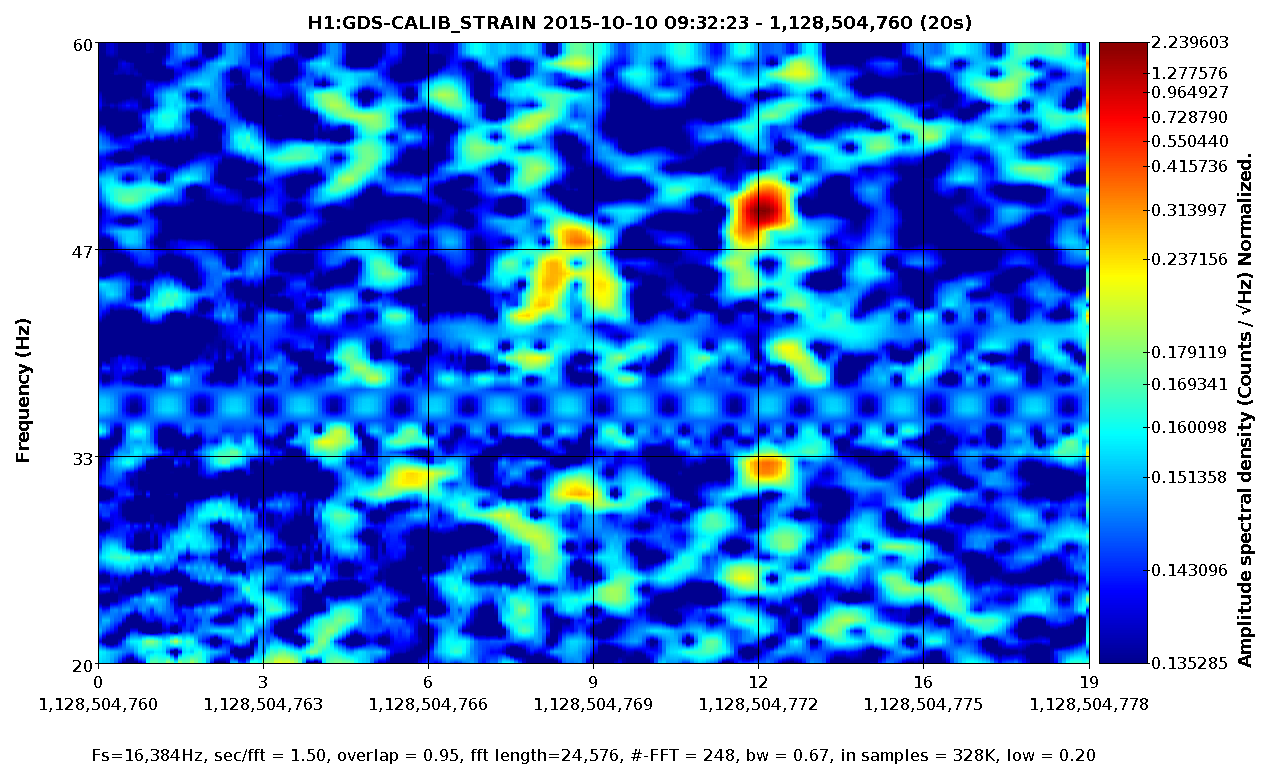
Fig 4 shows DARM, figs 5,6 show ASC-Y channels, figs 7,8 show zoomed specgrams to see the frequency. What we see are strong scattering arches around 8 and 16 Hz in all of the End-Y QPD channels, at the same time as similarly shaped fringes in DARM around 48Hz. I think DARM (more sensitive to scatter, potentially, at higher frequencies) is seeing the 6th overtone of the 8Hz arch (multiple reflections?). The higher overtones are sometimes visible in the QPDs too.
So...what scatterer/optics is moving too much? We know [1] that f_fringe(t) = abs(2 v_sc(t) / lambda). Where v_sc(t) is the time derivative of the position of the scatterer x_sc(t). The time between peaks is about 3.5 seconds, but that is half the period because of the abs() so it's a ~7 second period or 0.14Hz motion of the scatterer.
Note: We checked and the beam diverter is closed (H1:SYS-MOTION_Y_BDIV_A_POSITION = 1).
Note 2: Today's hveto page hasn't finished yet, but no reason to believe this isn't happening still.
[1] Accadia, T., et al. "Noise from scattered light in Virgo's second science run data." Classical and Quantum Gravity 27.19 (2010): 194011.

It probably won't surprise anyone to learn that ETMY top-stage motion correlates pretty well with these fringes. Though, likely lots of things are moving in this way following the high microseism.
- The first plot shows that the fringe maxima correspond to roughly where the derivative is max on the ETMY longitudinal motion (judging from channel SUS-ETMY_M0_DAMP_L_IN1_DQ).
- The second plot shows: f_scatter3 = 3*abs(2*velocity/1.064), where velocity is the time derivative of SUS-ETMY_M0_DAMP_L_IN1_DQ in um/s (assuming that channel is in um.).
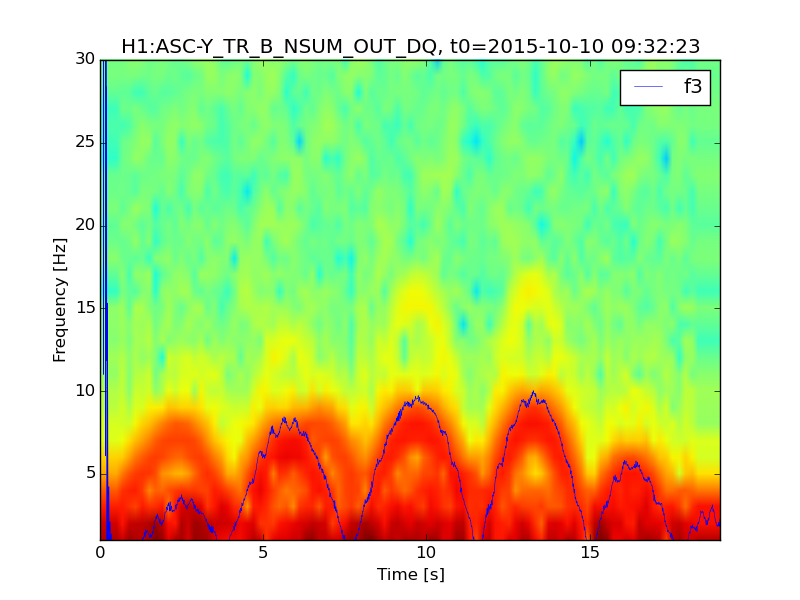
- The third plot, which shows a (not normalized) spectrogram of ASC Y TR NSUM and f_scatter3 after lowpassing the L_IN1 channel to remove its 60Hz (which was making the fringe prediction noisy)
- Don't know what to make of the need for either the 3rd overtone or the motion being 3x what the channel reads in um.