Related: alog 22199
We measured the output of the Low Voltage ESD monitor (D1500129) at the AA side at the remote rack using SR785 right after the IFO was locked up again after the maintenance.
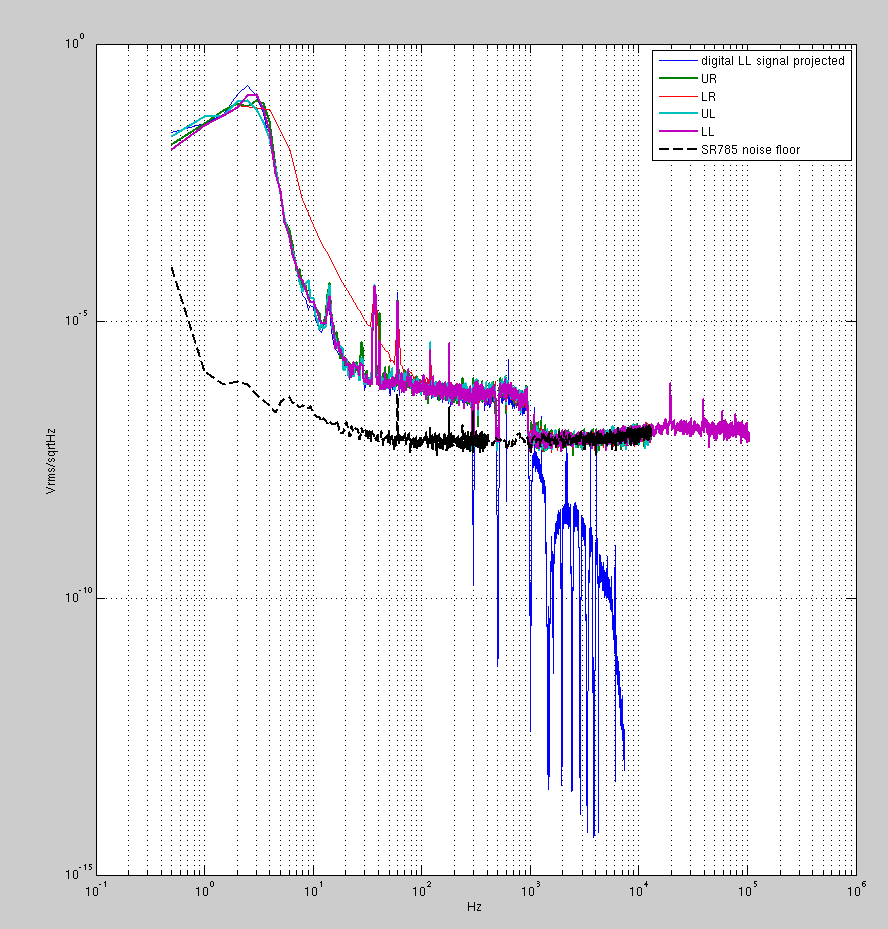
No surpise was found, see attached. 'UR', 'UL' etc. are the analog measurements of the corresponding ESD monitor. Noise floor was measured with the inputs of SR785 short circuited.
Don't worry about LR trace, it looks as if it's noisier than the others but it's not, it's just the spectral leakage artefact (somehow I did not save the small BW measurement for LR).
'digital LL signal projected' is H1:SUS-ETMY_L3_MASTER_OUT_LL, but with a correction of 20/2^17 Volt/count for DAC conversion, zpk([50;50;3250], [2.2;2.2;152]) for SUS awhite type filters, and 2 *4.99/(1.2+15+4.99)*zpk([],[40]) for the monitor circuit.
The measurements agree well with the projection up to 1kHz. Higher than that, the SR785 noise dominates, but this should be good enough for our purpose.
What was done:
We disconnected the LV ESD monitor cable (SUS ESD 06) from the front panel of the AA, and connected DB9 breakout board to the cable but not to the AA.
For each quadrant (pin1-6 for UR, 2-7 for LR, 3-8 for UL and 4-9 for LL), we used two clip-BNC cables to connect the positive pin (1, 2, 3 or 4) to A connector of SR785 and negative to B, and the BNC shell was connected to the shell of the DB9 connector on the AA chassis.
SR785 was in A-B mode, AC coupled. The plot doesn't account for the AC coupling, but its roll off is at 0.16Hz and does not affect the plot. Sensitivity was fixed at -8dBVpk.
Low frequency measurements (0-400Hz, 800 lines) were performed for all quadrants but it was not saved for LR. As a result, in the plot it looks as if LR is noisier than the other channels, but in reality it's showing the spectral leakage artefact due to larger bandwidth measurement for f<400Hz.
Higher frequency measurements (0-1.2k and 0-12.8k, 800 lines) were performed and saved for all quadrants.
Only for LL we measured up to 102kHz to make sure that there's no high frequency bump or anything, but all measurements are dominated by SR785 noise for f>1kHz anyway.
Attached is the matlab file containing the voltage data for all quadrants and the SR785 noise.

Um, count-to-voltage DC gain conversion of the DAC is 20Vpp differential per 2^18 counts. So the grandparent entry is incorrect by a factor of 2 there. But I'm measuring the voltage in the differential output stage of LV driver which has the DC gain of 2 (i.e. 10V pp single ended is converted to 10V pp differential), which I didn't account for in the script.
So in the end the conclusion doesn't change.