We're still having operators run A2L before going to Observe or when leaving Observe (e.g. for maintenence), so there's more data to come, but I wanted to post what we do have, so that we can compare with LLO's aLog 21712.
The 2 plots are the same data: The first uses the same axis limits as the LLO plot, while the second is zoomed in by a factor of 5.
It certainly looks like we aren't moving nearly as much as LLO is.
Note that the values for both LLO and LHO are missing a coupling factor of L2P->L3L, which will change the absolute value of the spot position displacements. However, since we're both wrong by the same factor, our plots are still comparable. See aLog 22096 (the final comment in the linked thread) for details on the factor that we still need to include.

Today I went through all of the A2L data that has been collected so far, and pulled out for analysis all of the runs for each optic that had acceptable data. Here, I'm defining "acceptable" as data sets that had reasonable linear fits, as displayed in the auto-generated figures.
In particular, for almost all of the ETMY data sets, there is one data point that is very, very far from the others, with large error bars. I'm not sure yet why we seem to have so much trouble collecting data for ETMY. I've emailed Marie at LLO to see if they have similar symptoms.
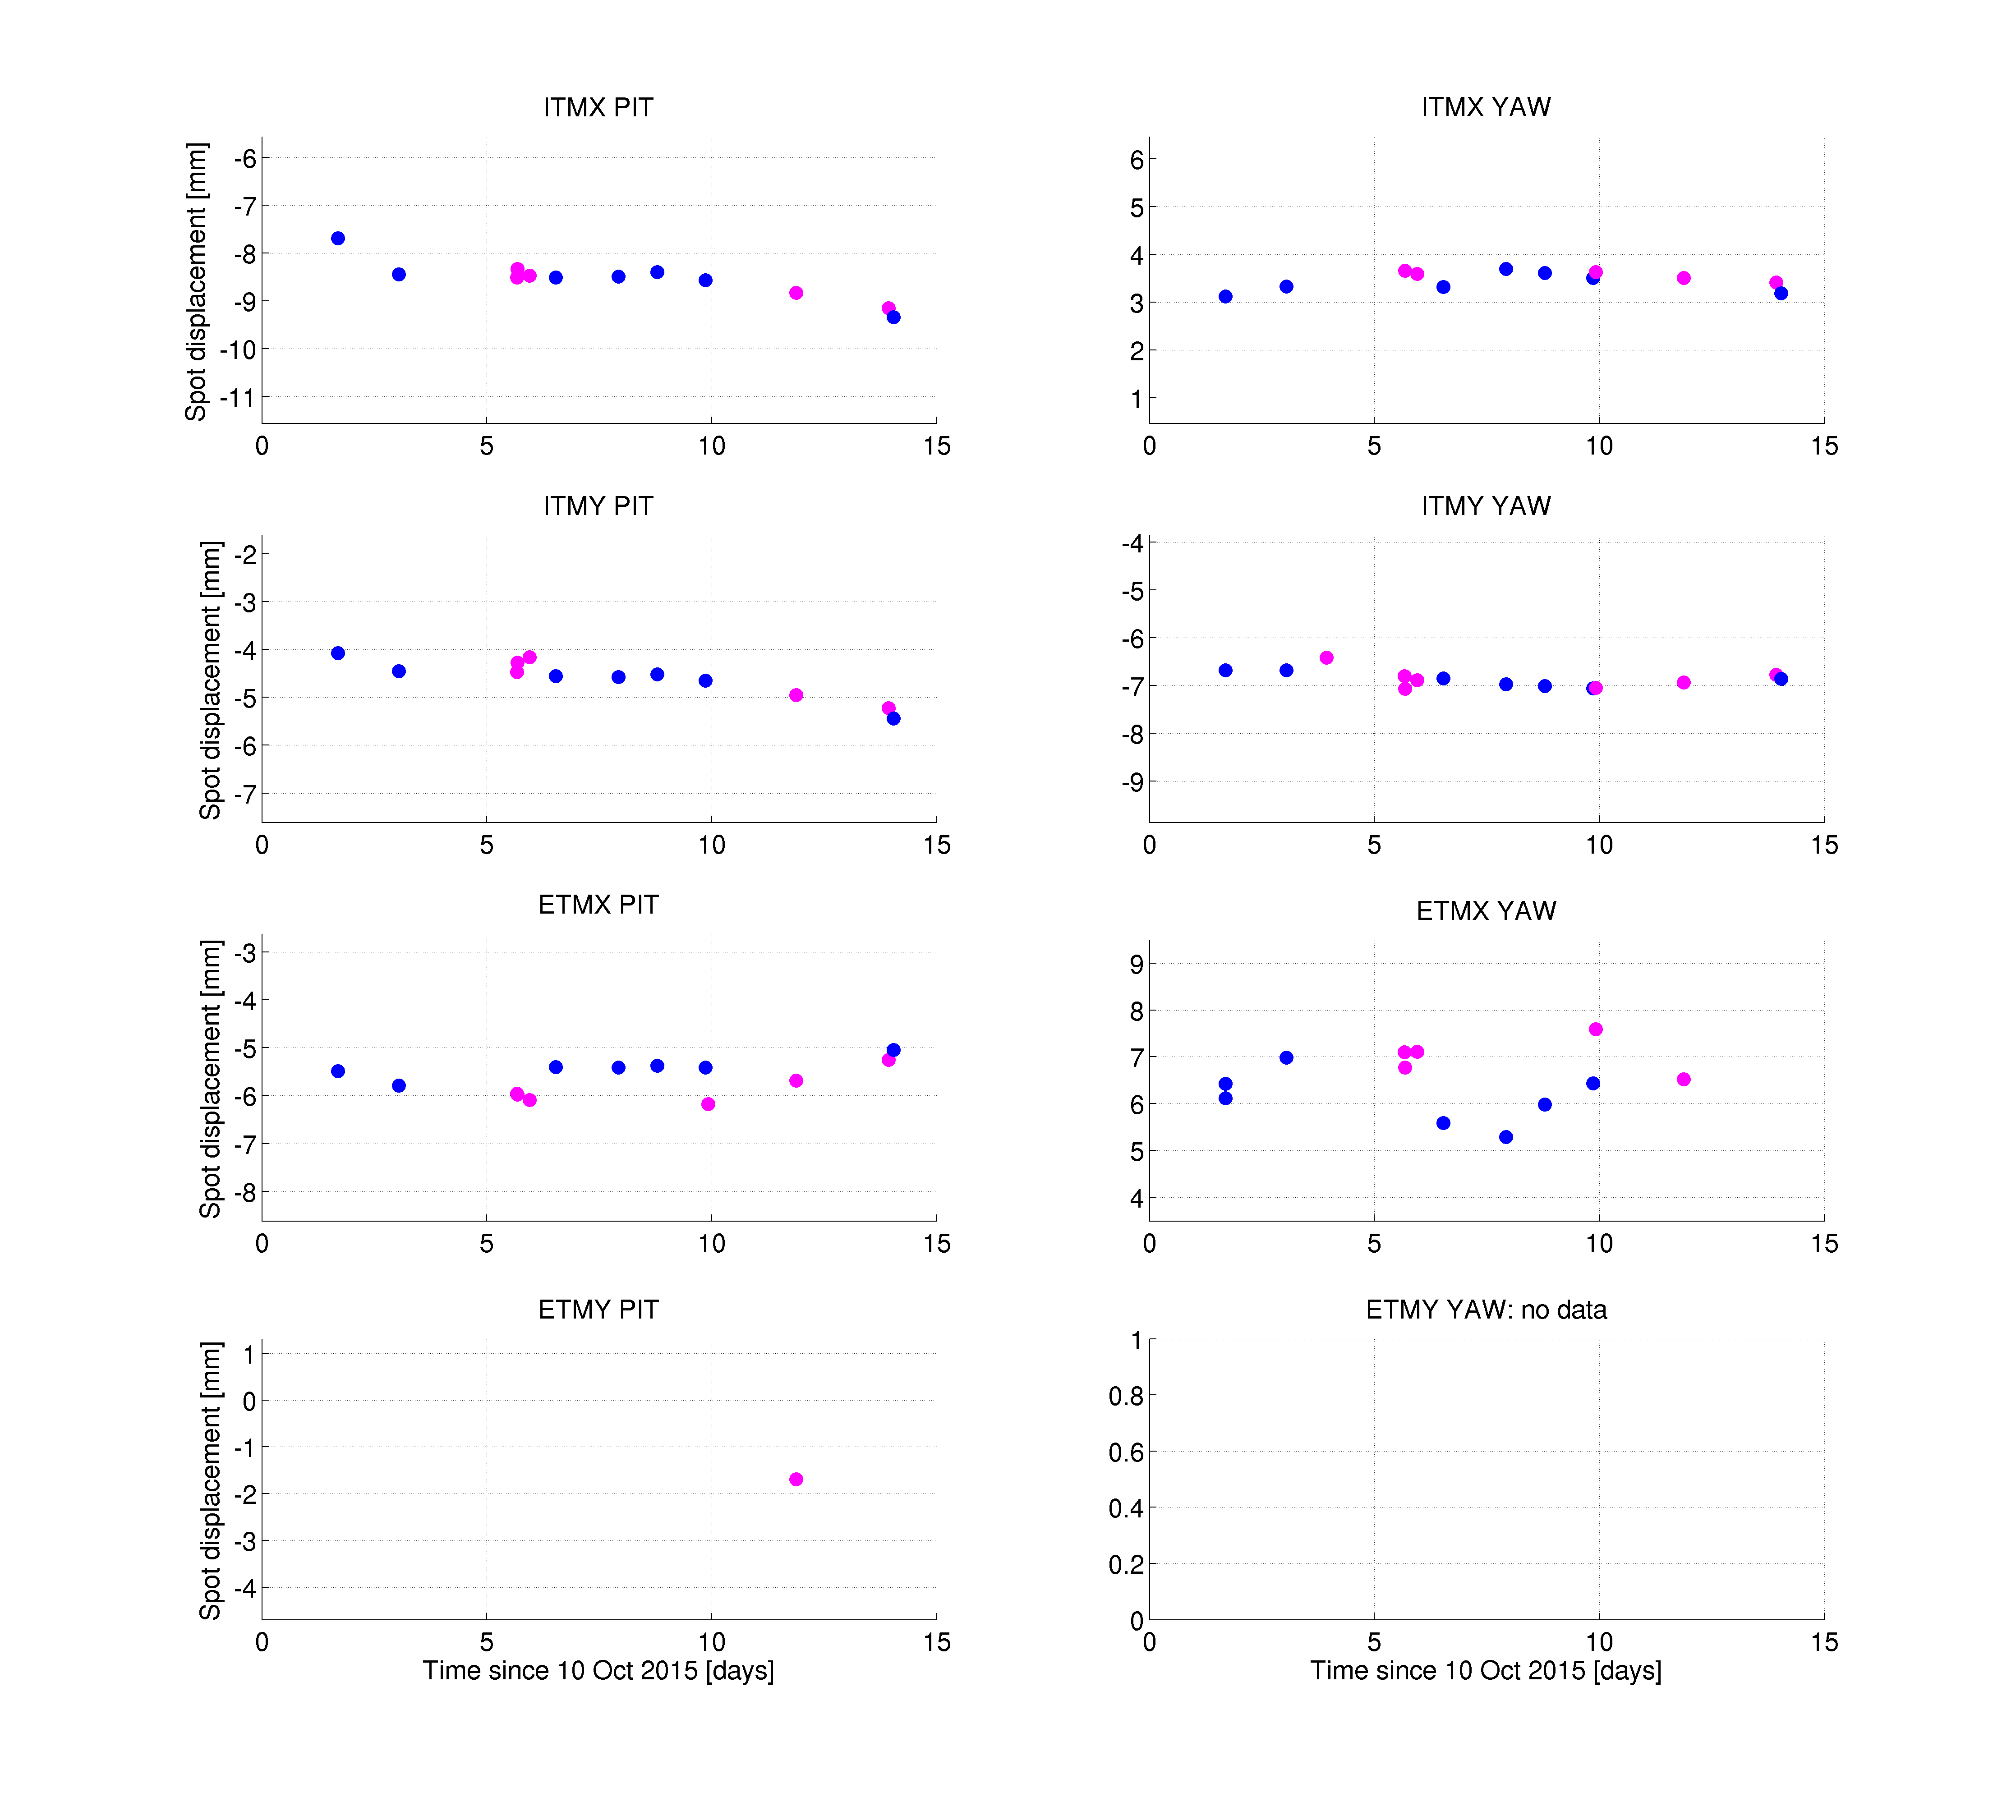
For all of the times that we have taken measurements, I also checked whether the IFO had been on for more than 30 minutes or not. In both plots below, the cold blue data points are times when the IFO had been at Nominal Low Noise for less than 30 minutes prior to the measurement, while the hot pink data points are times when the IFO had been at Nominal Low Noise for at least 30 minutes.
The first plot is all of the data points that I accepted, plotted versus time. This is perhaps somewhat confusing, but each of the y-axes are centered about the mean spot position for that optic and degree of freedom, plus or minus 3 mm. So, each y-axis has a range of 6mm, although they're all centered around different values.
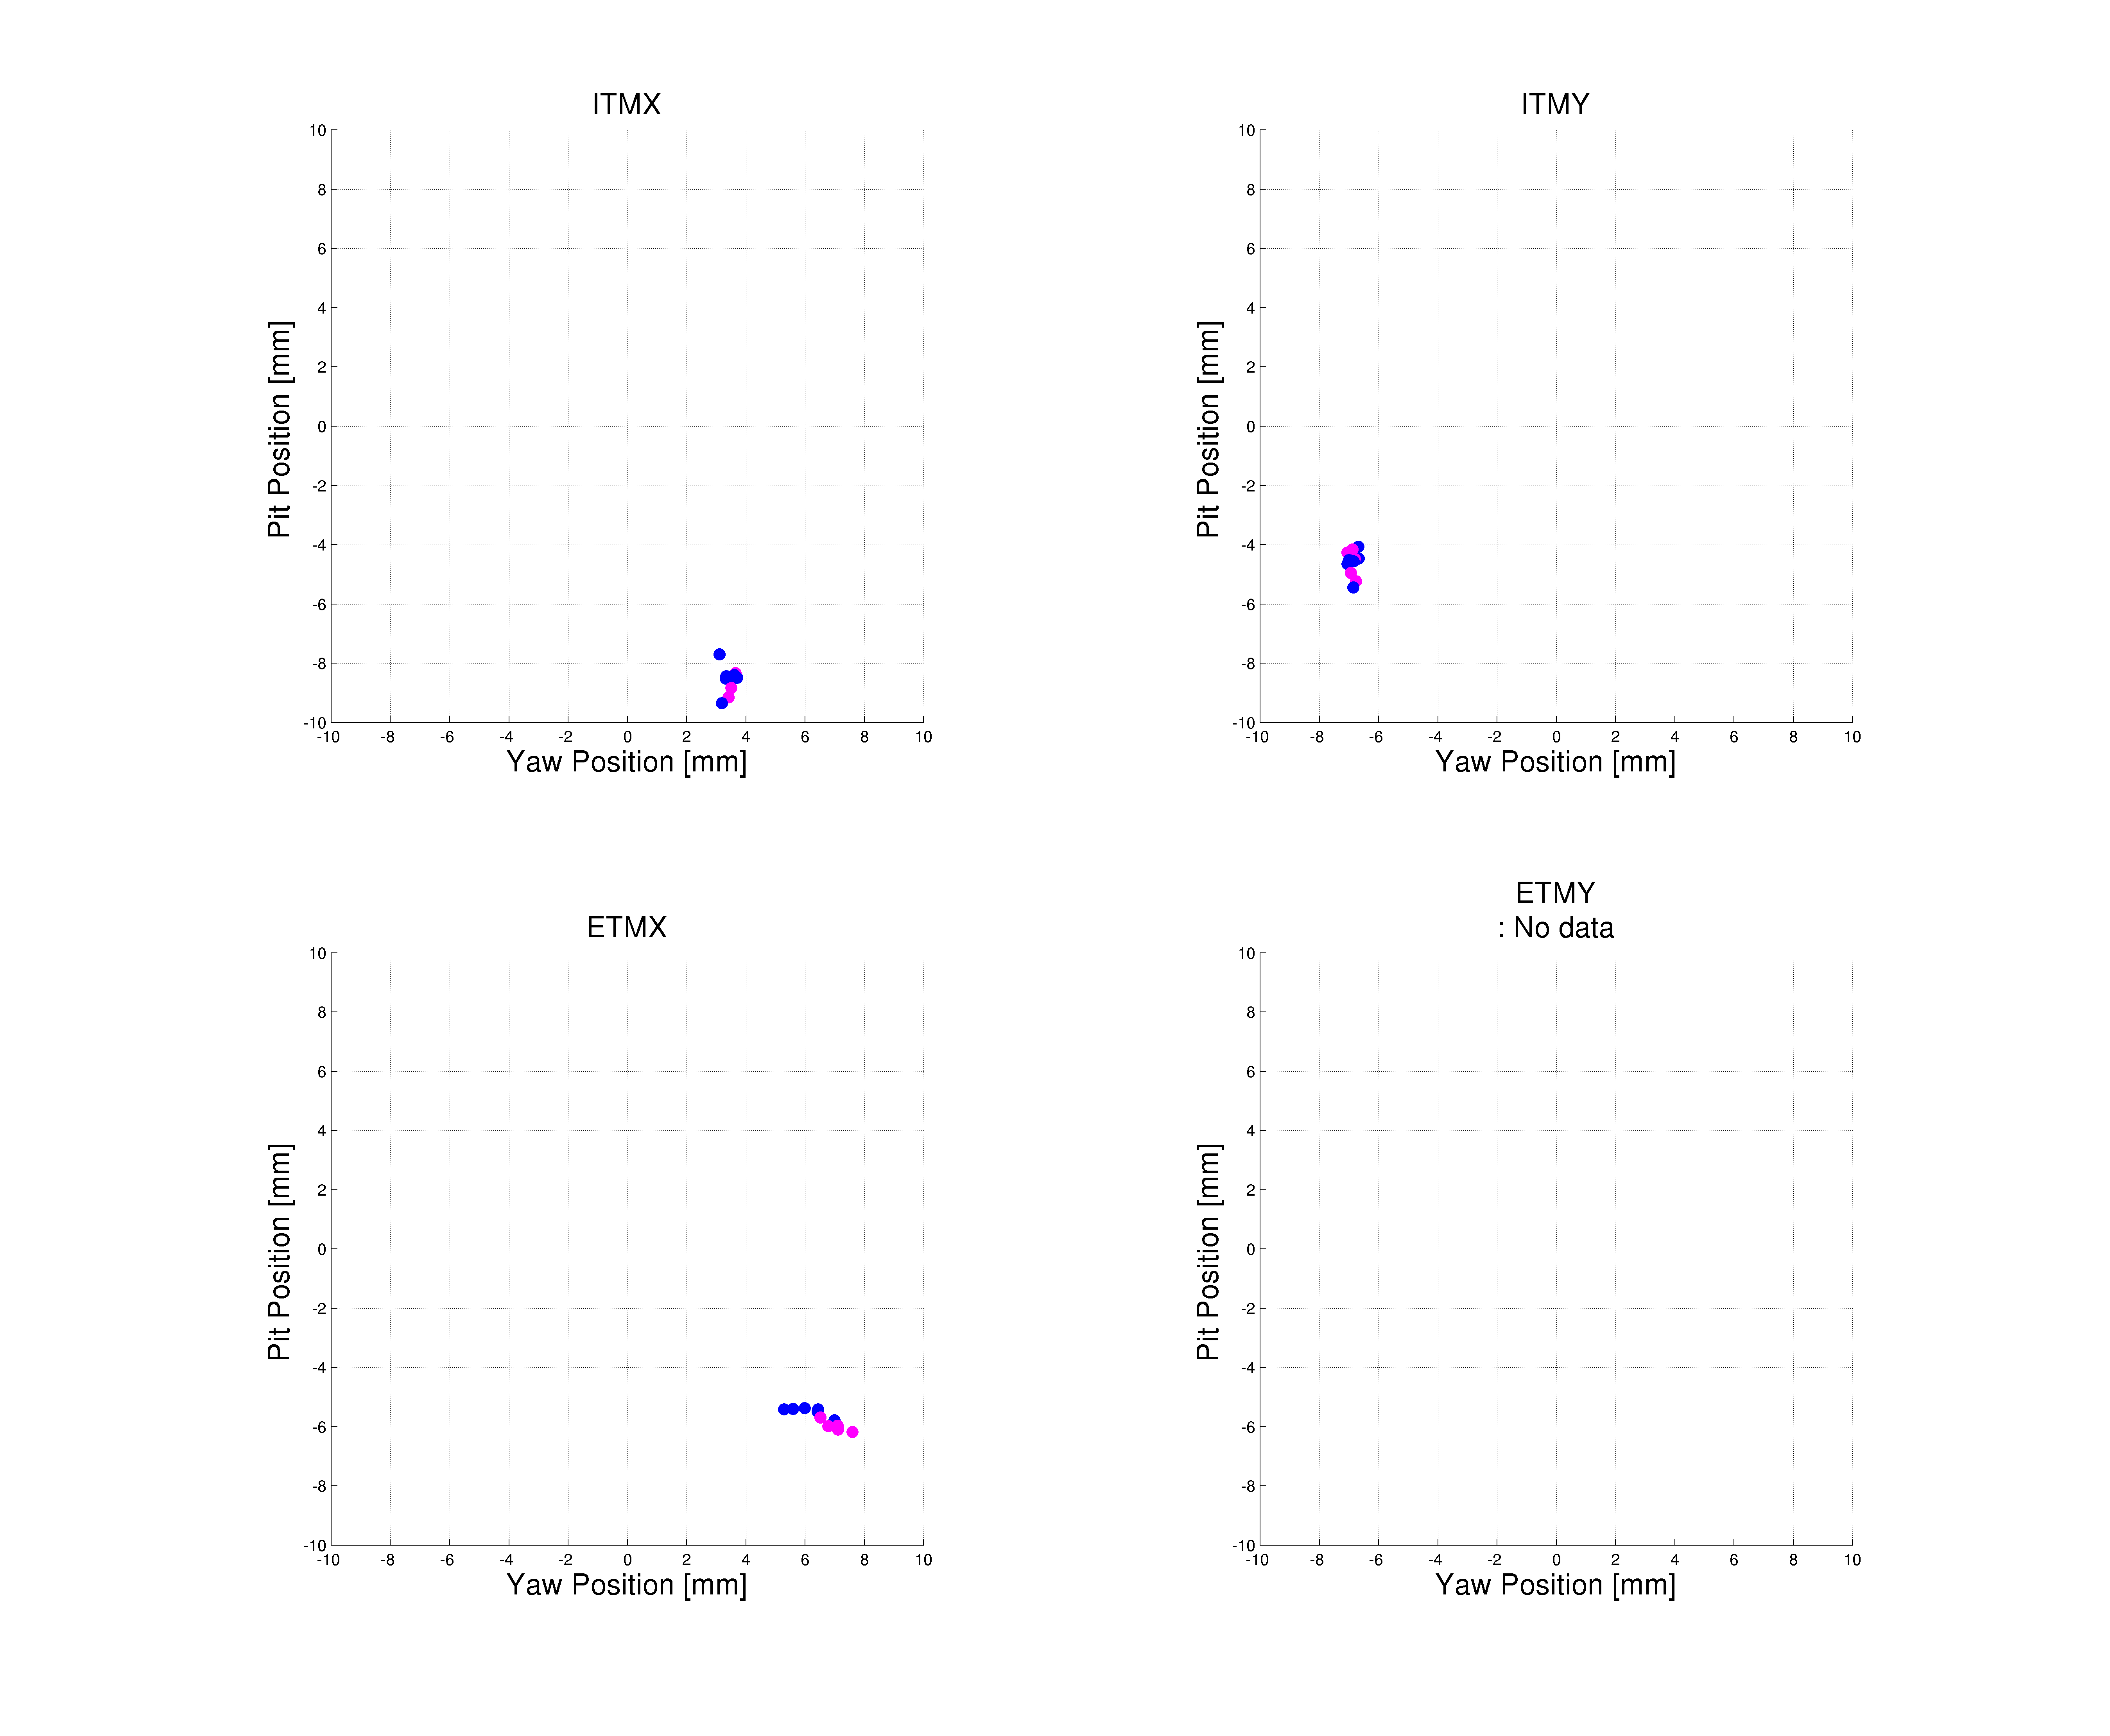
For the second plot, I find all the times that I have both acceptable pitch and yaw measurements, and plot the spots on a grid representing the face of the optic. Note that since I had zero acceptable ETMY Yaw data points, nothing is plotted for ETMY at all.
Interestingly, the ITM spots seem fairly consistent, regardless of how long the interferometer has been on, while the ETMX spots have a pretty clear trend of moving as the IFO heats up. None of our spots are moving more than +- 1.5 mm or so, so we are quite consistent.