keith.riles@LIGO.ORG - posted 20:05, Saturday 26 September 2015 - last comment - 10:13, Monday 02 November 2015(21982)
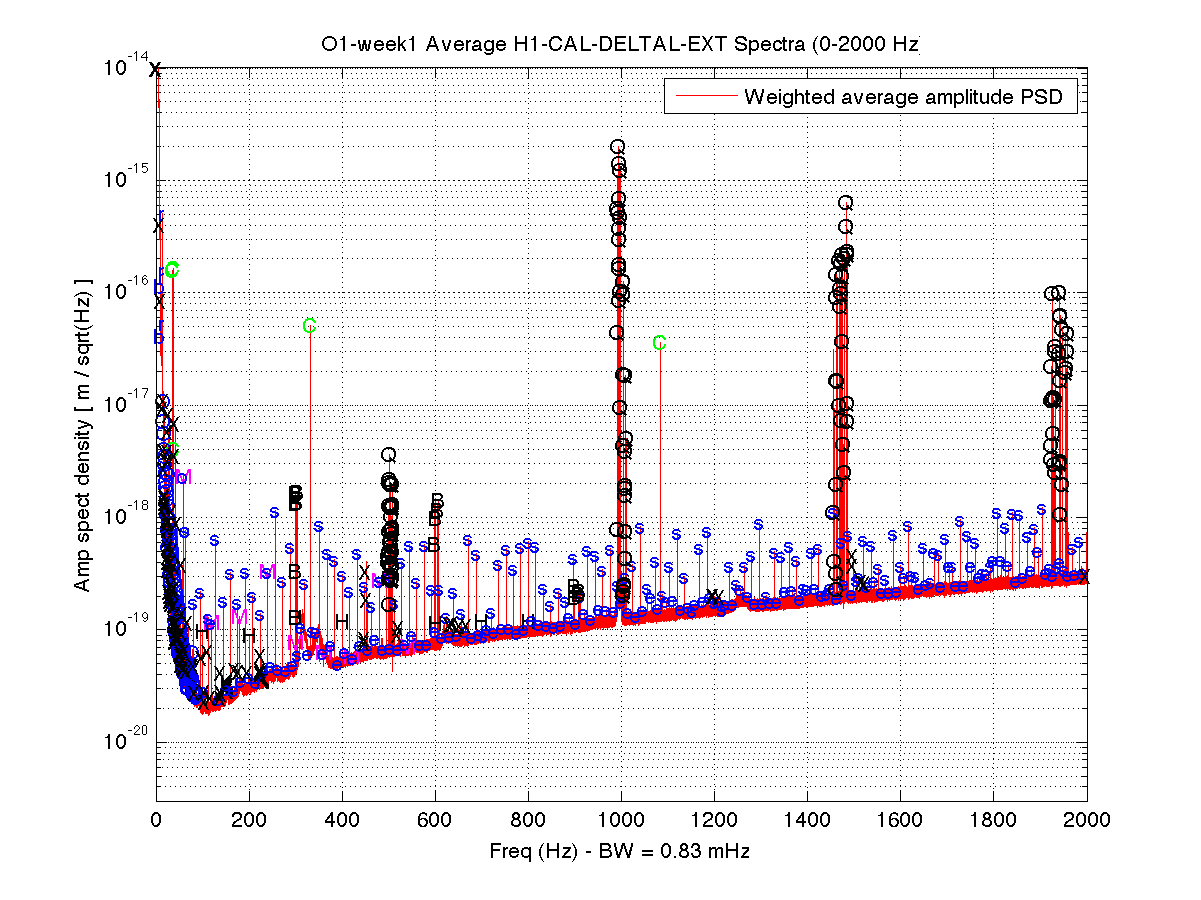
Narrow lines in H1 DARM in O1 week 1
Executive summary:
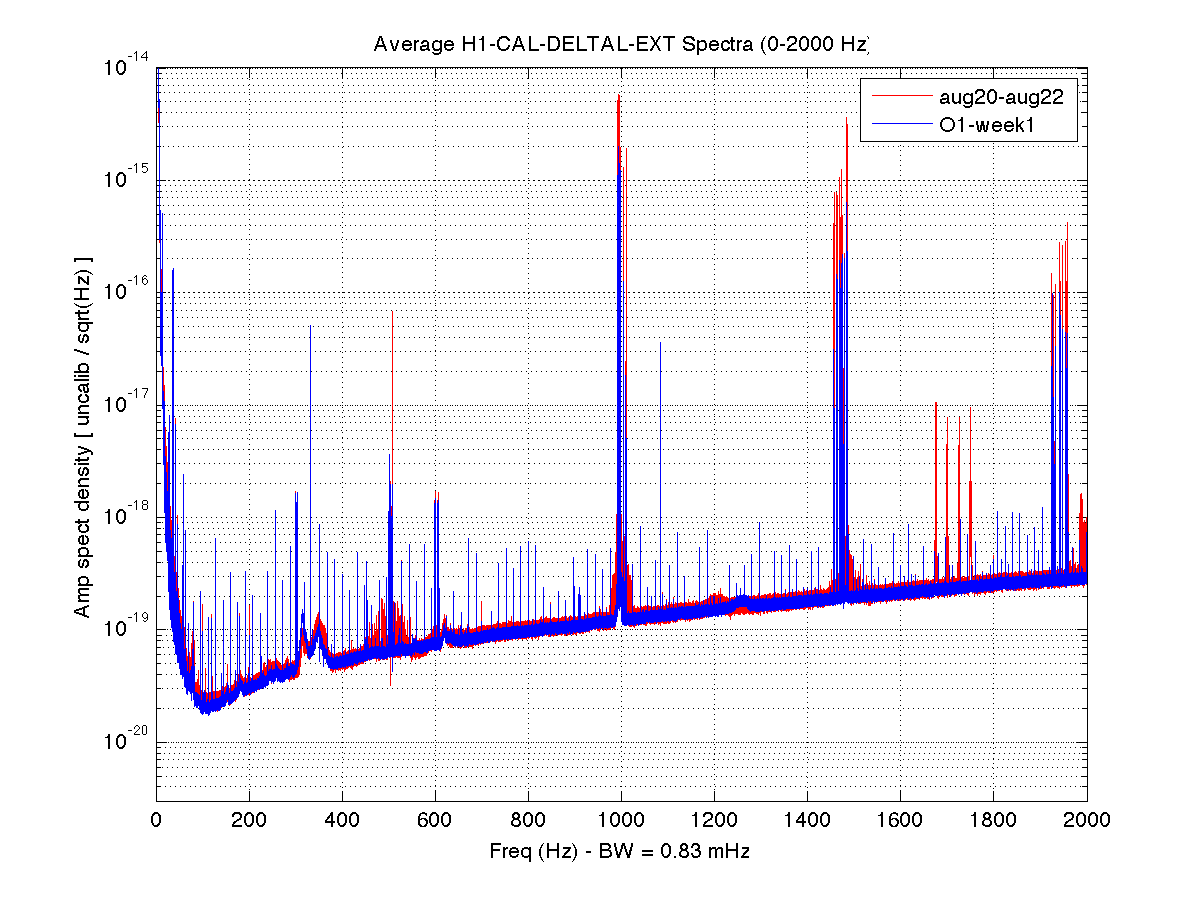
- In regard to narrow lines, early O1 data resembles early ER8 data: a pervasive 16-Hz comb persists throughout the CW search band (below 2000 Hz); there is a notable 1-Hz comb below 100 Hz (0.5-Hz offset); and other sporadic combs persist.
- On the other hand, there are distinct improvements: noise floor is cleaner nearly everywhere and substantially lower in the 10-70 Hz band; non-linear upconversion around quad violin modes and harmonics is much reduced; some combs and isolated lines have disappeared; and the OMC alignment dither frequencies have moved out of the CW search band (hurray!).
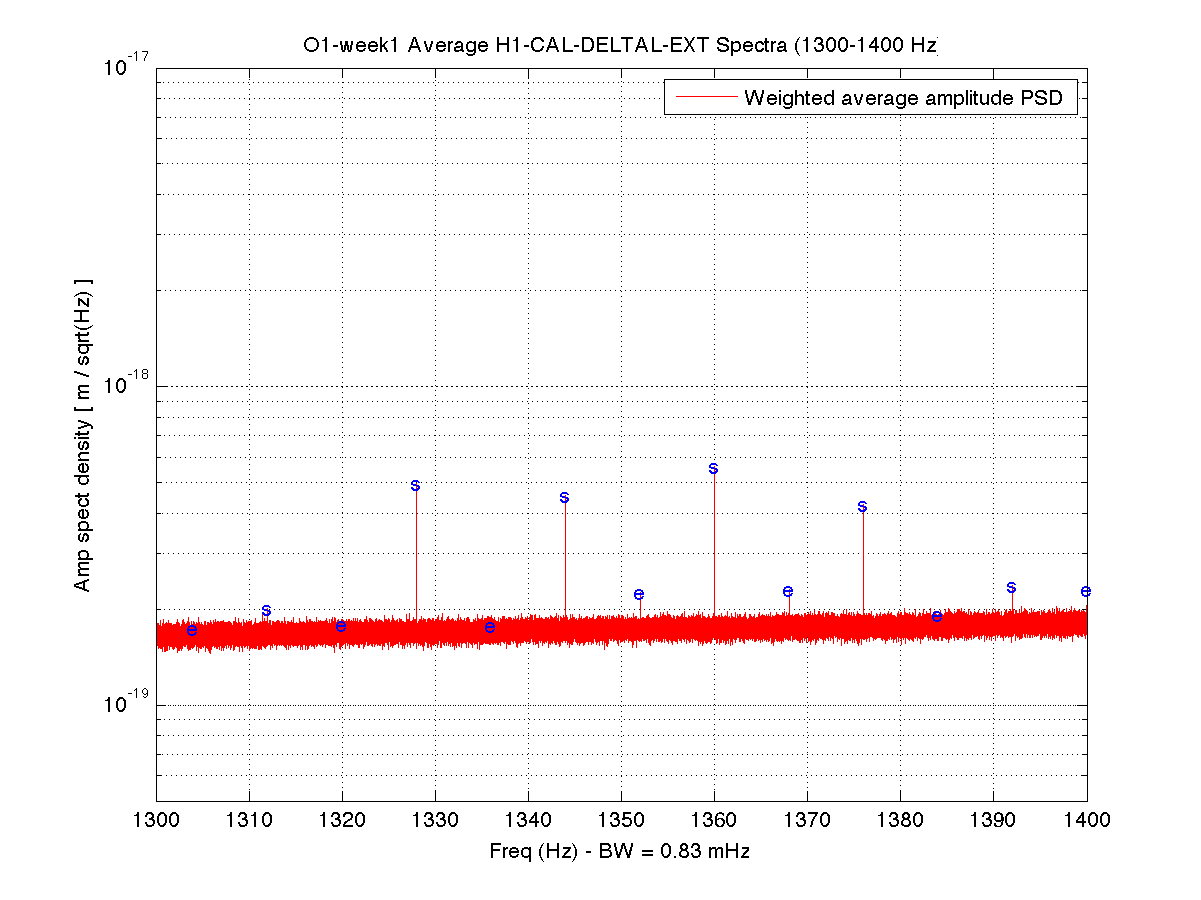
- Oh the third hand, new artifacts have appeared or strengthened: a sporadic 8-Hz comb suspected before is confirmed; a 1-Hz comb (no offset) has emerged below 70 Hz; a broad bulge appears in the 1240-1270 Hz band.
- A 16-Hz comb pervades the entire 0-2000 Hz band (and well beyond, based on daily FScans)
- A typically much weaker and sporadic 8-Hz comb (odd harmonics) is also pervasive - previously suspected, now confirmed (all harmonics are labeled in figures, even when not visible)
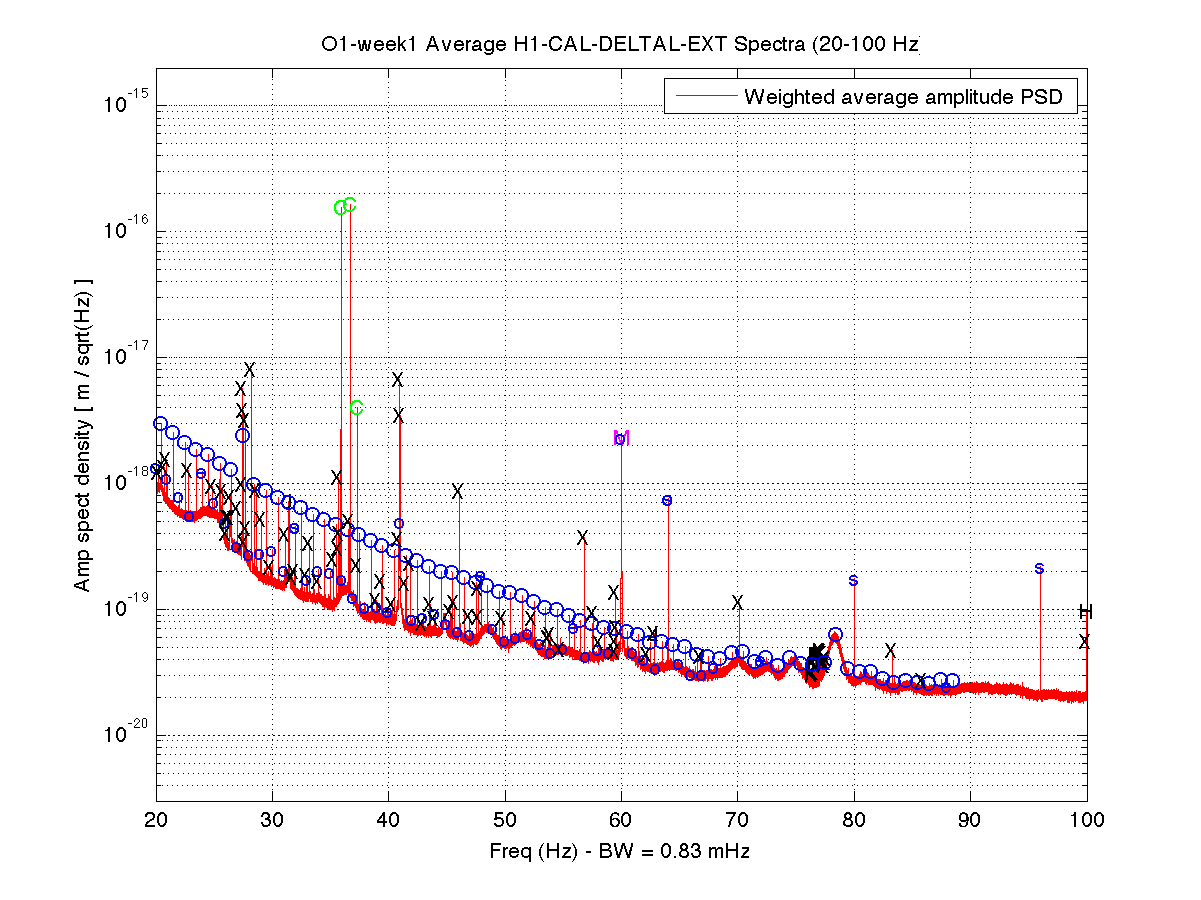
- A 1-Hz comb with a 0.5-Hz offset is visible from 15.5 Hz to 78.5 Hz (slightly wider span than before)
- A new 1-Hz with zero offset is visible from 20.0 Hz to 68.0 Hz
- A 99.9989-Hz comb is visible to its 8th harmonic (was previously visible to its 13th harmonic)
- The 60-Hz power mains comb is visible to its 5th harmonic (was previously visible to its 9th harmonic)
- There is a sporadic comb-on-comb with 0.088425-Hz fine spacing that appears with limited spans in three places near harmonics of 77, 154 and 231 Hz (ambiguity in precise fundamental frequency)
- There is a 31.4149-Hz comb visible to its 2nd harmonic
- The OMC alignment dithers have been moved to above 2000 Hz (thanks!)
- Upconversion around the quad violin modes and their harmonics is much reduced, although the strengths of the higher harmonics themselves remain high. To be more specific, the fundamental and higher harmonics of the upconversion itself (integer harmonics) due to the fundamental violin harmonics are highly suppressed, while the higher harmonics of the violin modes themselves (not integer harmonics) remain high.
- A number of previously seen combs are no longer apparent: 59.3155 Hz, 59.9392 Hz, 59.9954 Hz and 75.3 Hz
- A variety of single lines have disappeared, and new ones have appeared (see attached line list)
- Compared to early ER8 data, the noise floor is slightly lower in most of the band and significantly lower in the 10-70 Hz band, but there is a significant new bulge in the 1240-1270 Hz band
Images attached to this report
Non-image files attached to this report


Comments related to this report
A matlab file (37 MB) containing the averaged inverse-noise-weighted spectrum from the first week can be found here:

https://ldas-jobs.ligo.caltech.edu/~keithr/spectra/O1/H1_O1_week1_0-2000_Hz.mat

Because of the way multiple epochs are handled, the matlab variable structure is non-obvious.
Here is how to plot the full spectrum after loading the file:  semilogy(freqcommon,amppsdwt{1,1})
Keith has found:
"There is a sporadic comb-on-comb with 0.088425-Hz fine spacing that appears with limited spans in three places near harmonics of 77, 154 and 231 Hz (ambiguity in precise fundamental frequency)"

Using the coherence tool, we have seen coherence between h(t) and a number of auxiliary channels that shows this comb around 77 Hz. Seems to be around the input optics, in channels:
H1:PEM-CS_MAG_LVEA_INPUTOPTICS_Z_DQ
H1_SUS-ITMY_L1_WIT_L_DQ
H1:SUS-BS_M1_DAMP_L_IN1_DQ
H1_SUS-ITMY_L1_WIT_P_DQ
H1:SUS-BS_M1_DAMP_T_IN1_DQ
H1_SUS-ITMY_L1_WIT_Y_DQ
H1:SUS-BS_M1_DAMP_V_IN1_DQ
H1_SUS-ITMY_L2_WIT_L_DQ
H1:SUS-BS_M1_DAMP_Y_IN1_DQ
H1_SUS-ITMY_L2_WIT_Y_DQ

See the attached figures.

Nelson, Soren Schlassa, Nathaniel Strauss, Michael Coughlin, Eric Coughlin, Pat Meyers
Images attached to this comment
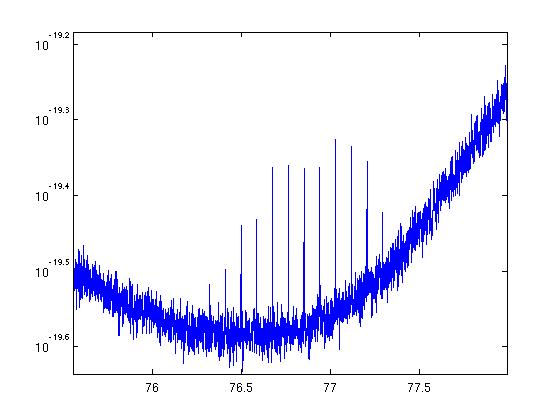
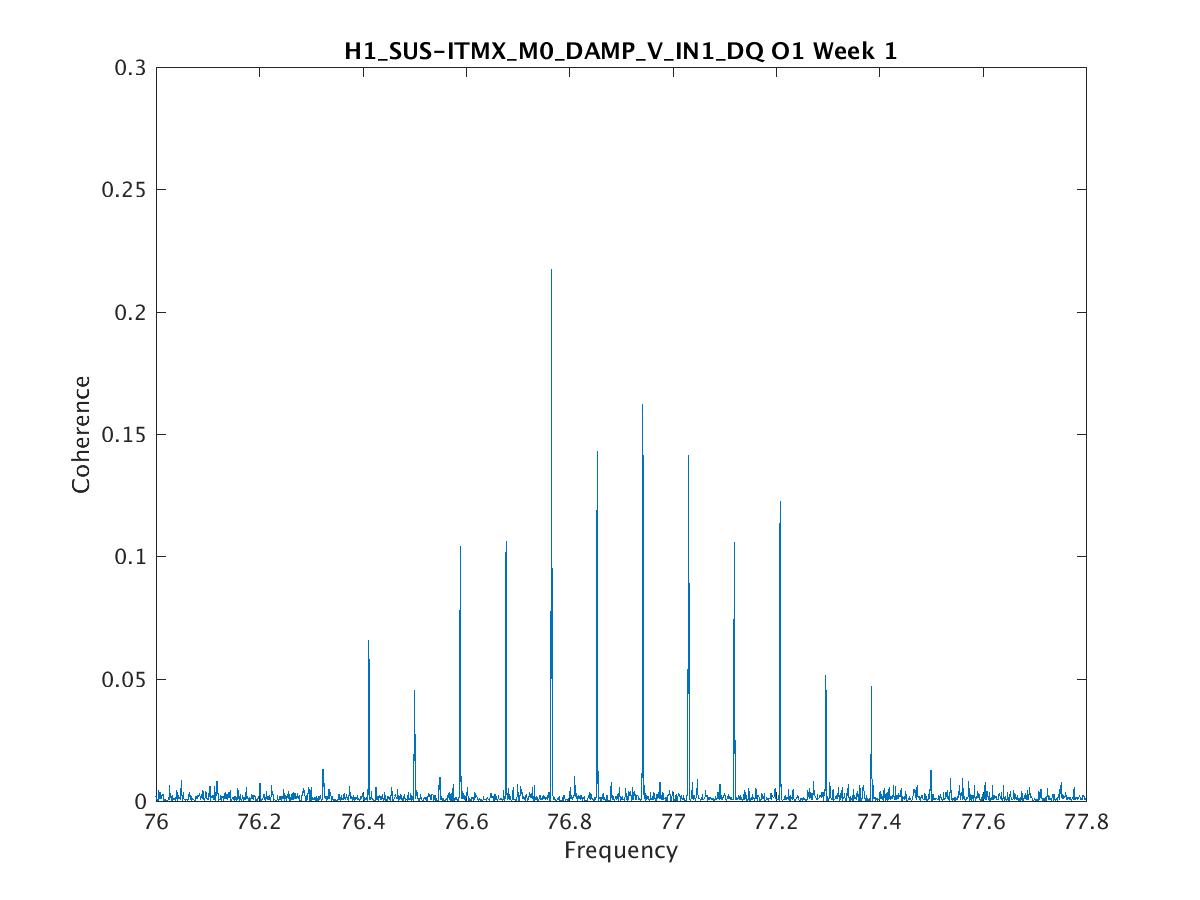
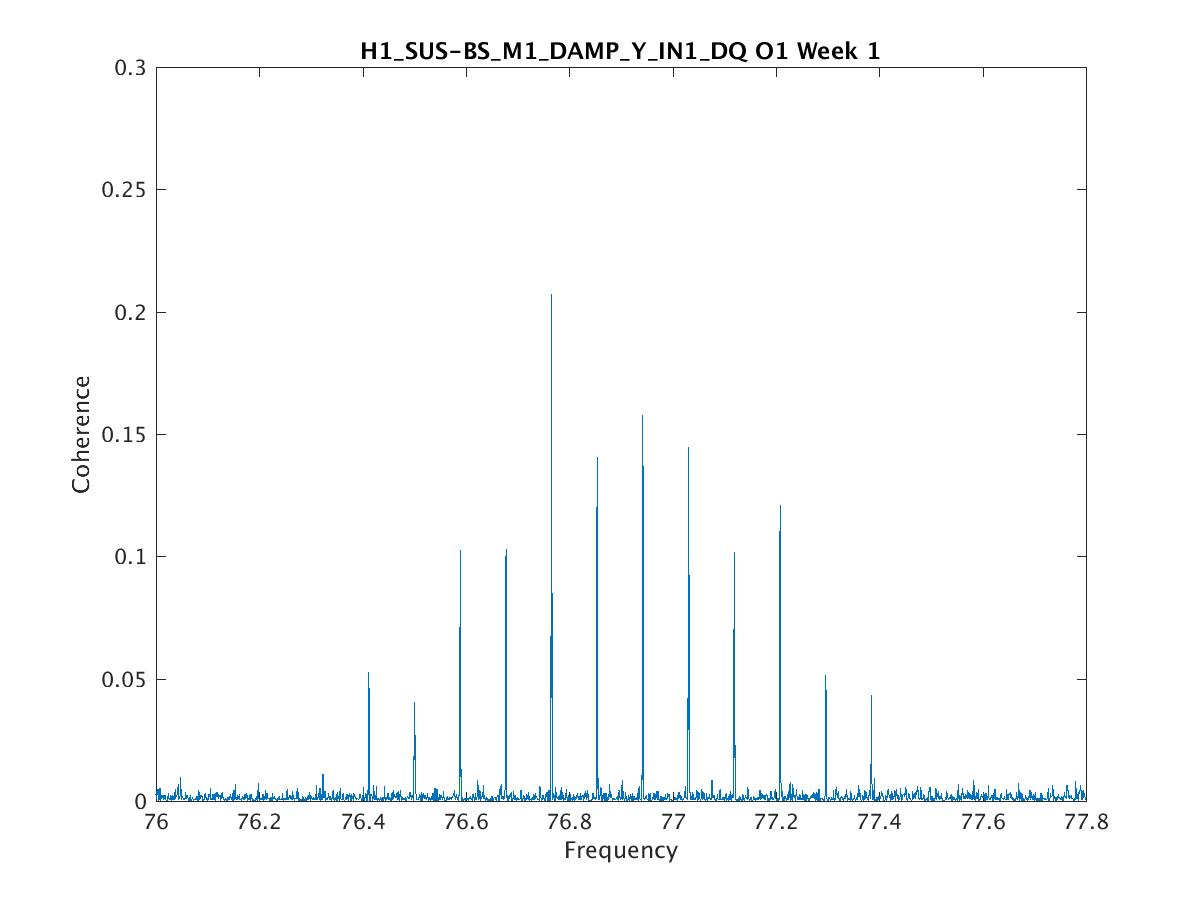
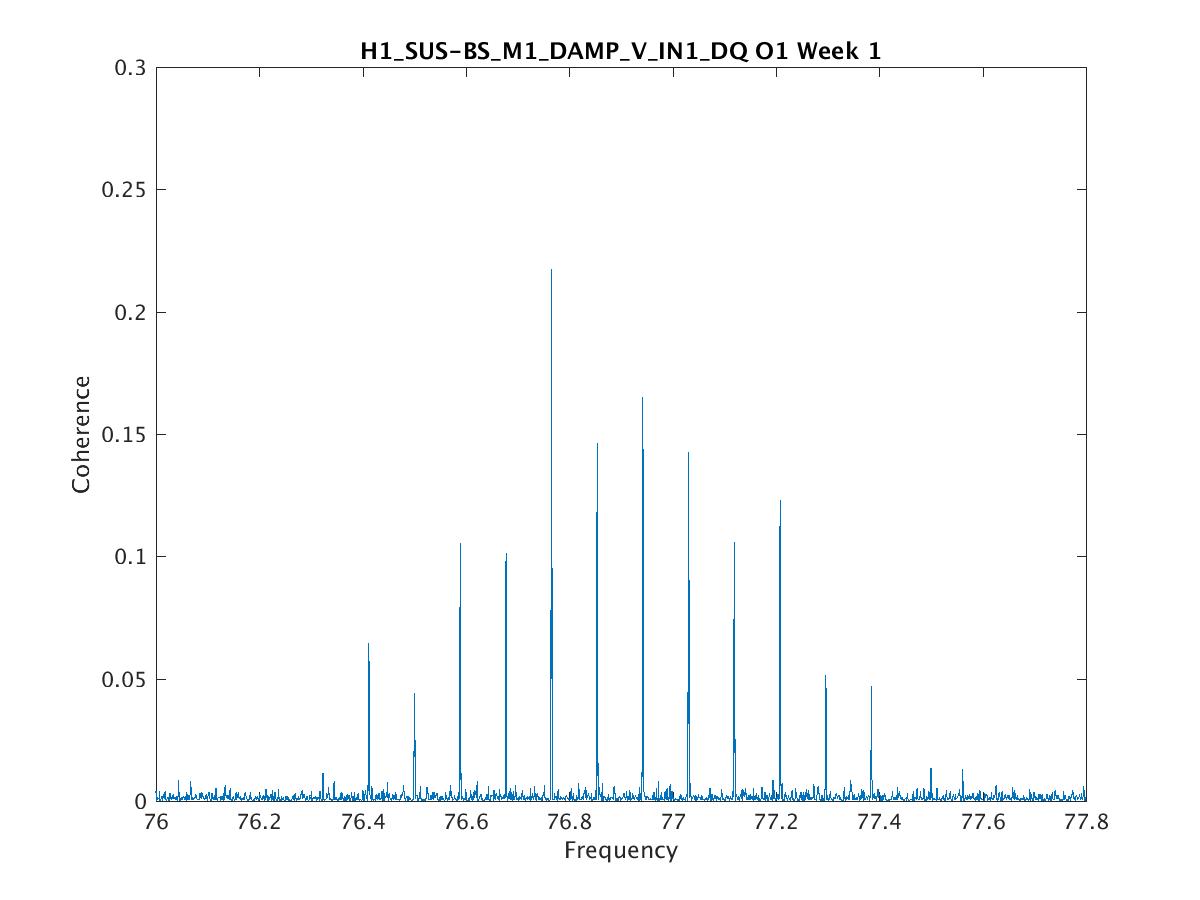
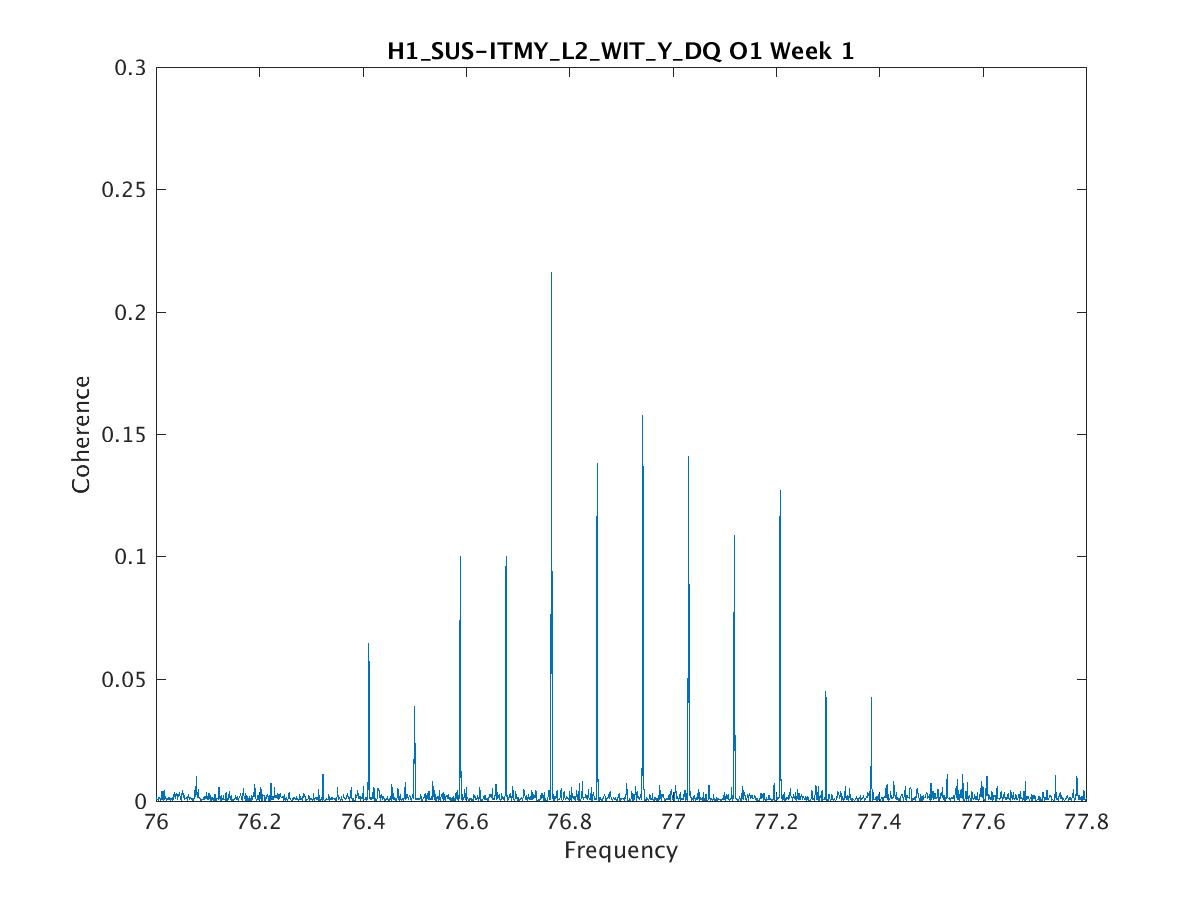
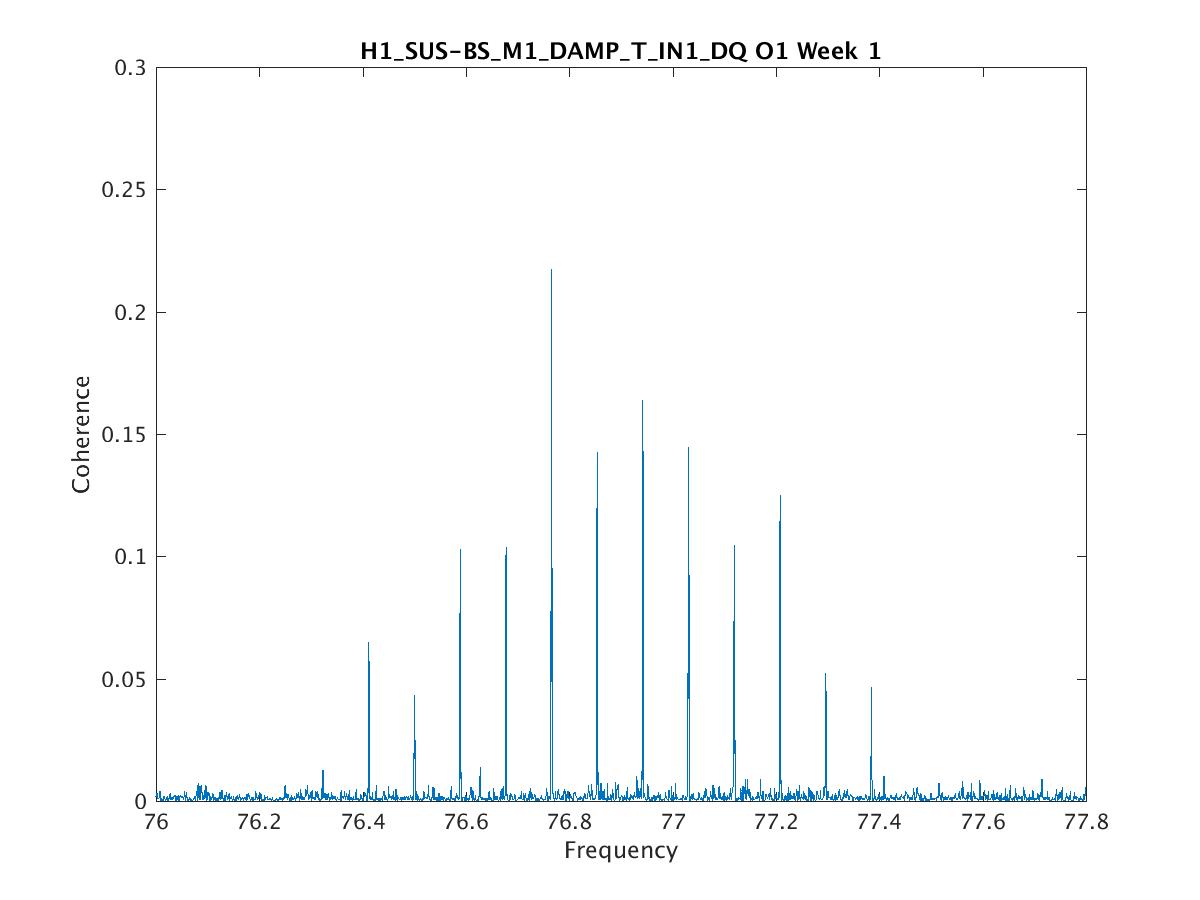
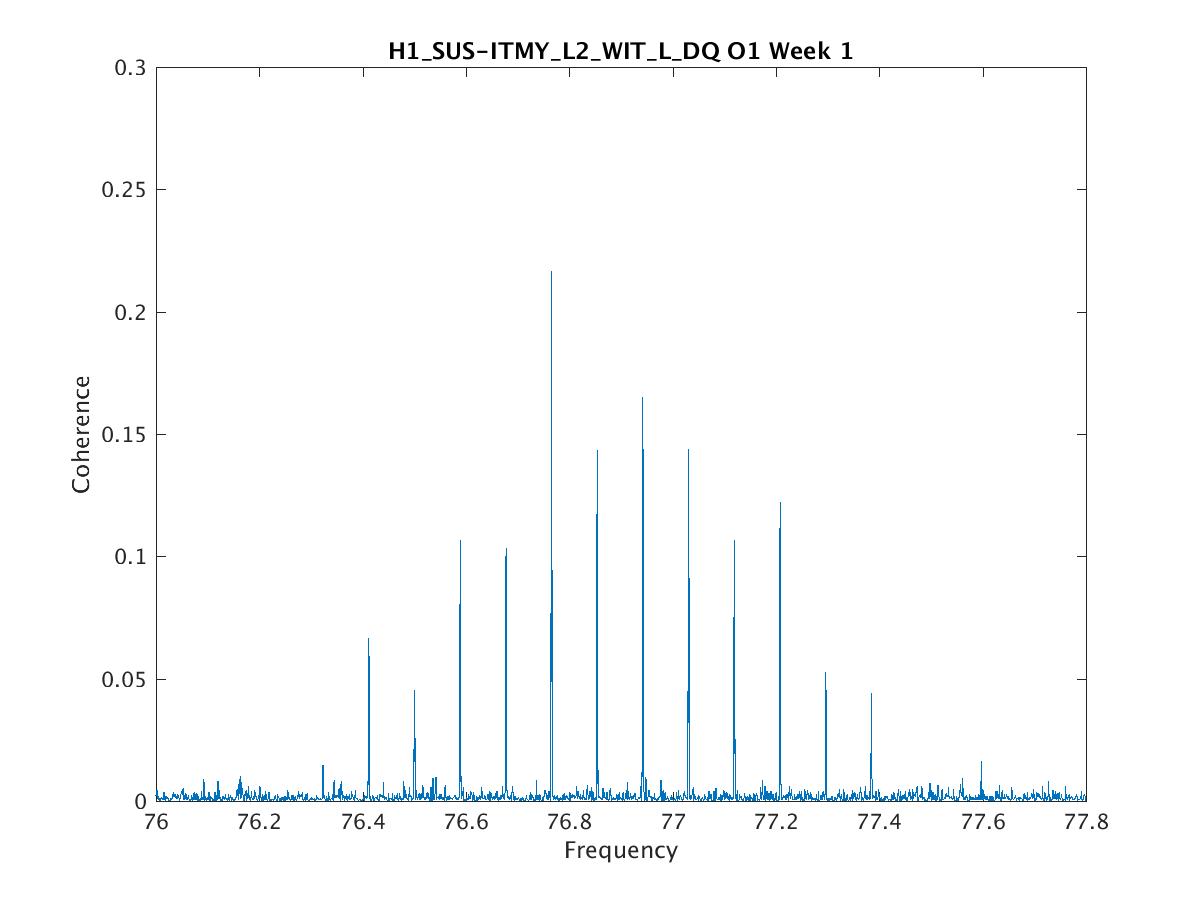
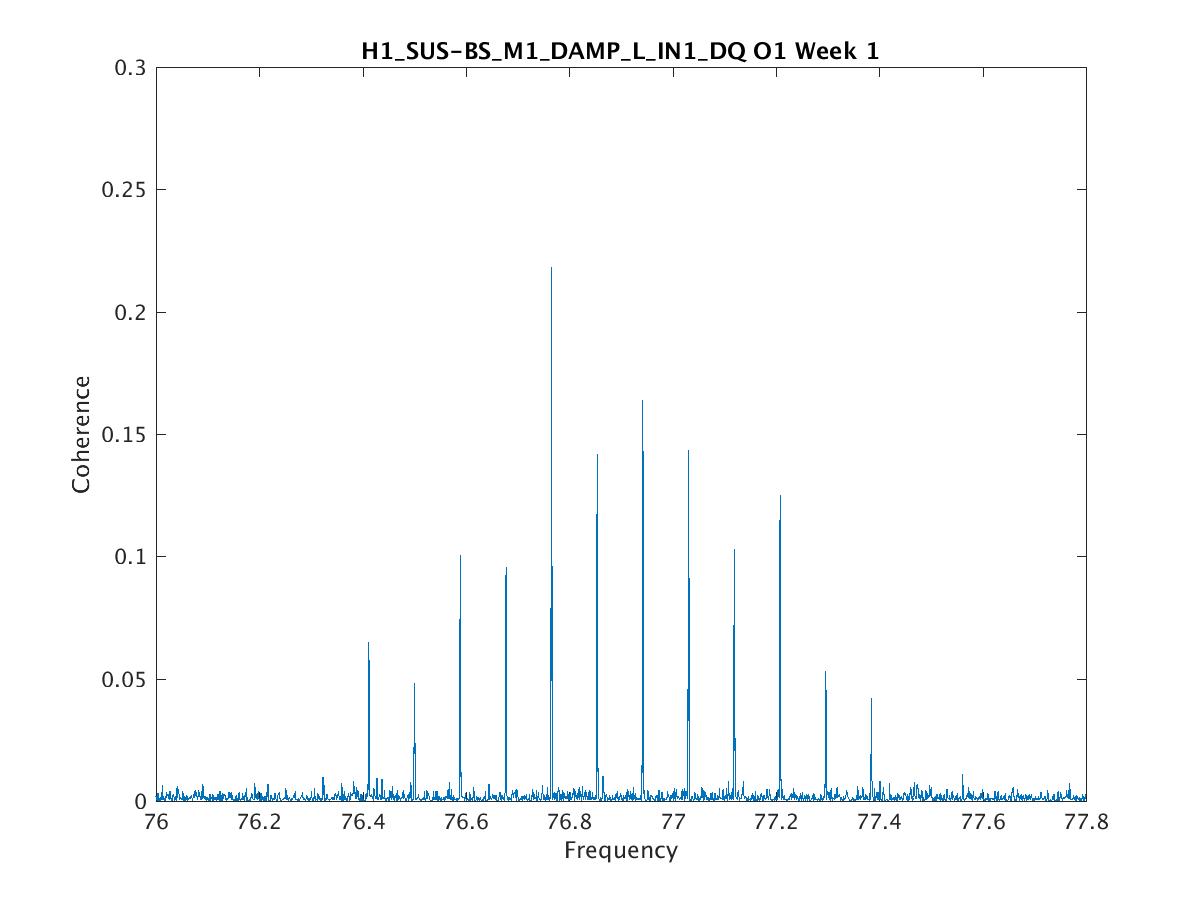
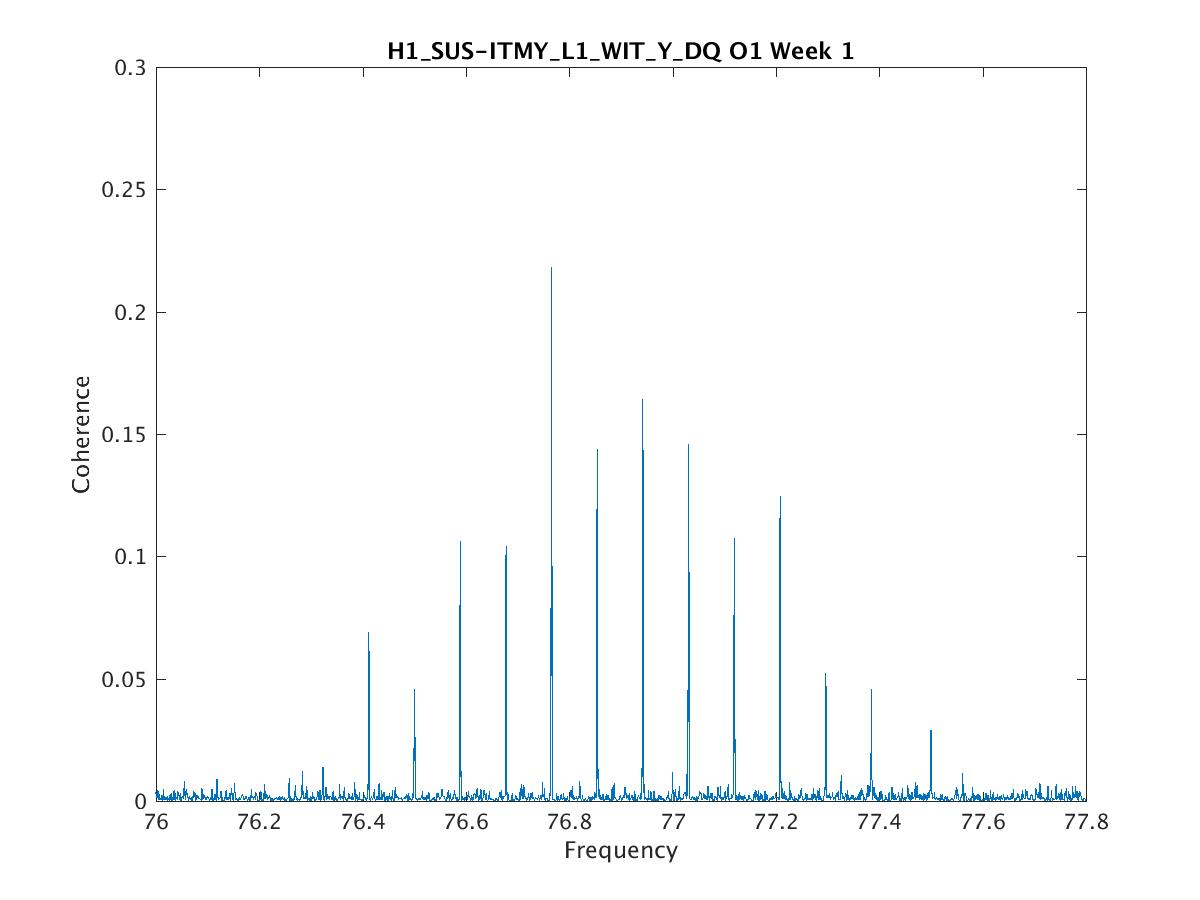
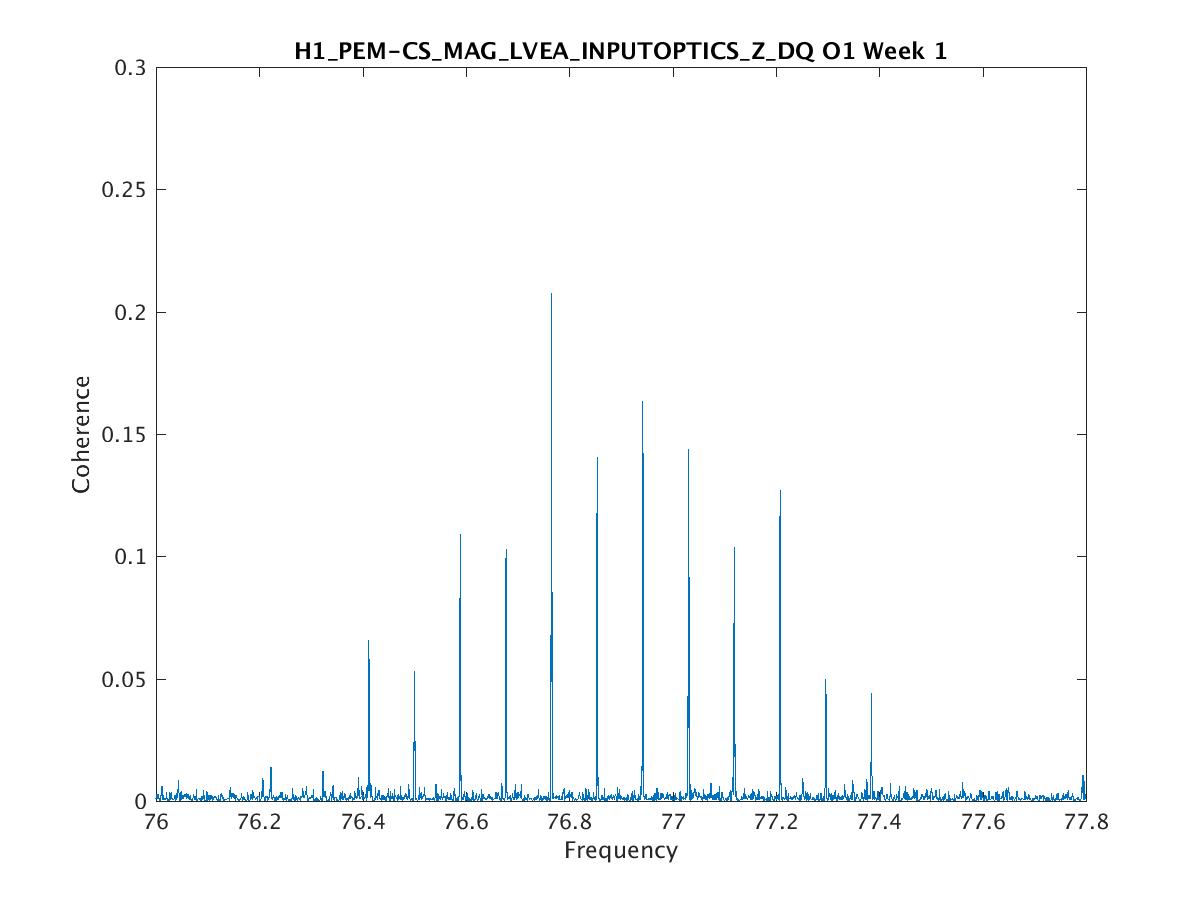
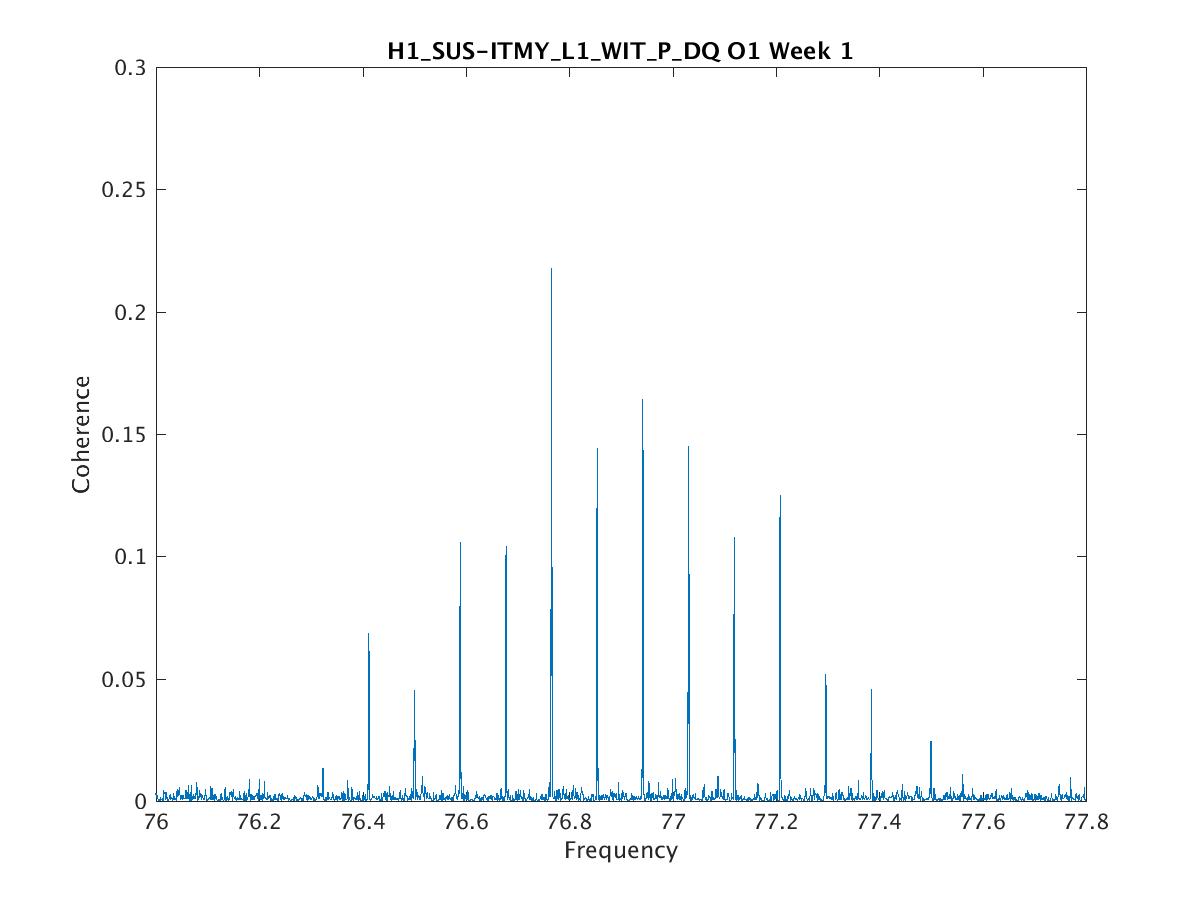
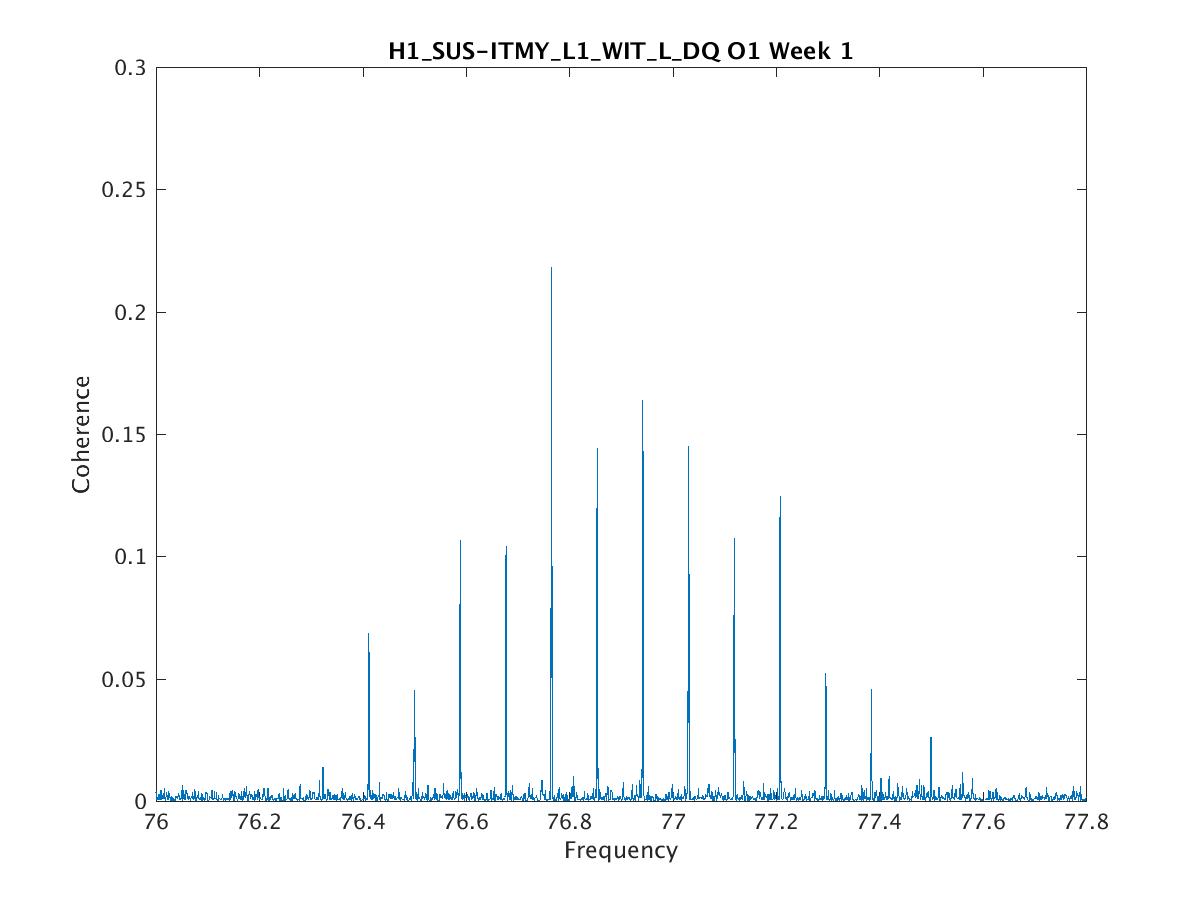
The structure at 76.4Hz Nelson listed some channels for above shows up in at least 50 other channels.

Greatest coherence is consistently at 76.766 Hz, second greatest is (mostly) consistently at 76.854Hz.

Spacing between the two combs is about 0.0013Hz.

The epicenter seems to be the INPUTOPTICS/the SUS-BS and SUS-ITM* channels, like Nelson said (see below for fuller list).

The plots above are pretty typical, but I have plots for all channels listed and can post any more that are useful. Most or all channels showing the comb with max coherence greater than 0.1 are listed below. Max coherences over 0.2 are marked below as strong, and max coherences under 0.15 as weak. Those marked strongest are around 0.22. I haven't included anything of max coherence <0.1 but I'm sure there are many.

H1:ASC-AS_A_RF36_I_PIT_OUT_DQ (weak)
H1:ASC-AS_A_RF36_I_YAW_OUT_DQ
H1:ASC-AS_A_RF36_Q_PIT_OUT_DQ
H1:ASC-AS_A_RF36_Q_YAW_OUT_DQ (weak)
H1:ASC-AS_B_RF36_I_YAW_OUT_DQ
H1:ASC-AS_B_RF36_Q_YAW_OUT_DQ (strong)
H1:ISI-BS_ST2_BLND_RZ_GS13_CUR_IN1_DQ (strong)
H1:ISI-BS_ST2_BLND_Z_GS13_CUR_IN1_DQ (strong)
H1:ISI-HAM2_BLND_GS13RZ_IN1_DQ
H1:ISI-HAM2_BLND_GS13Z_IN1_DQ
H1:ISI-HAM3_BLND_GS13Z_IN1_DQ (strong)
H1:ISI-HAM5_BLND_GS13RZ_IN1_DQ
H1:ISI-HAM5_BLND_GS13Z_IN1_DQ
H1:ISI-HAM6_BLND_GS13RZ_IN1_DQ
H1:ISI-ITMX_ST2_BLND_RX_GS13_CUR_IN1_DQ (weak)
H1:ISI-ITMX_ST2_BLND_Z_GS13_CUR_IN1_DQ (strong)
H1:ISI-ITMY_ST1_BLND_RZ_T240_CUR_IN1_DQ (weak)
H1:ISI-ITMY_ST1_BLND_Y_T240_CUR_IN1_DQ (weak)
H1:ISI-ITMY_ST2_BLND_RZ_GS13_CUR_IN1_DQ (strong)
H1:ISI-ITMY_ST2_BLND_Z_GS13_CUR_IN1_DQ (strong)
H1:LSC-PRCL_IN1_DQ
H1:PEM-CS_LOWFMIC_LVEA_VERTEX_DQ (strong)
H1:PEM-CS_MAG_LVEA_INPUTOPTICS_Y_DQ (strongest)
H1:PEM-CS_MAG_LVEA_INPUTOPTICS_Z_DQ (strong)
H1:SUS-BS_M1_DAMP_L_IN1_DQ (strongest)
H1:SUS-BS_M1_DAMP_T_IN1_DQ (strong)
H1:SUS-BS_M1_DAMP_V_IN1_DQ (strong)
H1:SUS-BS_M1_DAMP_Y_IN1_DQ (strong)
H1:SUS-ITMX_M0_DAMP_R_IN1_DQ (strong)
H1:SUS-ITMX_M0_DAMP_V_IN1_DQ (strong)
H1:SUS-ITMY_L1_WIT_L_DQ (strong)
H1:SUS-ITMY_L1_WIT_P_DQ (strong)
H1:SUS-ITMY_L1_WIT_Y_DQ (strong)
H1:SUS-ITMY_L2_WIT_L_DQ (strong)
H1:SUS-ITMY_L2_WIT_P_DQ (strong)
H1:SUS-ITMY_L2_WIT_Y_DQ (strong)
H1:SUS-MC1_M3_WIT_L_DQ
H1:SUS-MC1_M3_WIT_P_DQ (weak)
H1:SUS-MC2_M1_DAMP_L_IN1_DQ
H1:SUS-MC2_M1_DAMP_T_IN1_DQ
H1:SUS-MC2_M1_DAMP_Y_IN1_DQ
H1:SUS-PR2_M1_DAMP_P_IN1_DQ
H1:SUS-PR2_M1_DAMP_R_IN1_DQ
H1:SUS-PR2_M1_DAMP_V_IN1_DQ
H1:SUS-PR2_M3_WIT_L_DQ
H1:SUS-PR2_M3_WIT_P_DQ (weak)
H1:SUS-PR2_M3_WIT_Y_DQ (weak)
H1:SUS-PR3_M1_DAMP_P_IN1_DQ
H1:SUS-PR3_M1_DAMP_V_IN1_DQ
H1:SUS-PRM_M1_DAMP_L_IN1_DQ (strongest)
H1:SUS-PRM_M1_DAMP_T_IN1_DQ
H1:SUS-PRM_M1_DAMP_Y_IN1_DQ (strong)
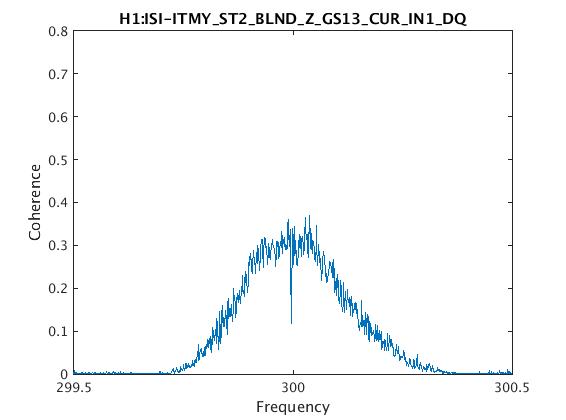
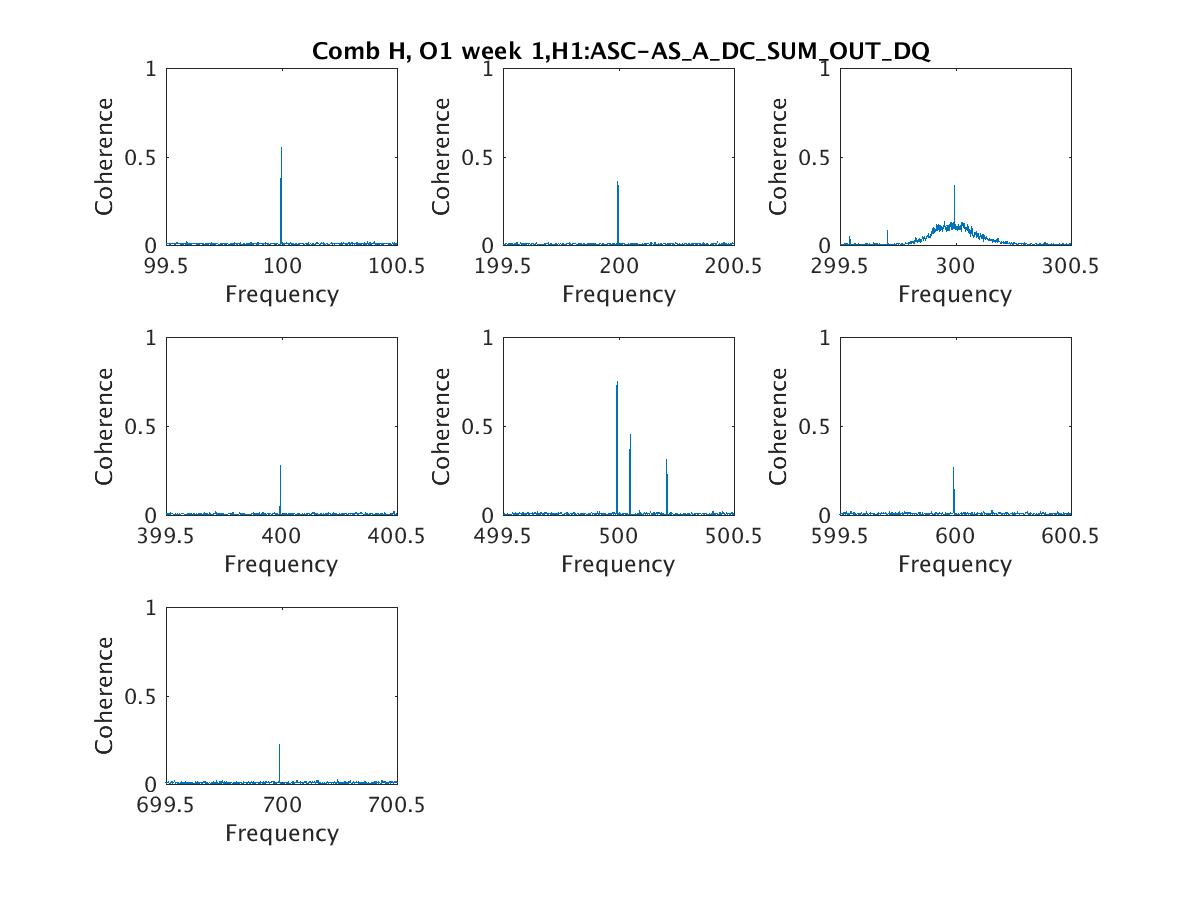
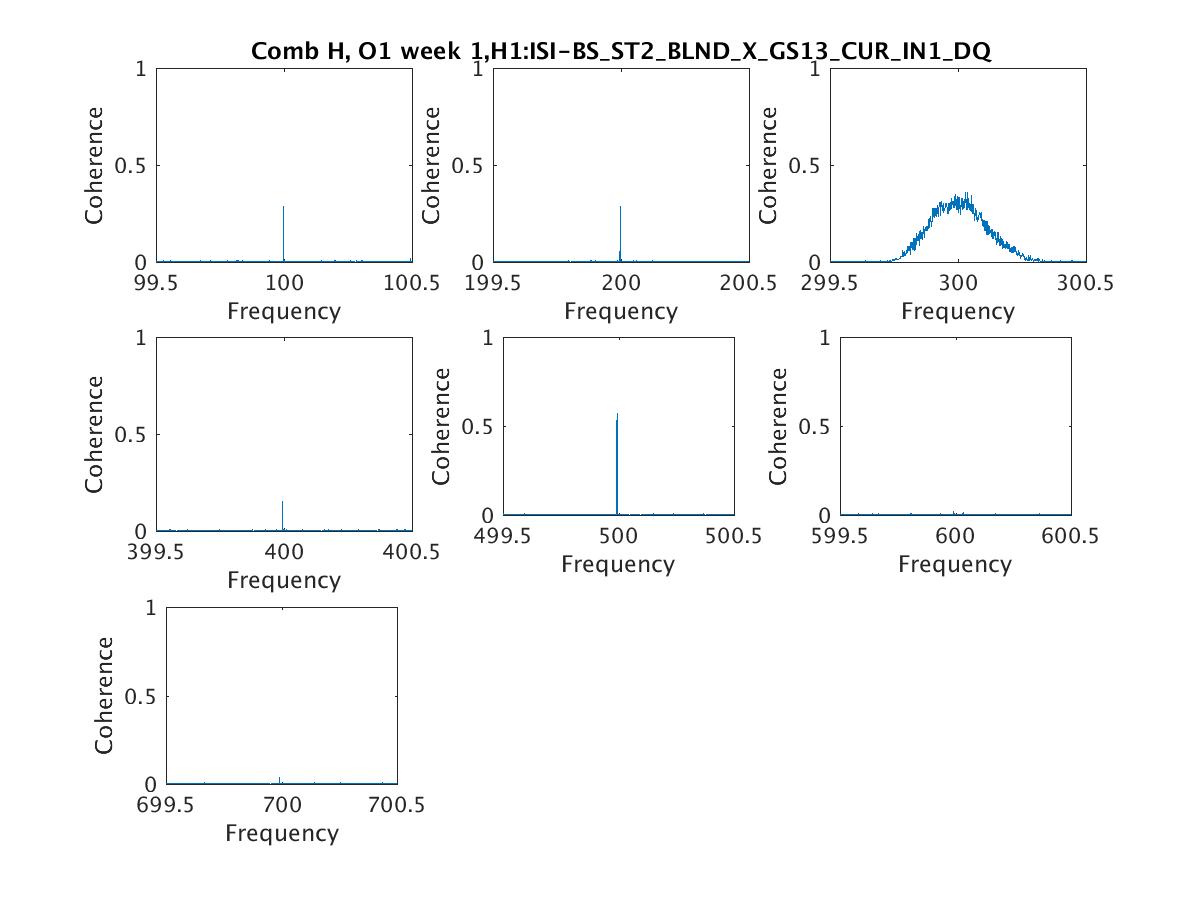
The 99.9989Hz comb Keith found (designated H) appears in 109 channels (list is attached). Coherence is uniformly greatest at the ~500Hz harmonic, with many channels approaching .7 and greater, drops off sharply at the ~600Hz and ~700Hz, and is invisible after 700. (See spreadsheet titled "comb_H_sigcohs_wk1.xslx" for a list of cohering channels by line, with coherence value.)

At all harmonics except the ~300Hz, the structure manifests in the signal and the coherences as two lines .001Hz apart, but if I recall correctly .001Hz is the resolution of the frequency series, so it's safer to say that this is a bulge with .001Hz < width < .002Hz. At ~300Hz, almost all the cohering channels with data in that range show a bulge of width about 0.5Hz (see attached "disjoint_plots" for a comparison of typical channels by harmonic). This bulge, and the fact that it appears in all the same channels associated with the rest of the comb, makes me think that the fundamental may be the bulge at ~300Hz and not the line at 99.9989Hz. An interesting feature of the bulge is that in many cases, it has a prominent upward or downward spike at 299.96Hz, which is just the place the line would be if it were there (see "bulge_w_spike.jpg").

More to come re: changes in week 4 data, patterns in cohering channels, and the spike.
Images attached to this comment
Non-image files attached to this comment
