jeffrey.kissel@LIGO.ORG - posted 20:40, Tuesday 27 October 2015 (22903)
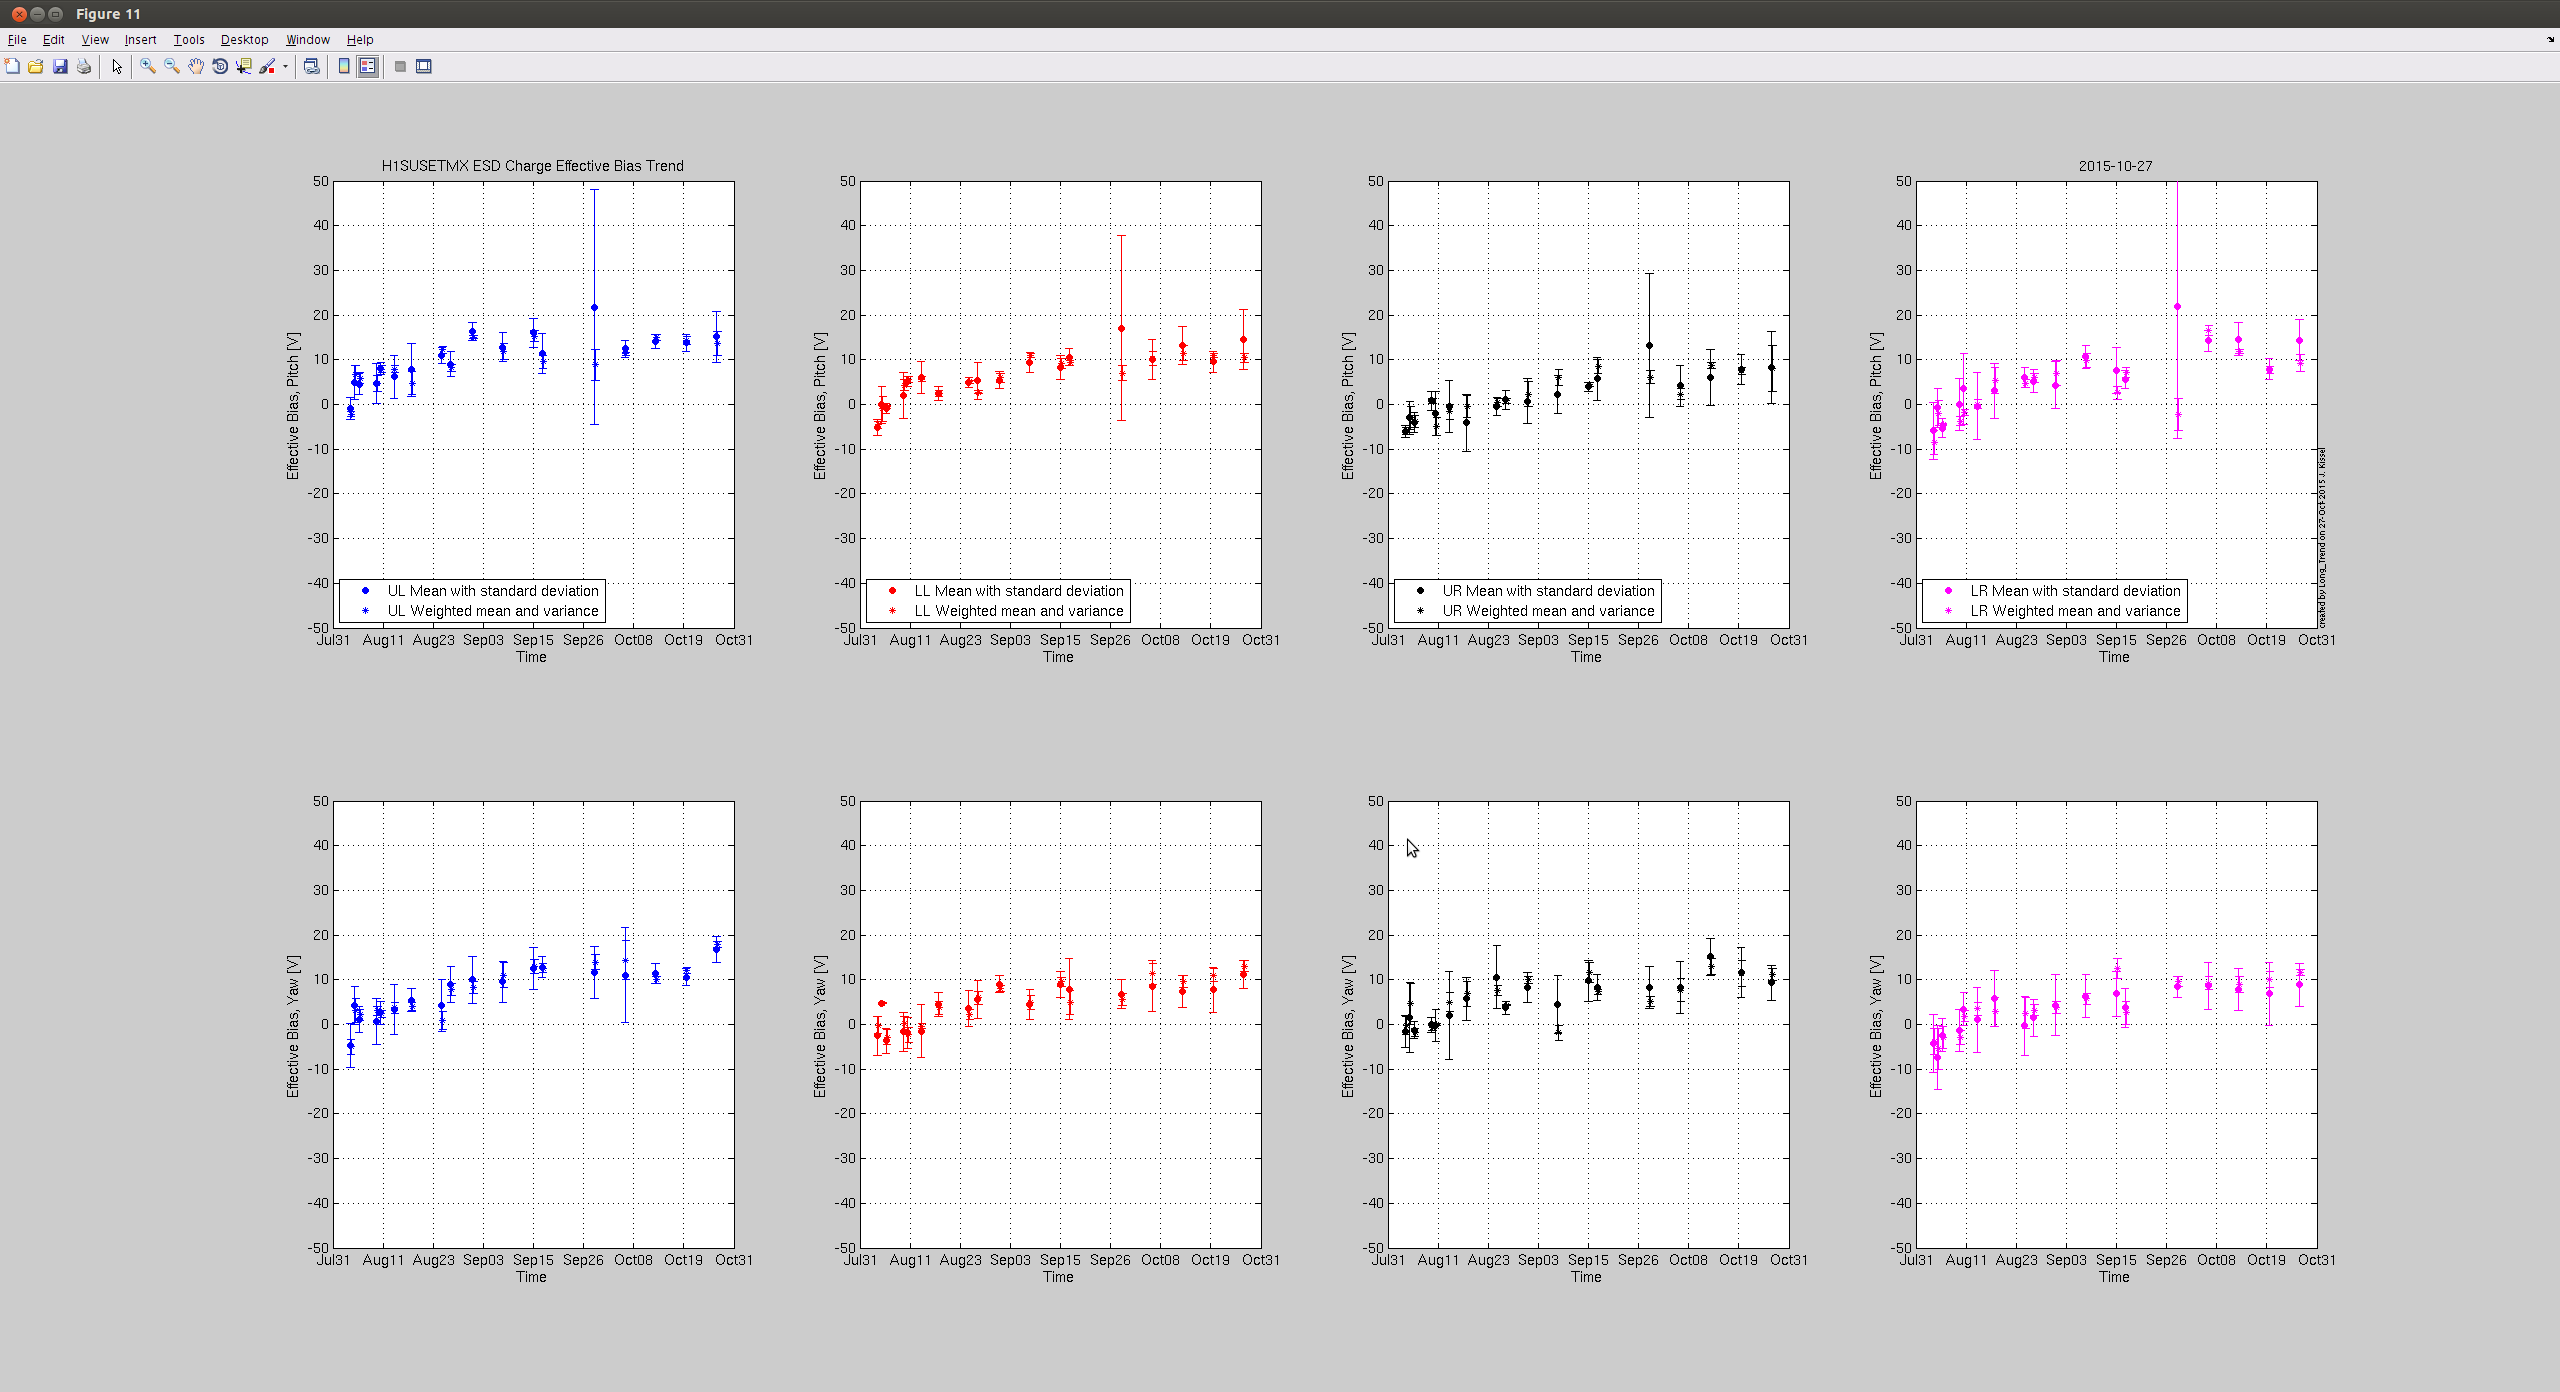
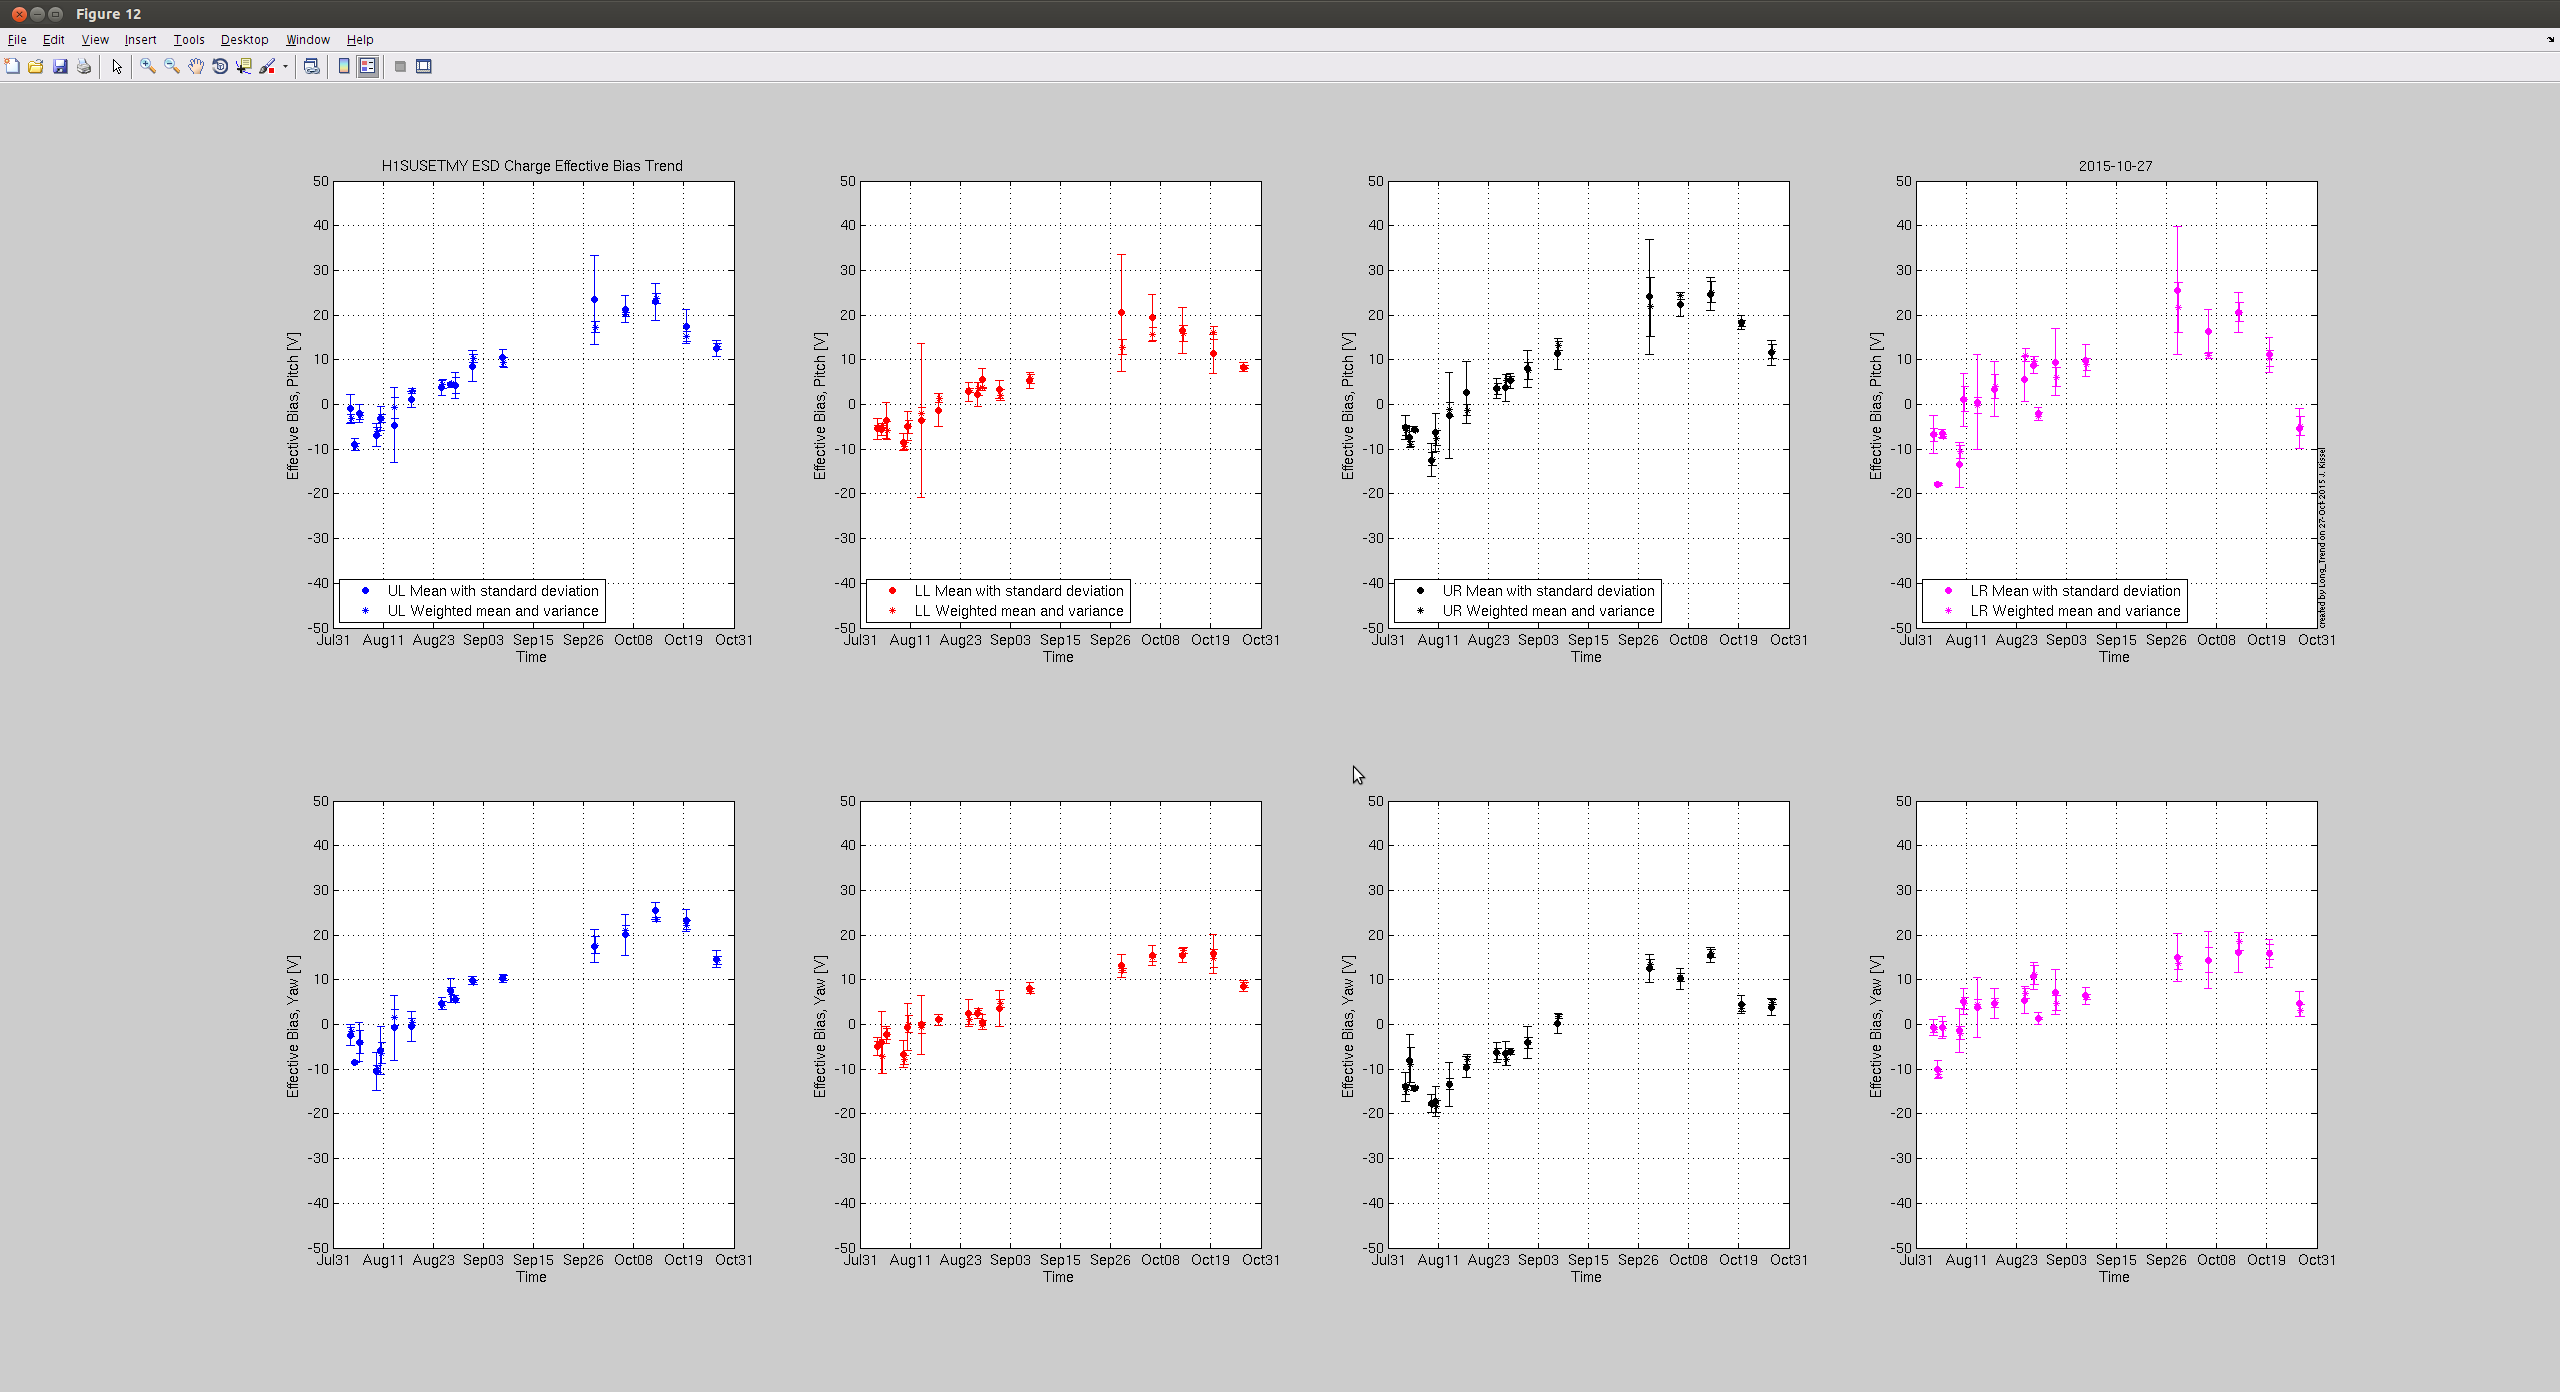
Charge Measurement Update; ETMX Accumulation Levels Off, ETMY Trending Back to Zero, and Results Agree with CAL Group Estimation of Change
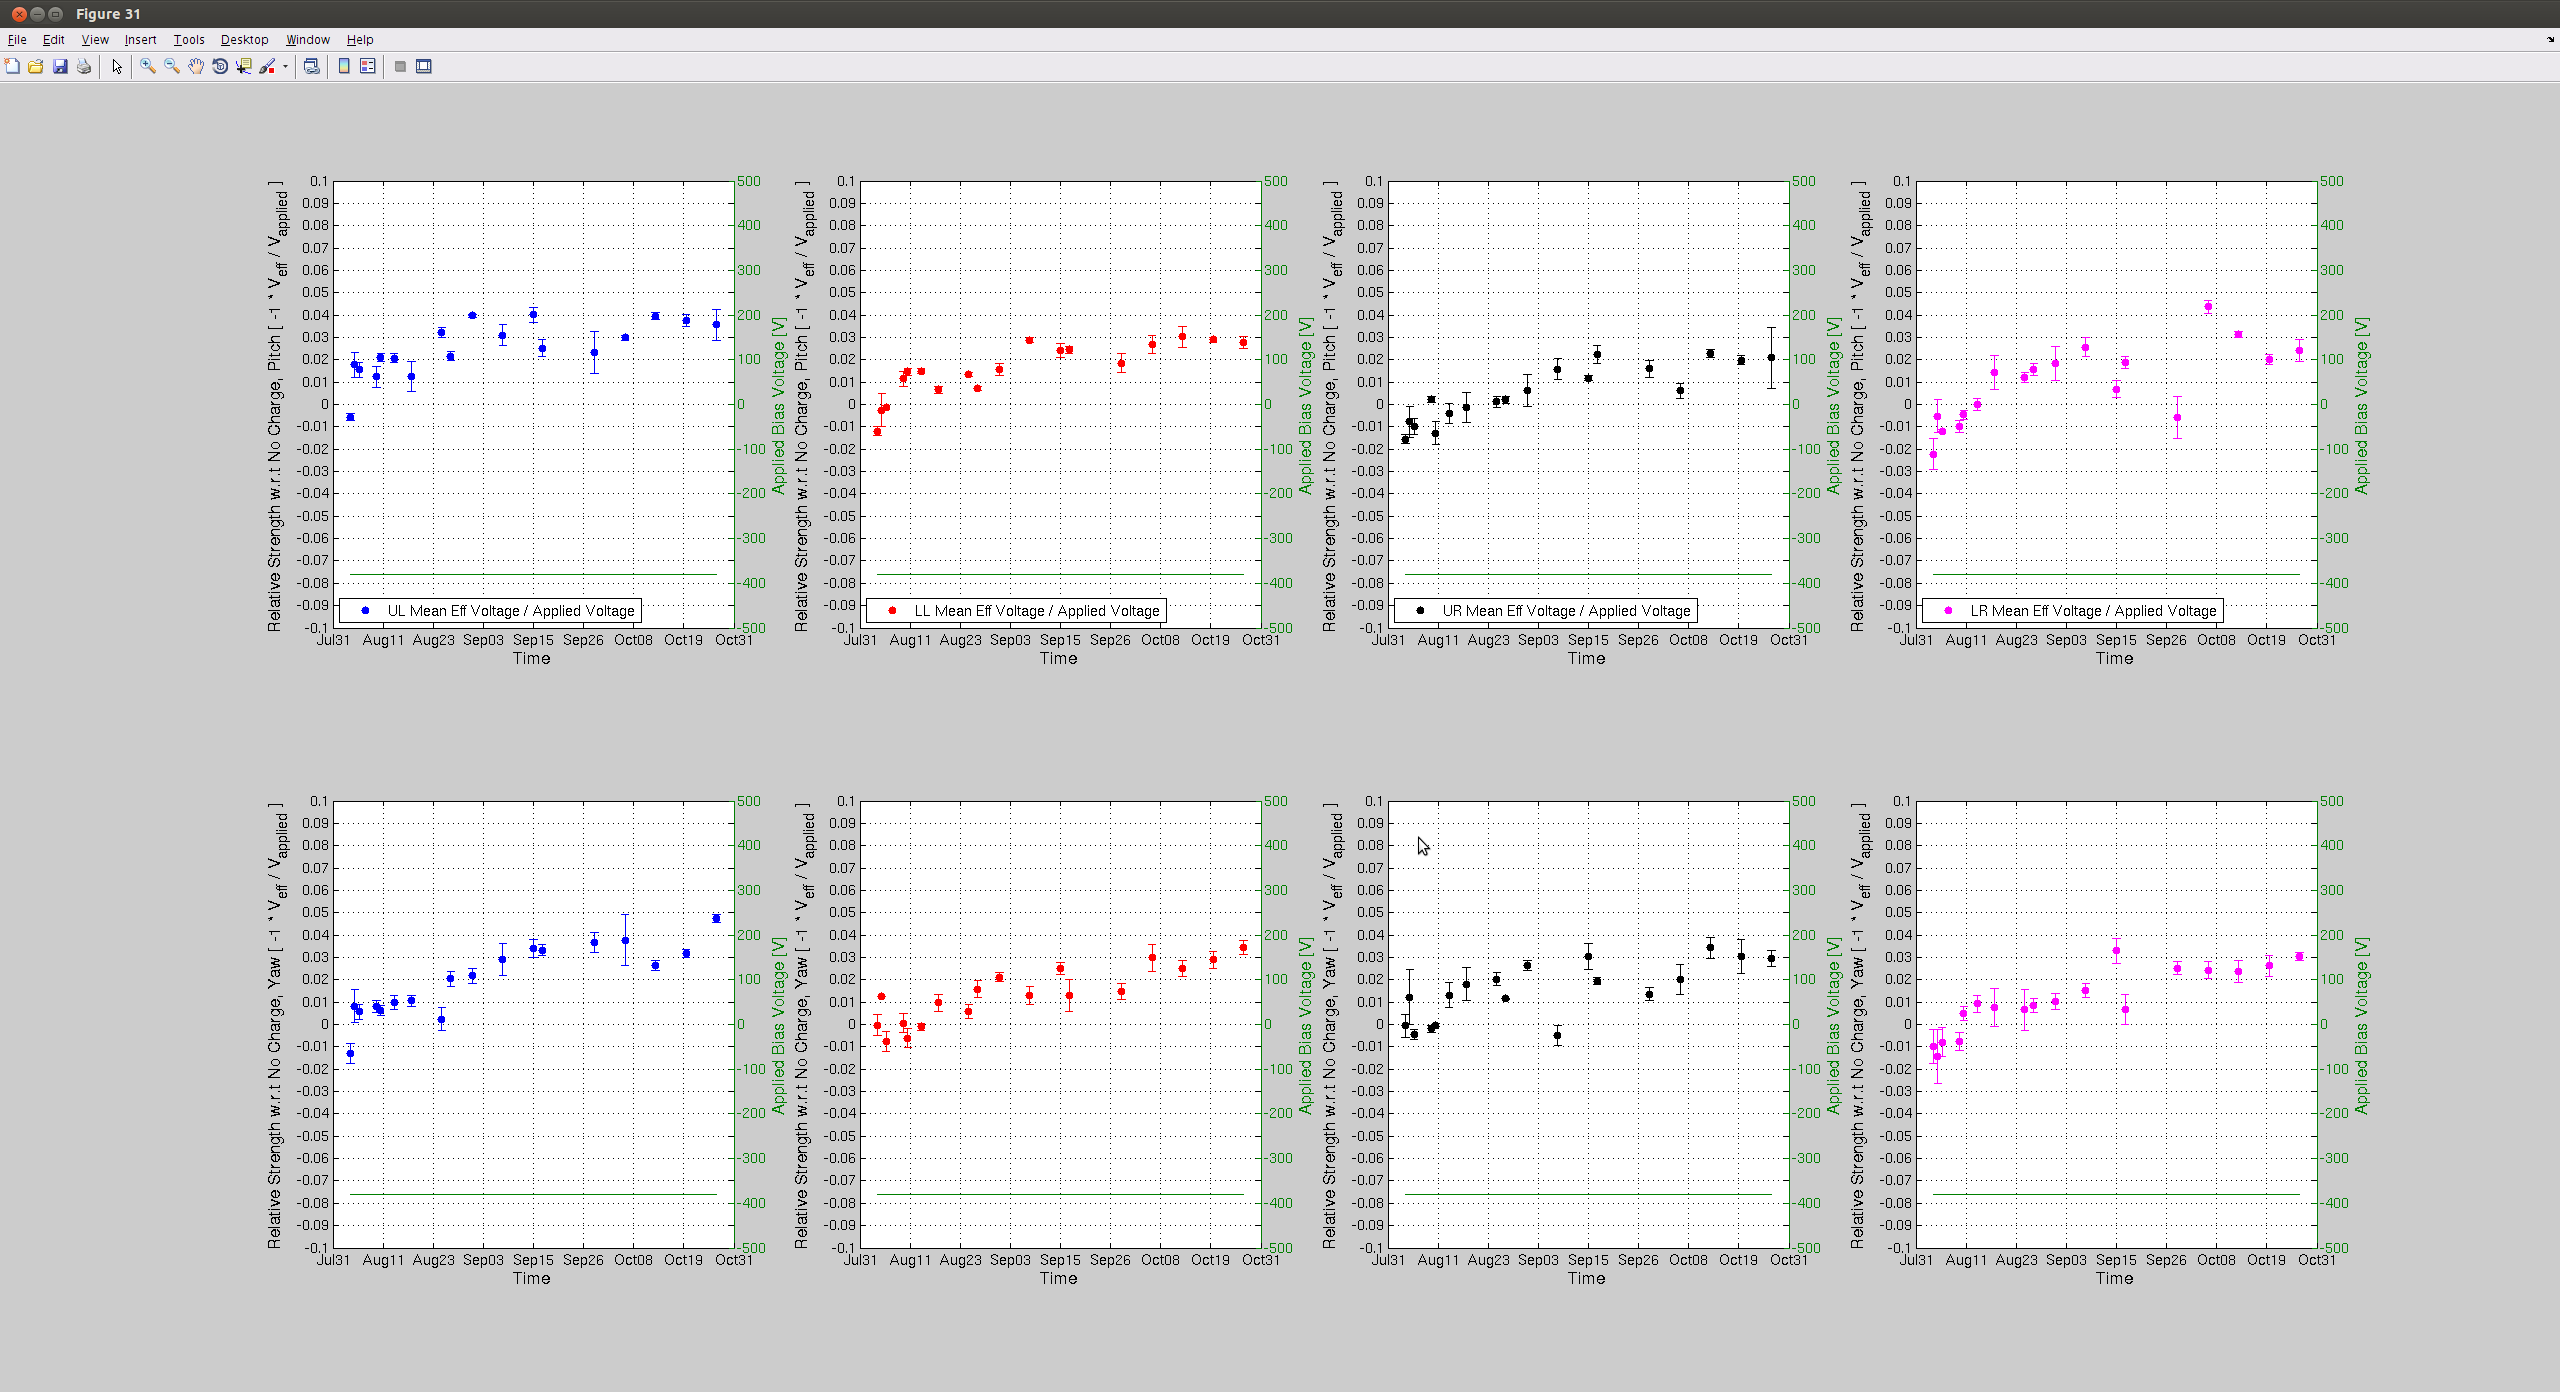
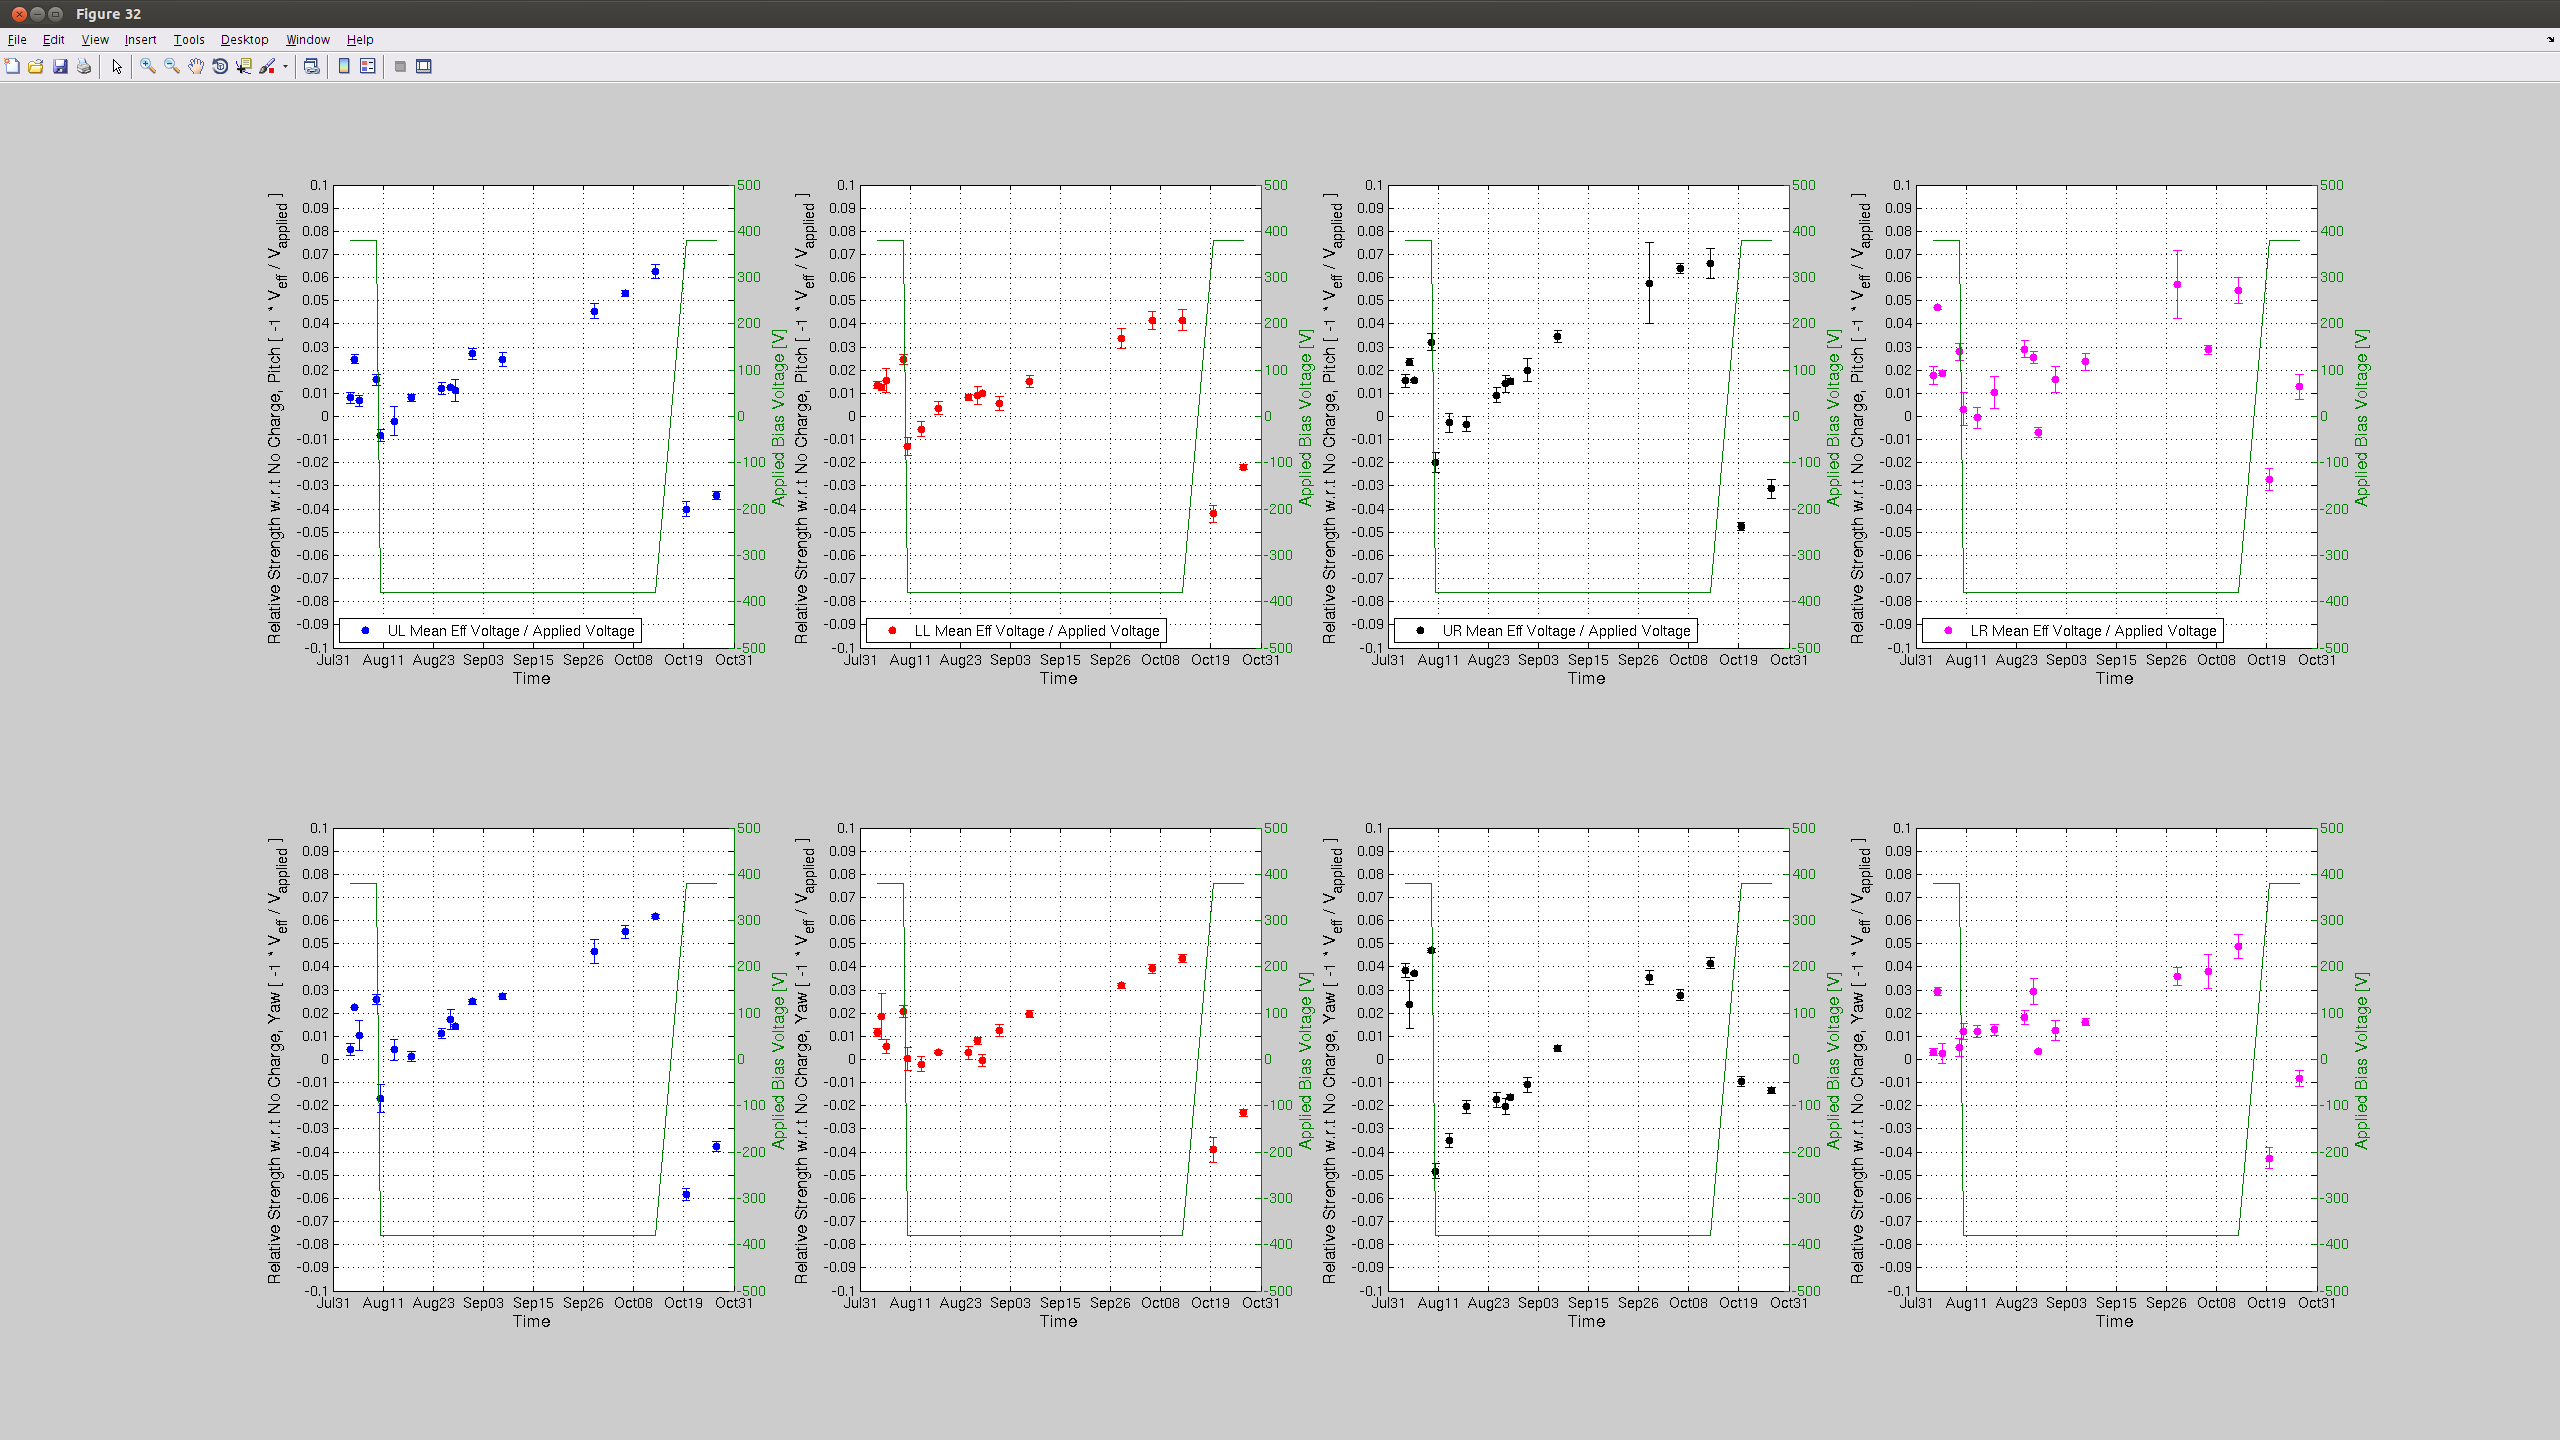
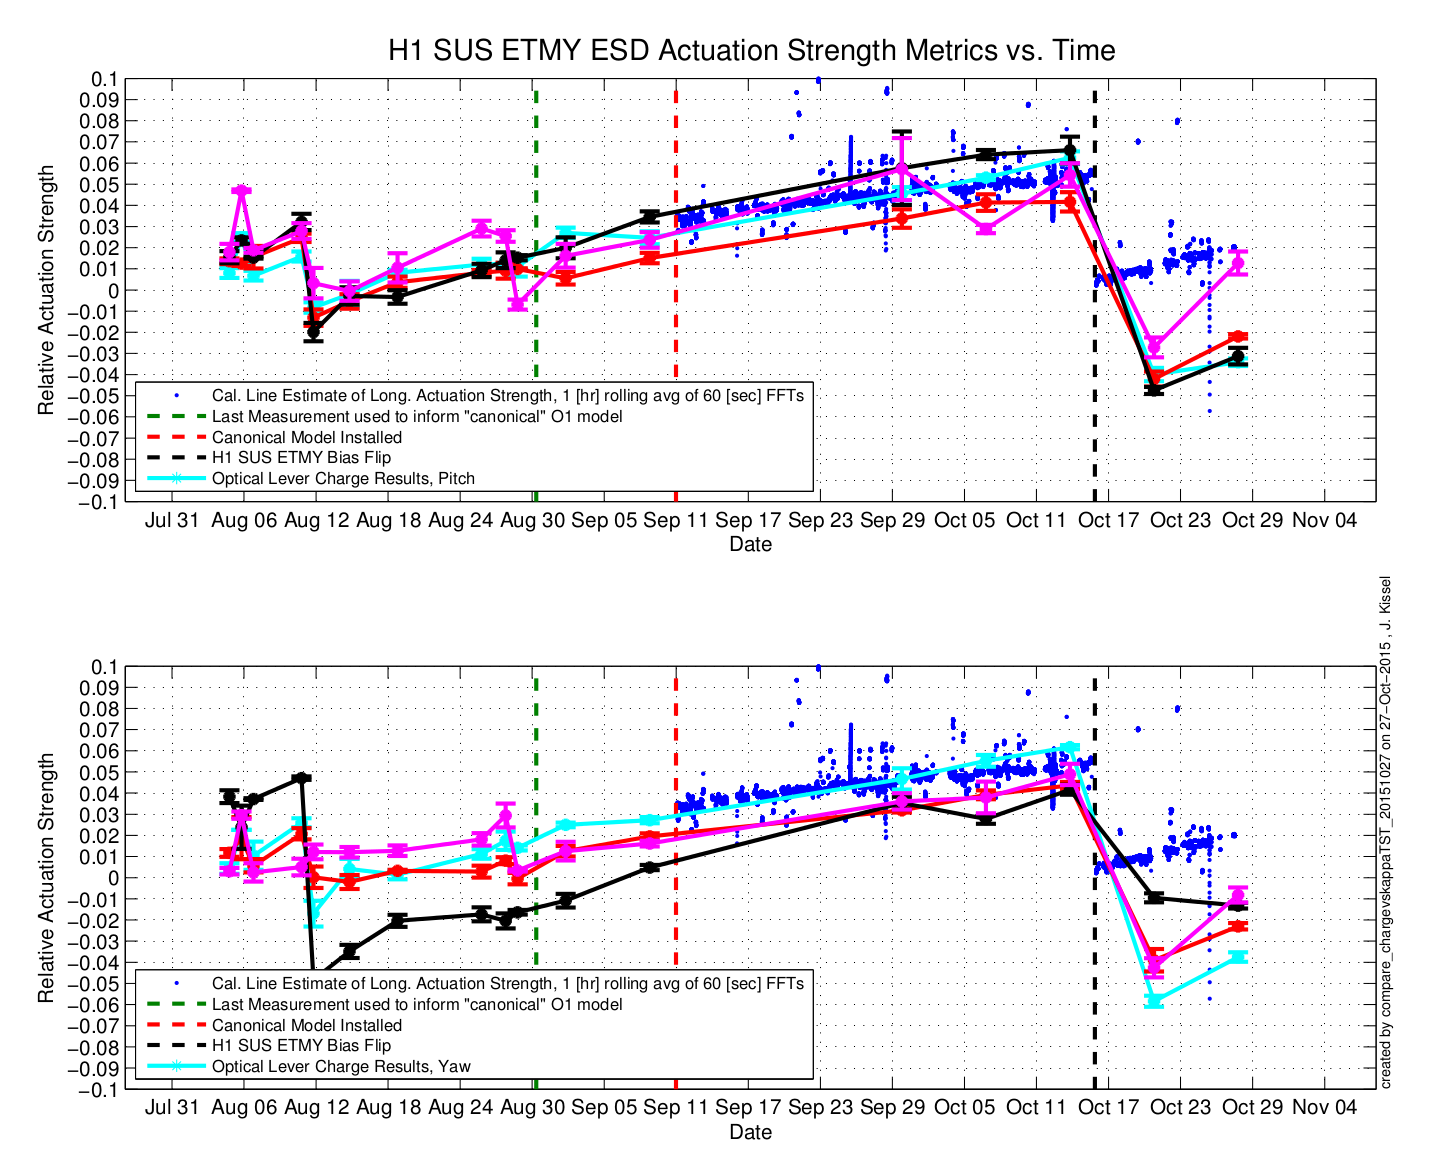
J. Kissel

I've gathered our usual Tuesday charge measurements, but have had some fun with them.
Good news all around:
(1) ETMX charge accumulation leveling off, (of course, for unknown reasons, but good all the same), and
(2) After flipping the applied bias' voltage sign from negative to positive, ETMY's charge is trending back towards zero as expected.
(3) Estimates of the strength change in ETMY between using PCAL vs. Optical Levers as a reference show excellent agreement.

I attach four charge plot collections, where I've done a good bit of work trying to make the plots more informative and relatable to other metrics. The Charge_Trend plots y'all've seen before, but is there are more ticks on the X axis to give a better feel of the days passing. Further, introduced last week but refined here, is the actuation strength change, assuming all the variations in strength are due to the relative change of Effective Bias from Charge and our Applied Bias. Also appropirately zoomed to the expected +/- 10%, and with lots of Xticks, one can immediately compare this to plots of the test mass stage actuation strength change over time as measured by calibration lines, because we know from Eq. 12 in T1500467,
     F_{lin} propto 2 alpha V_{S} V_{B} ( 1 - V_{EFF} / V_{B} )
so, if we believe that charge is the only thing causing the actuation strength of ESD to change over time, then - V_{EFF} / V_{B} from the OpLev measurements should directly map on to Change in actuation strength as measured by the PCAL calibration lines a. la "kappa_TST" in T1500377.

As such, I attach a brand-spankin' new money plot, where I compare the actuation strength of each quadrant as measured by the optical lever in pitch and yaw, against the actuation strength of all quadrants acting collectively in the longitudinal. They agree quite beautifully, as we've suspected all along. I think the only thing I'm sad about is the slope difference after the ETMY's bias sign flip, but (a) we only have a few points of optical lever data, and we know the scatter is pretty large from day-to-day and (b) comparing strength change in longitudinal against strength change in pitch & yaw may be a little bit mis-leading.

Anyways -- I think we can safely say that the actuation strength change we see in calibration is almost entirely attributed to the slow changes in electric field around the test mass. This time, I'm careful in my words not to just colloquially say "charge," since we haven't yet narrowed down whether the dominant mechanism is actual charge close to the ESD pattern, or slowly drifting voltage on the cage (again, see Leo's work in T1500467).

-------------
Details:
For today's charge measurements, I've followed the newly updated instructions on the aWIKI.

To produce the attached .pngs, I've updated and committed the changed to
/ligo/svncommon/SusSVN/sus/trunk/QUAD/Common/Scripts/Long_Trend.m
The charge data from this trend was subsequently exported to
/ligo/svncommon/CalSVN/aligocalibration/trunk/Runs/O1/H1/Results/CAL_PARAM/2015-10-27_H1SUSETMY_ChargeMeasResults.mat

For the estimate of actuation strength change from the Cal Lines, I've used Sudarshan's data from SLM tool aLOGged here, and committed to the CalSVN repo here:
/ligo/svncommon/CalSVN/aligocalibration/trunk/Runs/O1/H1/Results/CAL_PARAM/2015-10-27_Oct_Kappas.mat
In addition to the 60 [s] FFTs from SLM Tool, I've taken a 1 [hr] rolling average of the data to through out what we're now confident is mostly Gaussian Noise to clean up the plot.

The script used to analyze these results collectively lives and is committed here:
compare_chargevskappaTST_20151027.m
Images attached to this report
Non-image files attached to this report
