jeffrey.kissel@LIGO.ORG - posted 13:44, Wednesday 28 October 2015 - last comment - 12:33, Friday 06 November 2015(22928)
New DARMOLG TF and PCAL2DARM TF gathered; There are some changes as expected, but still smaller that 5% and 5 [deg]
J. Kissel, K. Izumi, N. Kijbunchoo
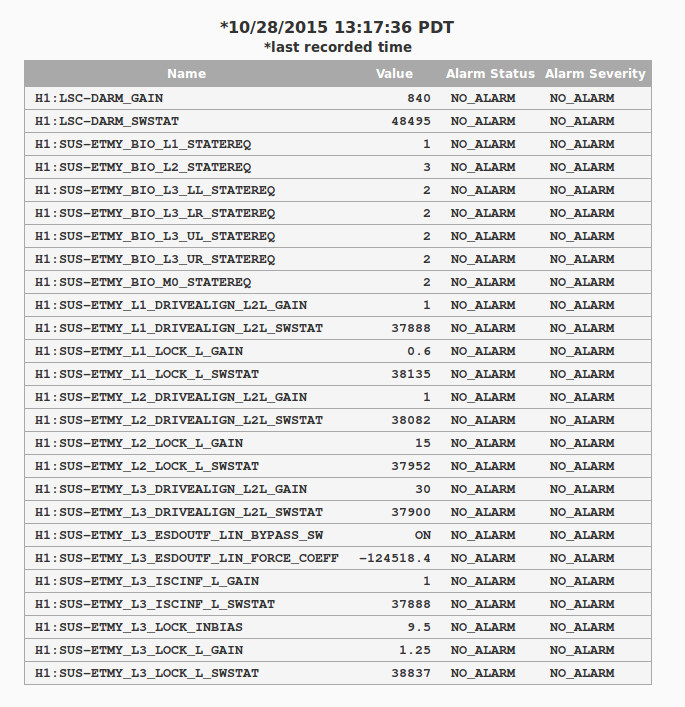
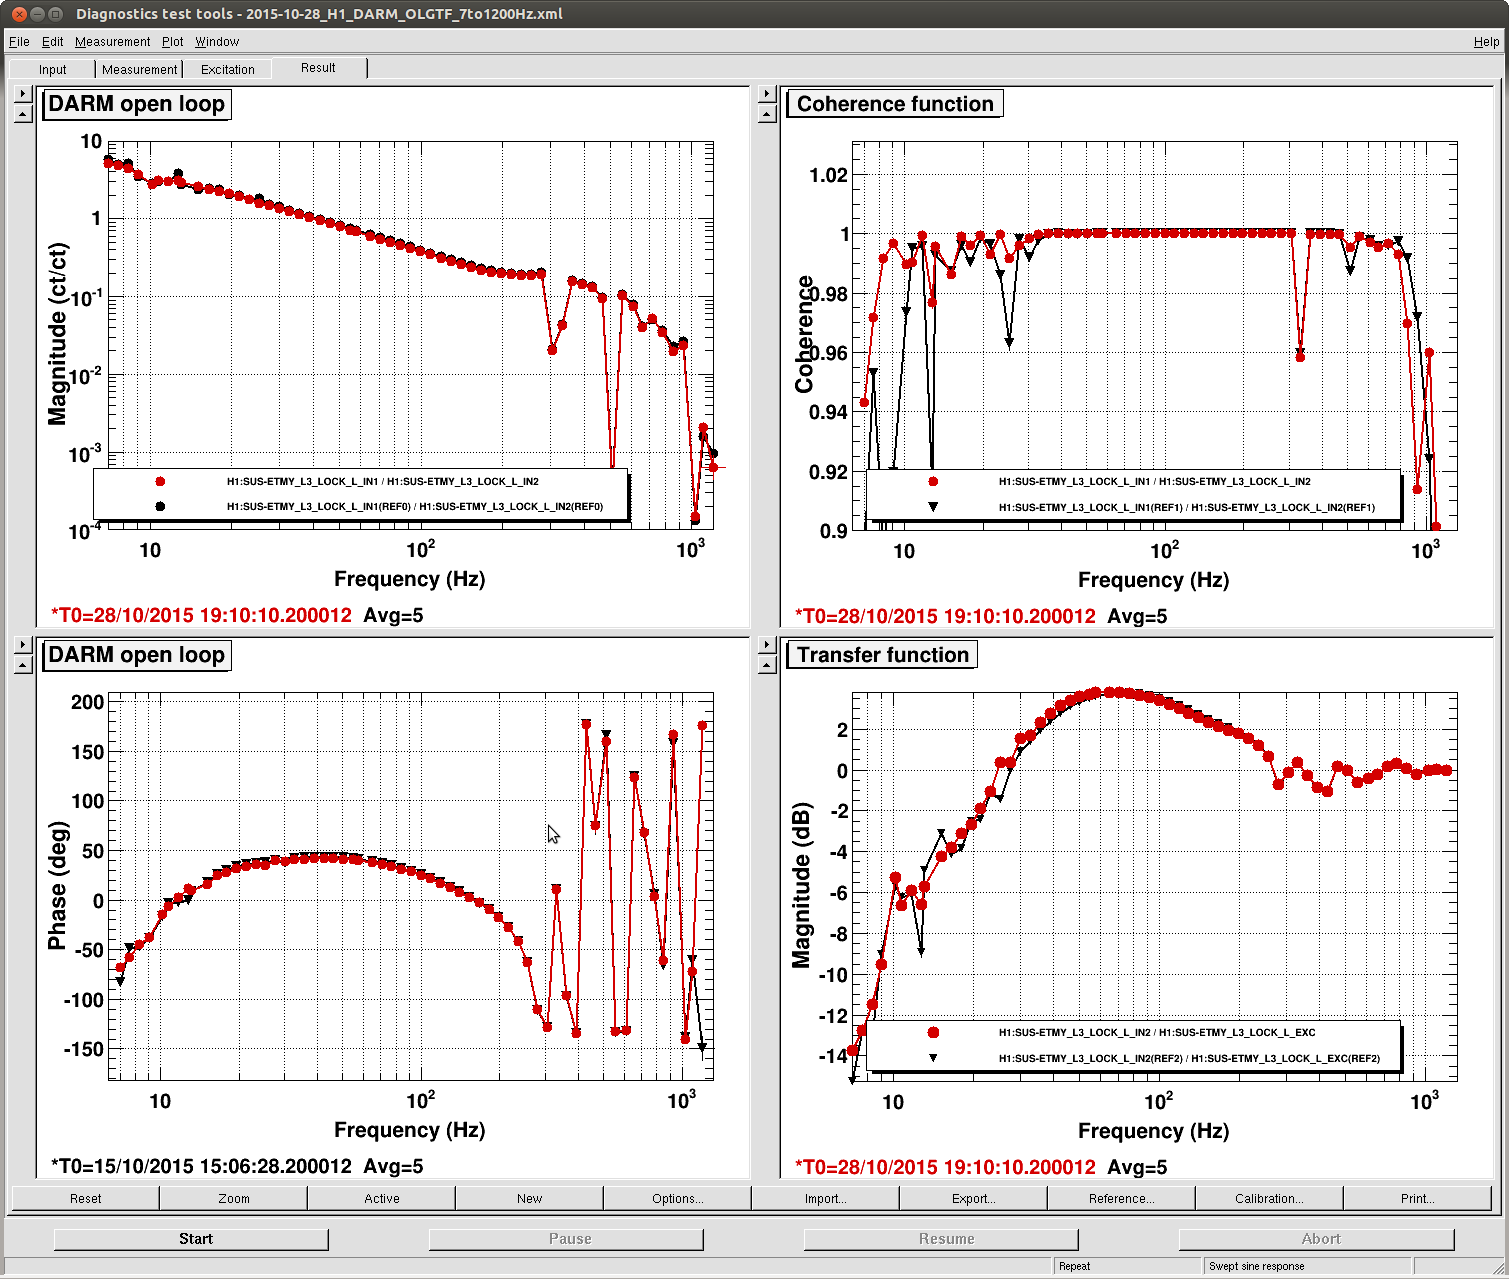
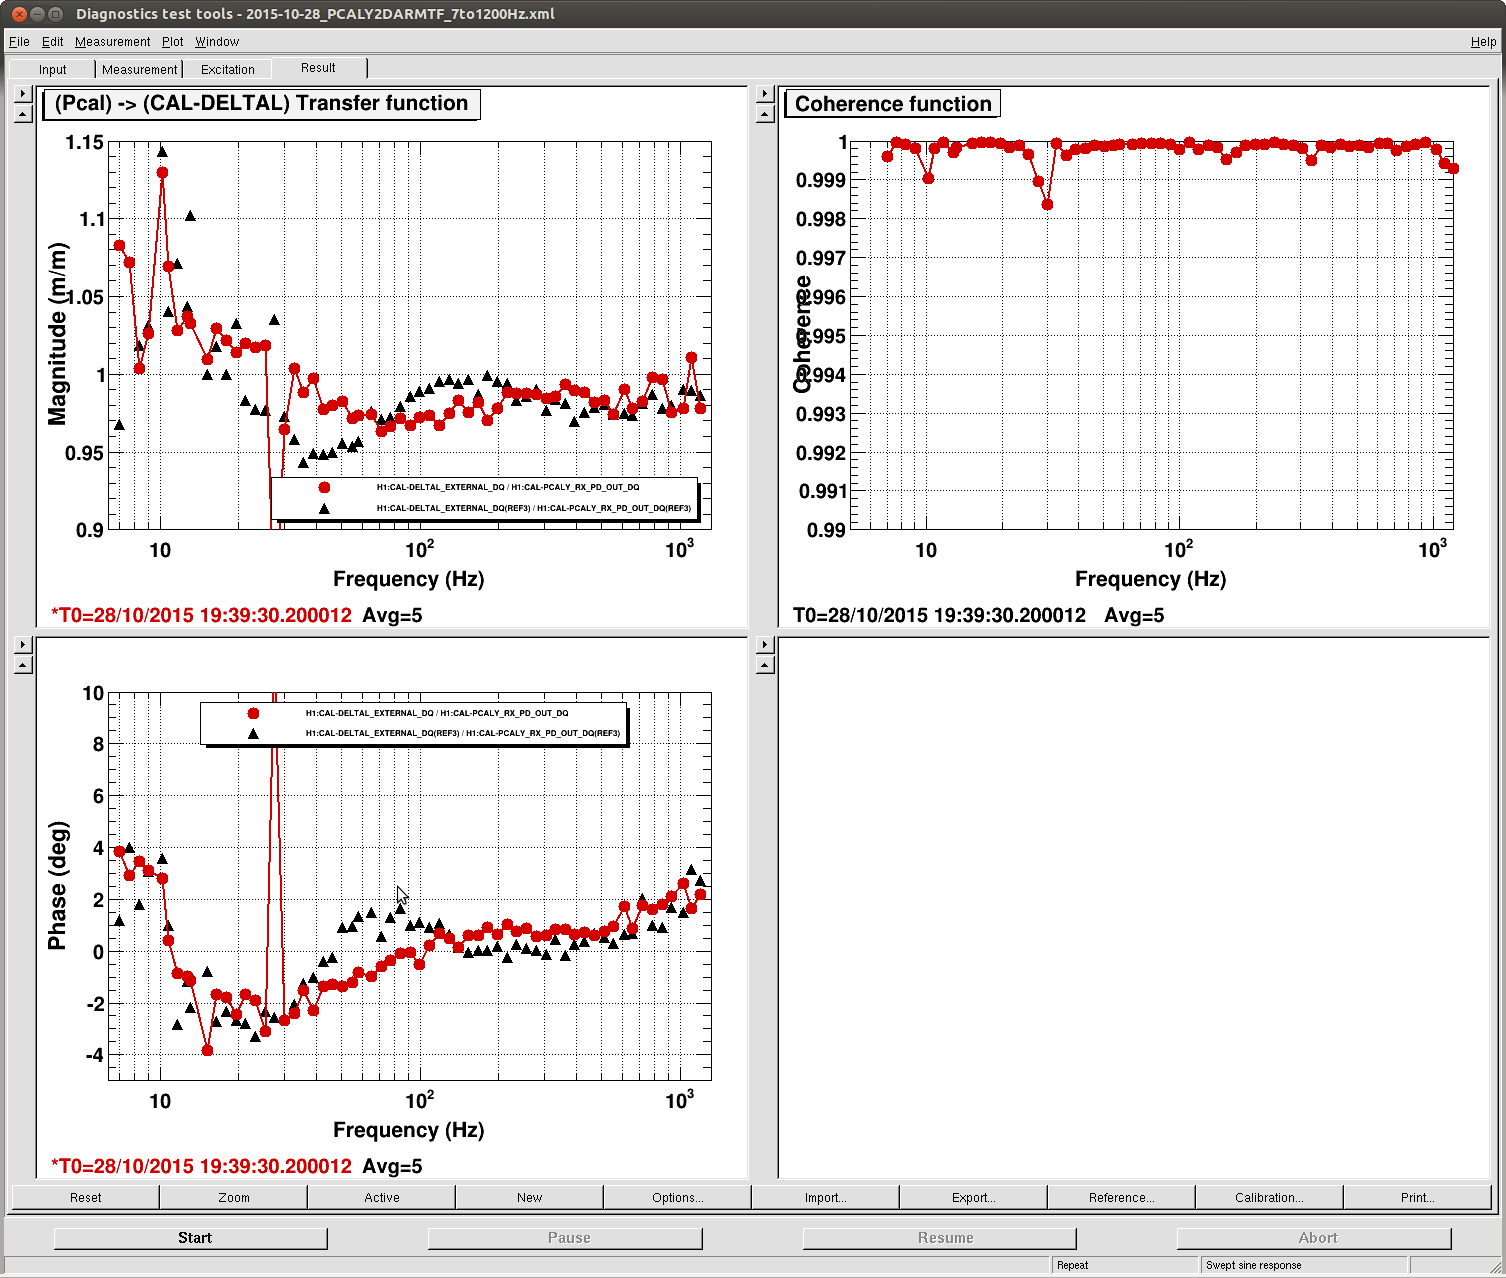
We've gathered new DARMOGLTF measurements to continue our long-term investigating on the slow evolution of the calbriation parameters. Based on what I see in DTT alone, the uncorrected loop gain and pcal to CAL-CS transfer function remains within 5% and 5 [deg] of the reference model. Very good! I attach screen shots of the raw measurements and a conlog of the relevant settings, but more detailed analysis to come.
The new DTT results live here:
/ligo/svncommon/CalSVN/aligocalibration/trunk/Runs/O1/H1/Measurements/DARMOLGTFs/2015-10-28_H1_DARM_OLGTF_7to1200Hz.xml
/ligo/svncommon/CalSVN/aligocalibration/trunk/Runs/O1/H1/Measurements/PCAL/2015-10-28_PCALY2DARMTF_7to1200Hz.xml
and have been exported to the following:
/ligo/svncommon/CalSVN/aligocalibration/trunk/Runs/O1/H1/Measurements/DARMOLGTFs
1 / (1 + G) = 2015-10-28_H1_DARM_OLGTF_7to1200Hz_A_ETMYL3LOCKIN2_B_ETMYL3LOCKEXC_coh.txt
2015-10-28_H1_DARM_OLGTF_7to1200Hz_A_ETMYL3LOCKIN2_B_ETMYL3LOCKEXC_tf.txt
-G = 2015-10-28_H1_DARM_OLGTF_7to1200Hz_A_ETMYL3LOCKIN2_B_ETMYL3LOCKIN1_coh.txt
2015-10-28_H1_DARM_OLGTF_7to1200Hz_A_ETMYL3LOCKIN2_B_ETMYL3LOCKIN1_tf.txt
/ligo/svncommon/CalSVN/aligocalibration/trunk/Runs/O1/H1/Measurements/PCAL/
C / (1 + G) = 2015-10-28_PCALY2DARMTF_7to1200Hz_A_PCALRX_B_DARMIN1_coh.txt
2015-10-28_PCALY2DARMTF_7to1200Hz_A_PCALRX_B_DARMIN1_tf.txt
Images attached to this report
Comments related to this report
Sudarshan, Darkhan, RickS
Using data from the SLM tool for 67 minutes just before the measurement of the Pcal2Darm TF, we calculated the TF for the 1 kHz and 3 kHz Pcal lines.
The plots attached below show:
1) The "kappas"
2) The measured TF, with coherence and the fractional uncertainty
3) The data for the 1 kHz line and comparison with TF values interpolated from the measured TF data
4) The data for the 3 kHz line
At 1 kHz, the transfer coefficient calculated from the SLM data differes from the interpolated coefficient from the meassured transfer function by 1.01% in amplutude and 0.15 deg. in phase.
The script and plots will be submitted to the SVN tomorrow and I will add a comment giving their location when they are.
Non-image files attached to this comment
