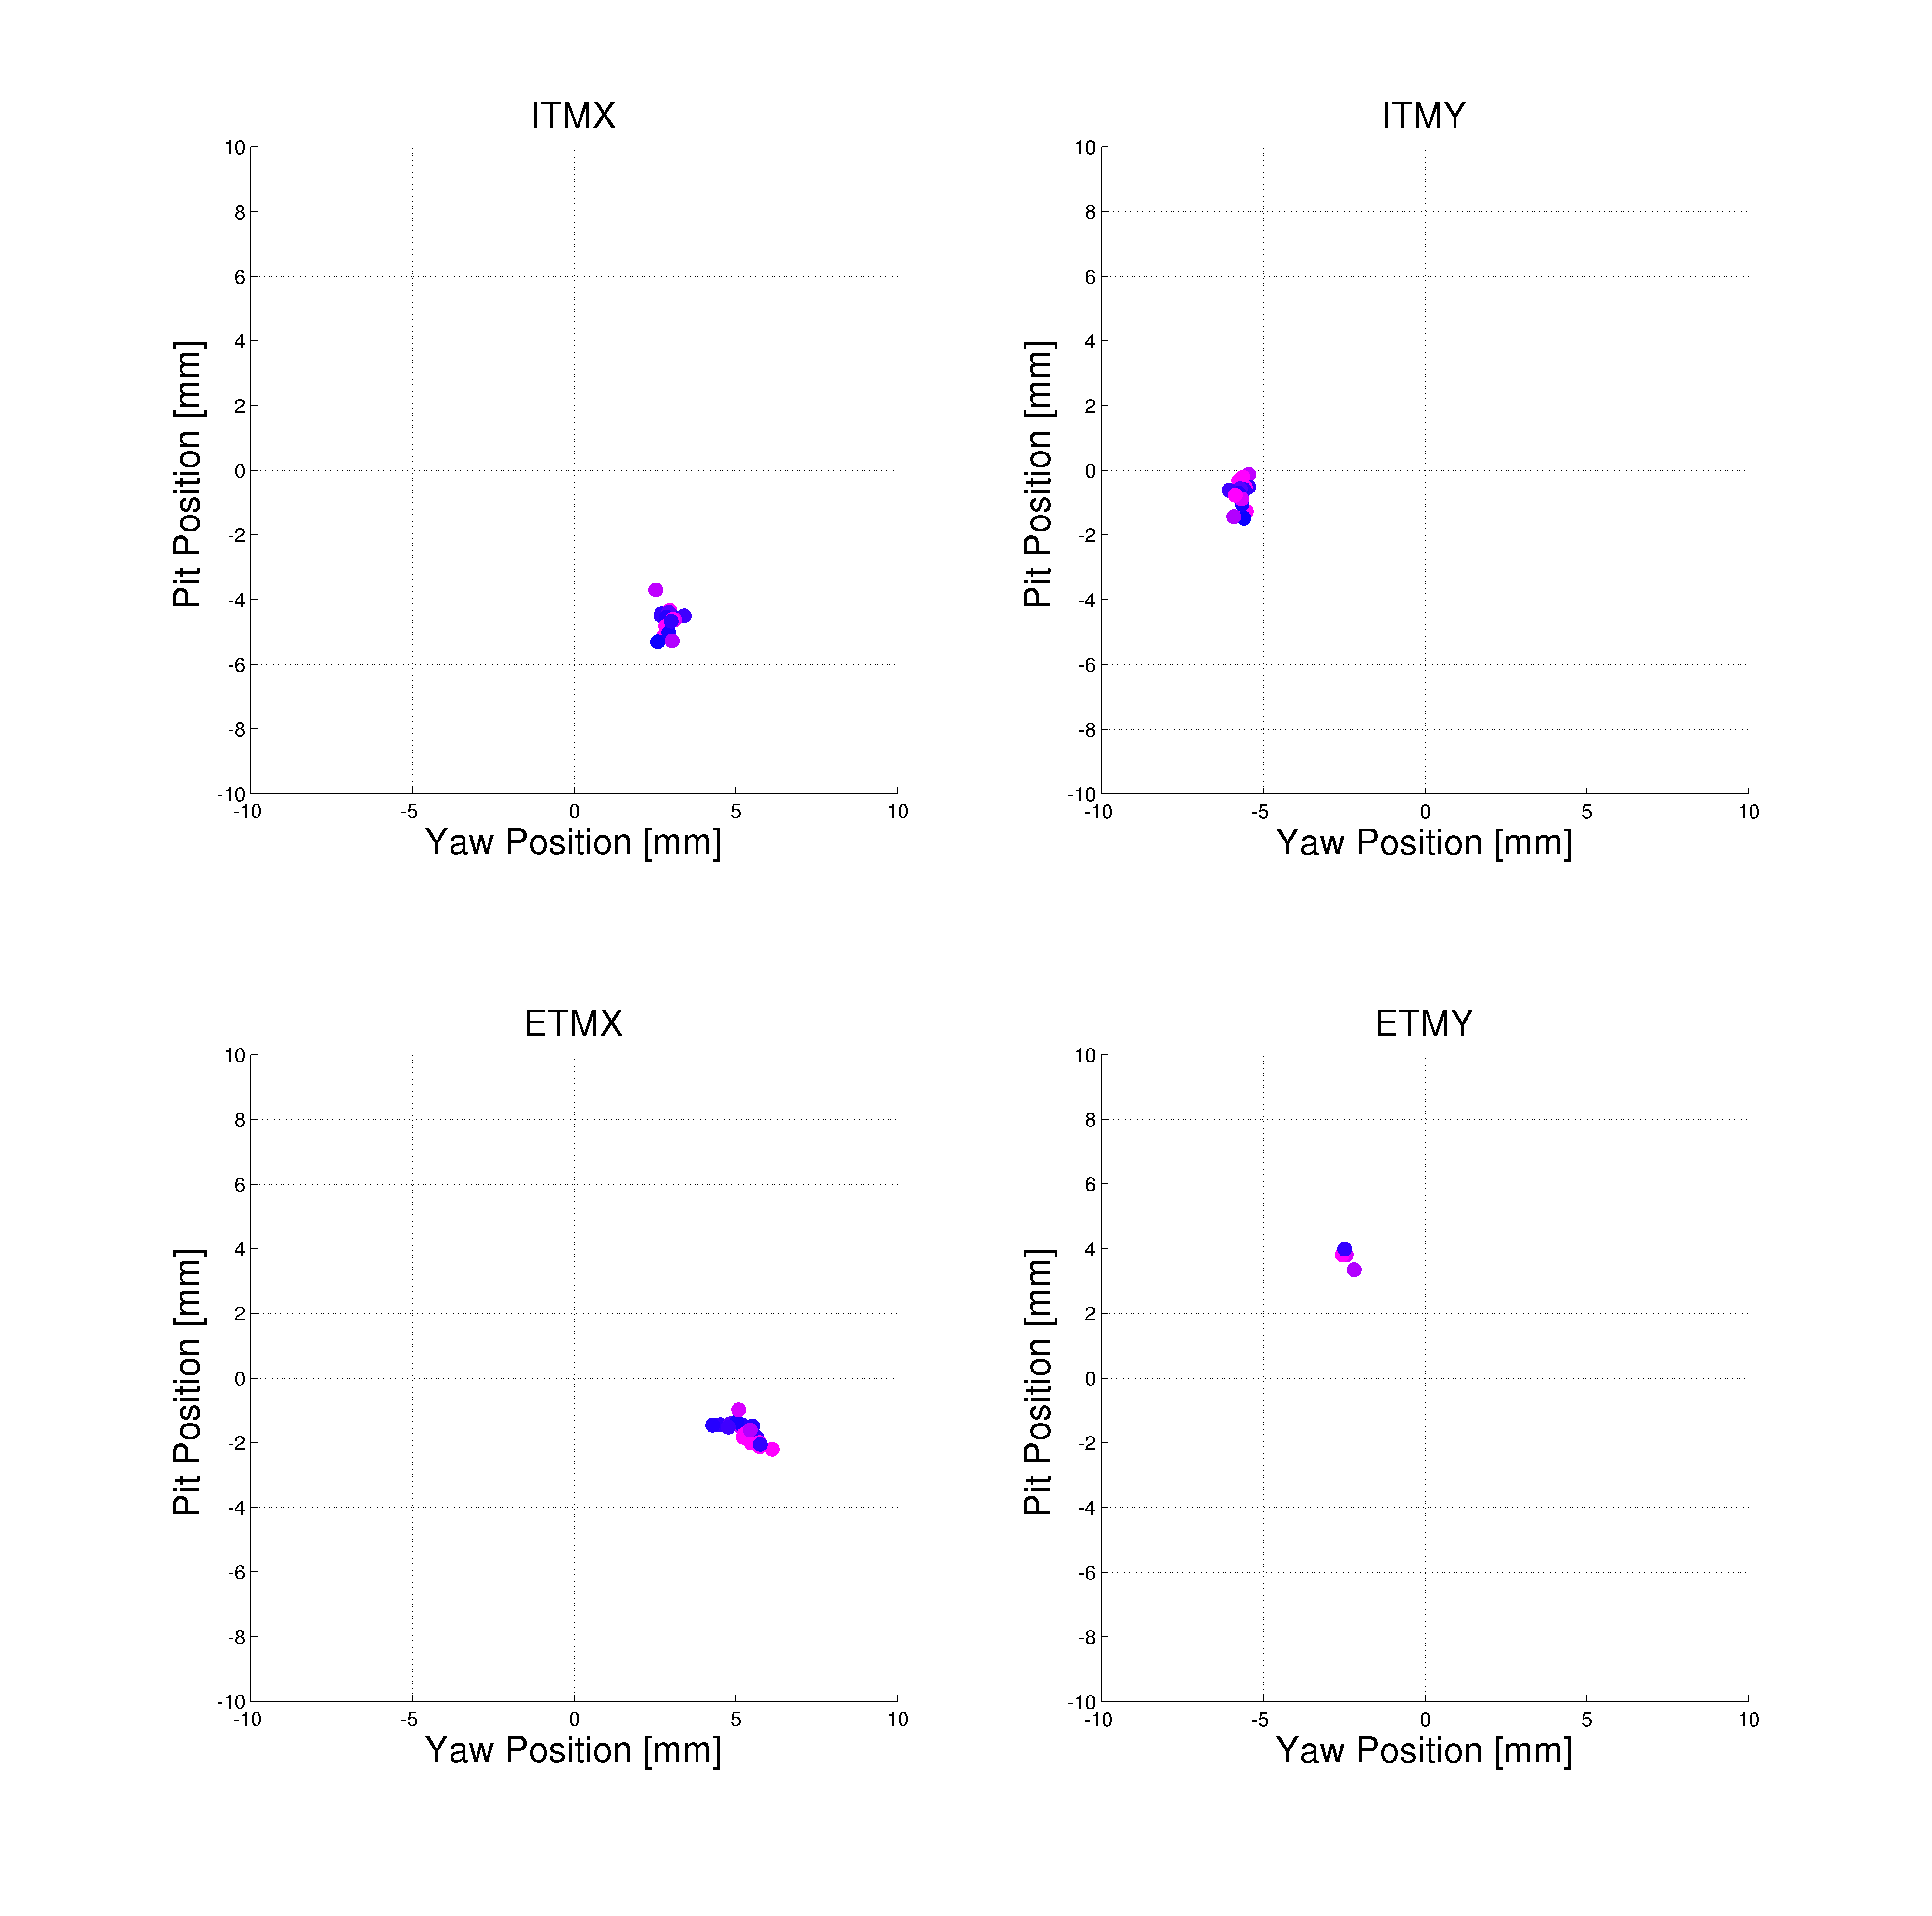
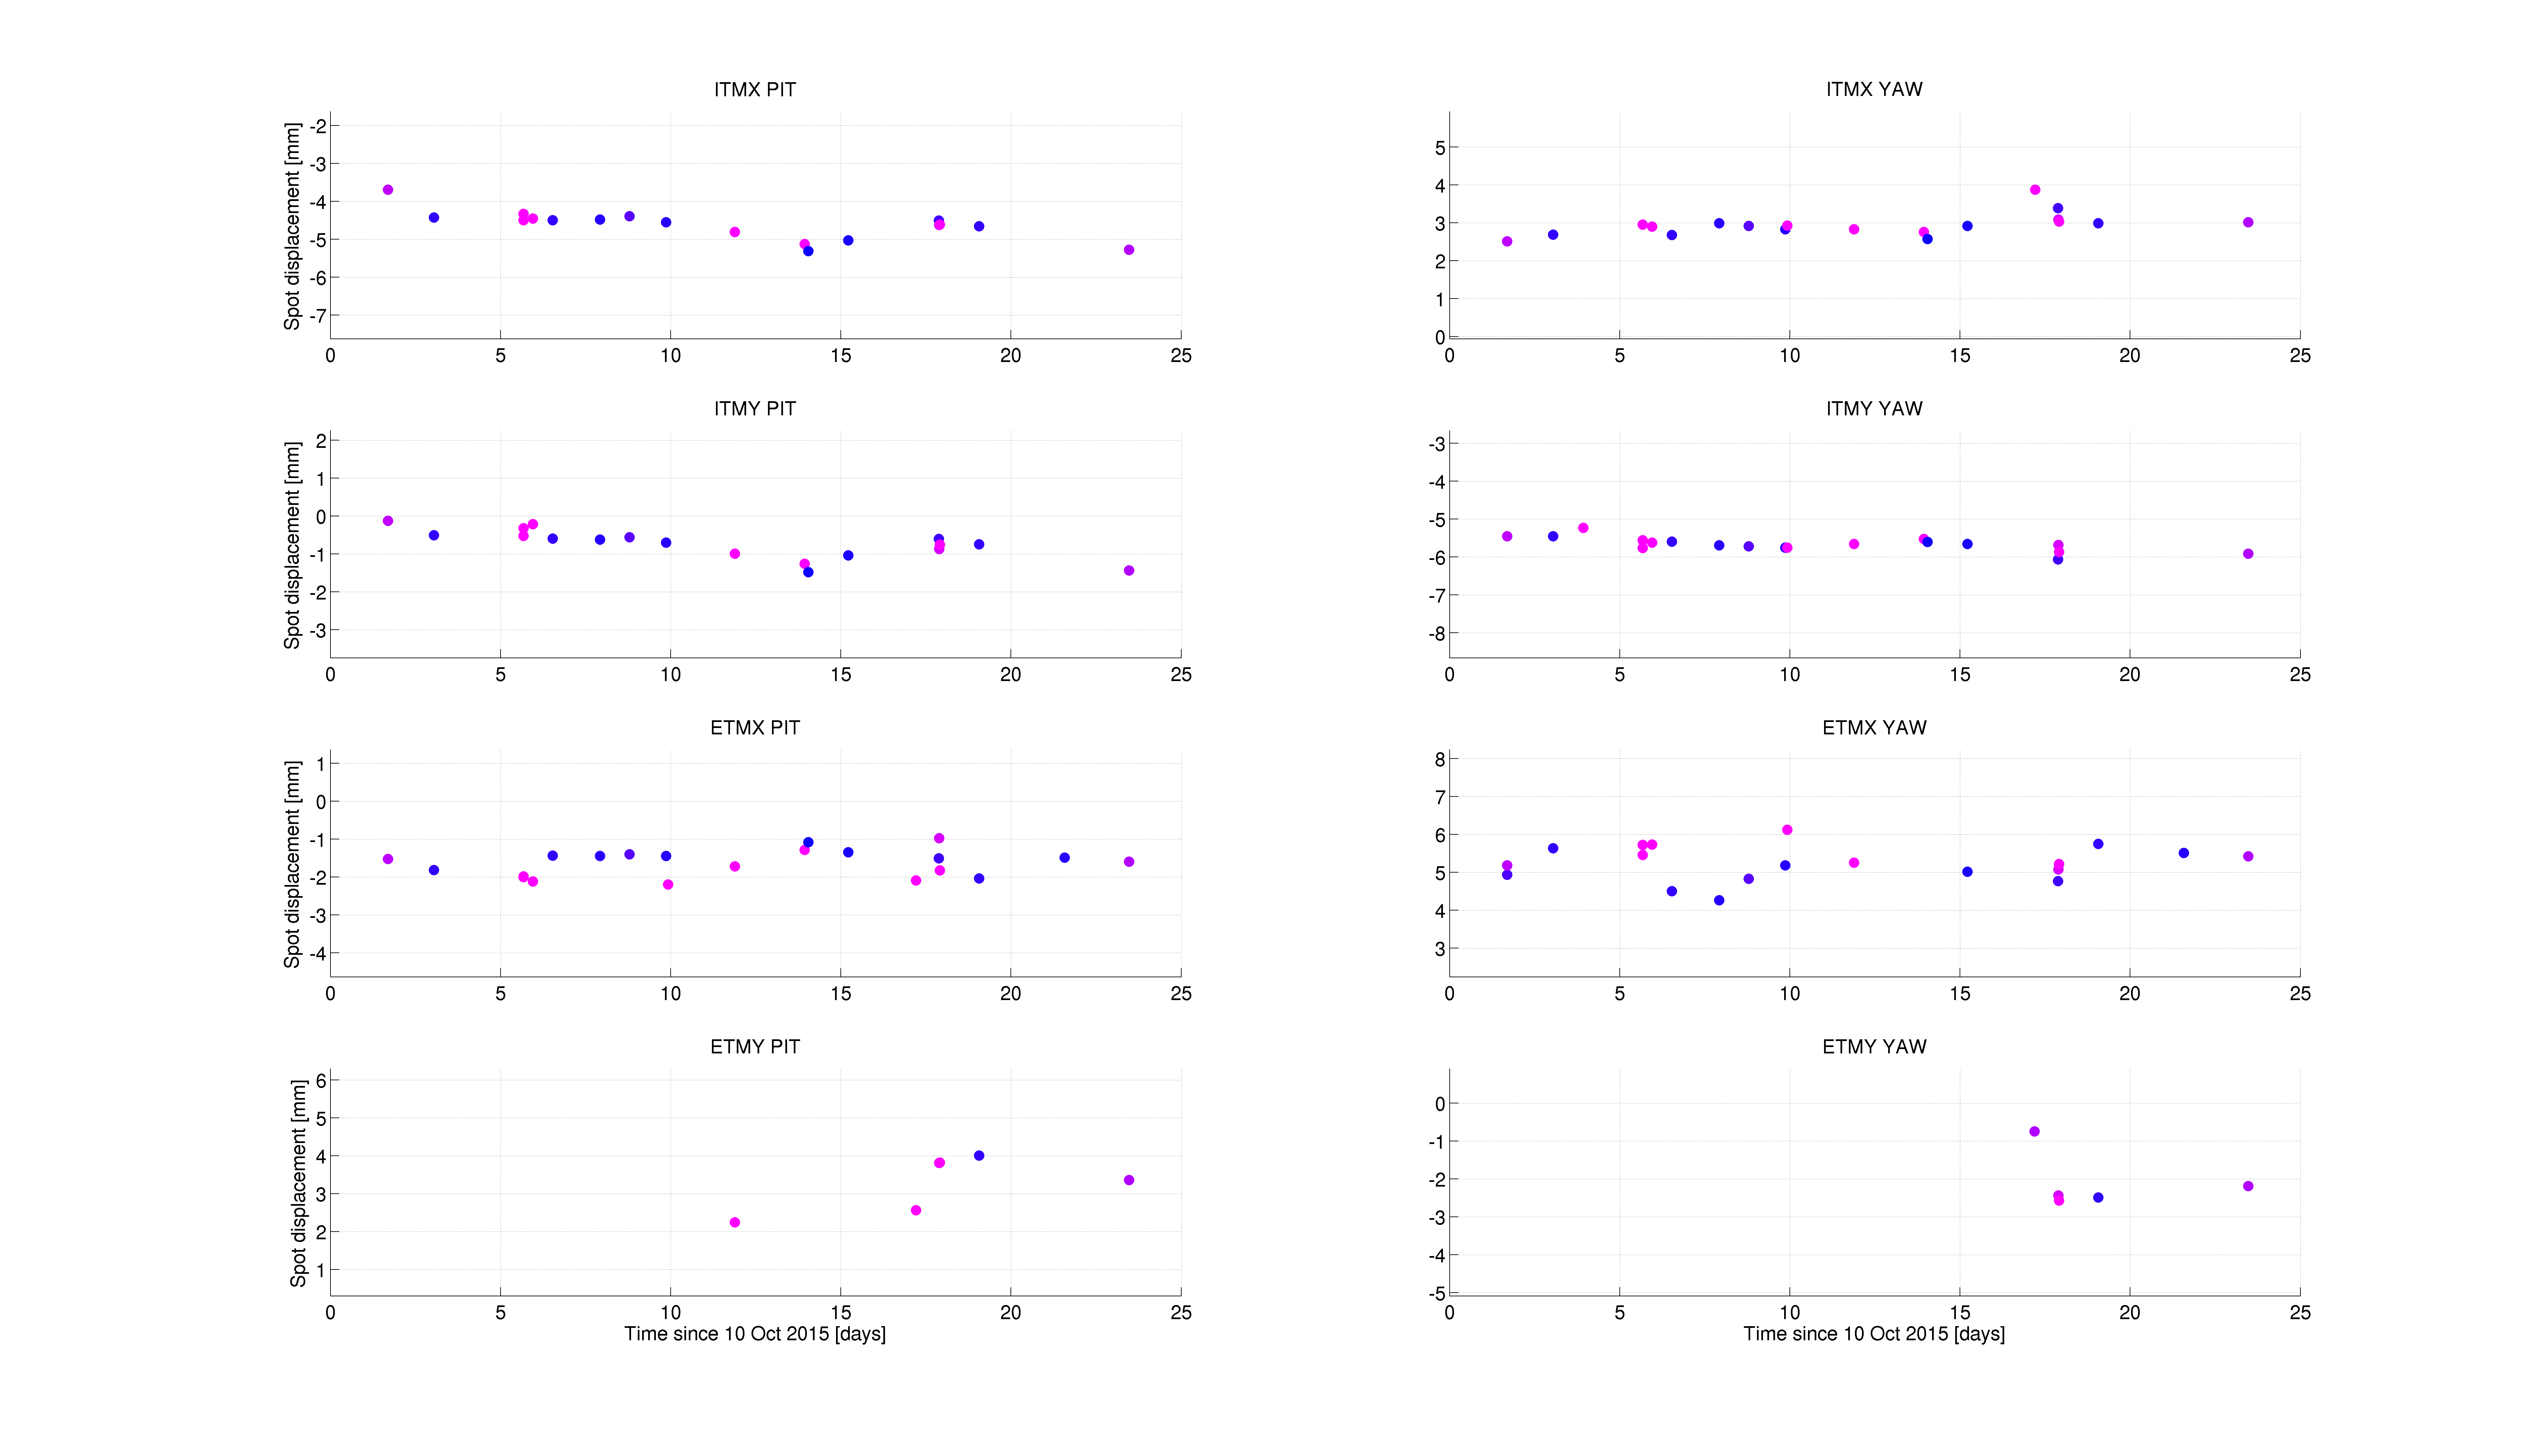
Here is a latest version of our spot positions as a function of time.
The spot colors represent the length of time that the IFO has been locked before the measurement was taken. More blue is more cold, i.e. shorter lock duration. The colors become more pink for longer lock durations, with anything greater than 30 min showing up as the same color pink.
These spot positions are calculated from the P2L and Y2L gains, but now including the last coupling factor from L2 angle to L3 length, which is why the absolute values of the spot positions are somewhat changed from previous plots. (I don't know if Marie has an LLO alog about the calculation, but she has updated the spot position calculator in the svn, and that's what I'm using.)
These plots do not have error bars, although one might hope that that helps explain why our ETM spots seem to move much more than our ITM spots. However, the largest distance between spots for a single optic is about 2mm, which is not too bad.