SudarshanK, RickS
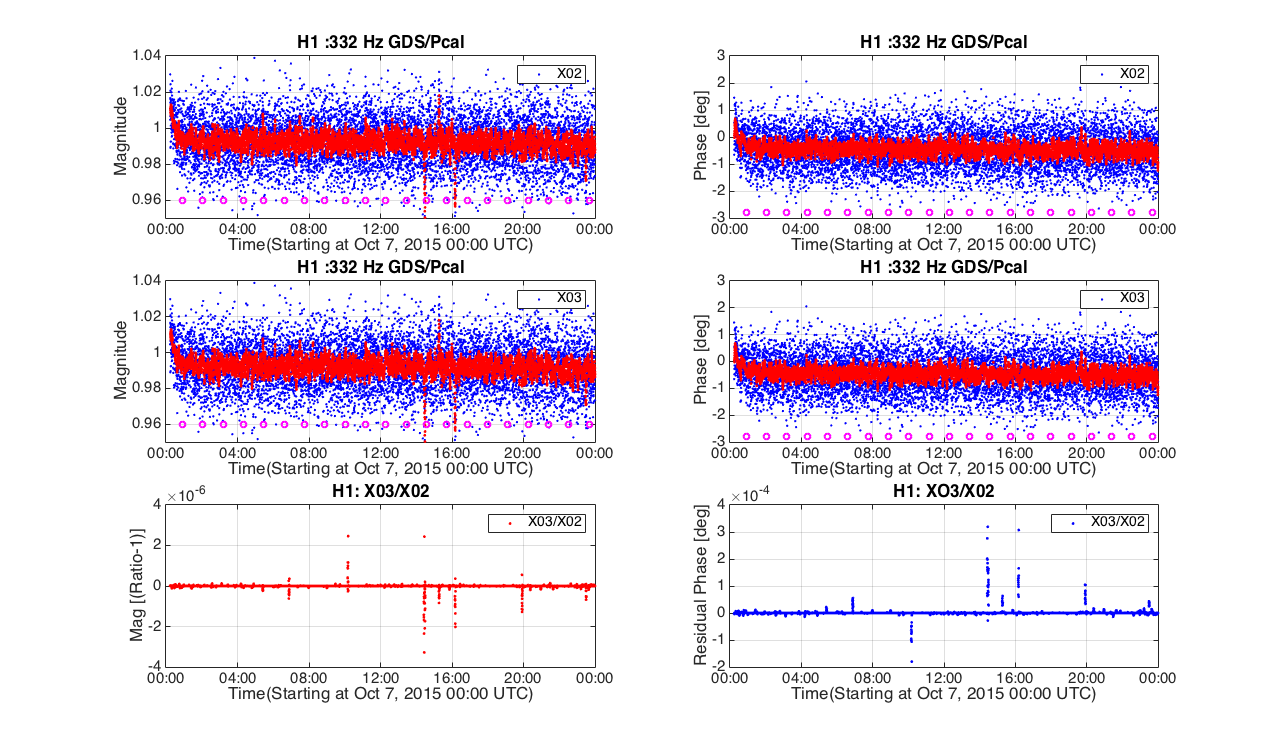
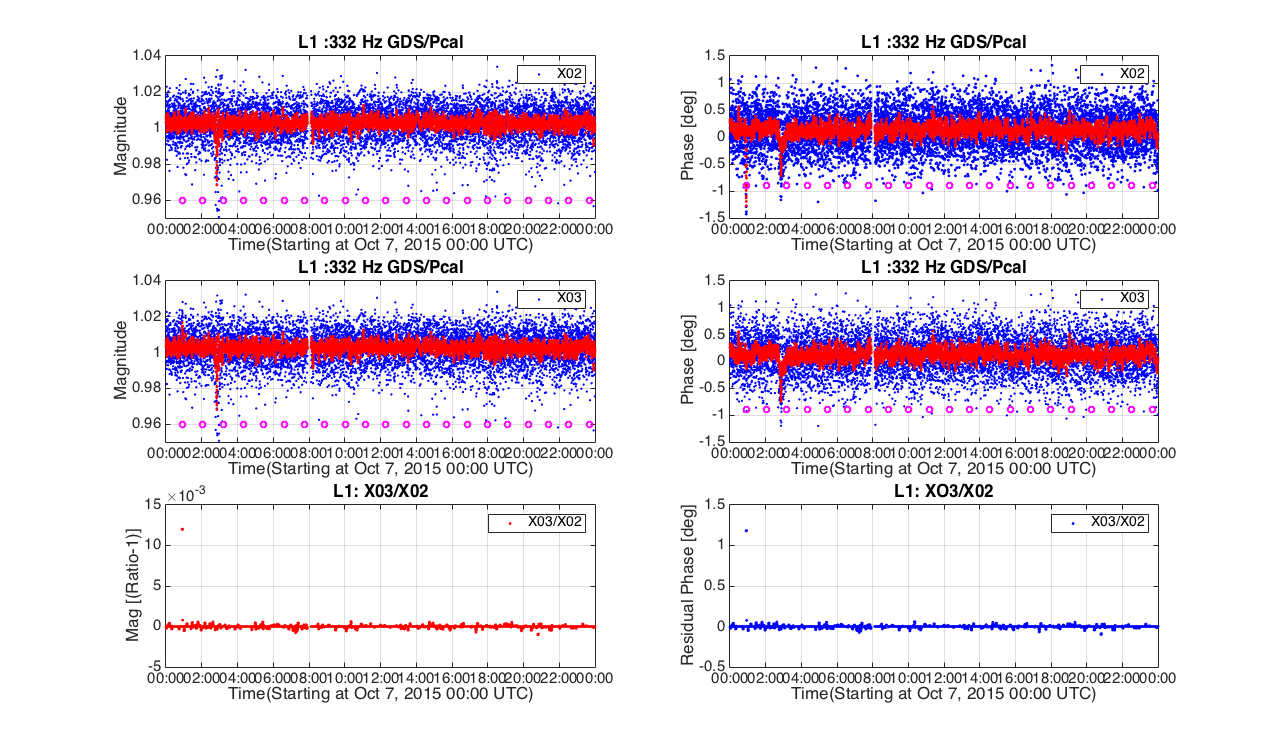
The plots attached is looking at the calibration line at 332 Hz at both H1 and L1 for X03 and X02 data for a single day (24 hr period). The data was filtered using GDS state vector greater or equal to 32767. The residual plots between X03 and X02 are auto-ranged to include all the points and the residual are pretty small for both H1 and L1
The linked matlab figure includes all 9 days worth of data and all plots are autoscaled again. The residuals are very small, except for a few outliers that are all, or mostly all, in the X02 data, not the X03 data. So, from the perspective of our SLM tool analysis, it looks like the X03 frames are an improvement and the GDS/Pcal calibration ratios at the ~330 Hz lines are very stable, near or at the 1% level.