christopher.kucharczyk@LIGO.ORG - posted 15:06, Wednesday 07 March 2012 - last comment - 16:43, Wednesday 07 March 2012(2383)
The beginning of the excitation in the ISI CDMON and IOP DAC
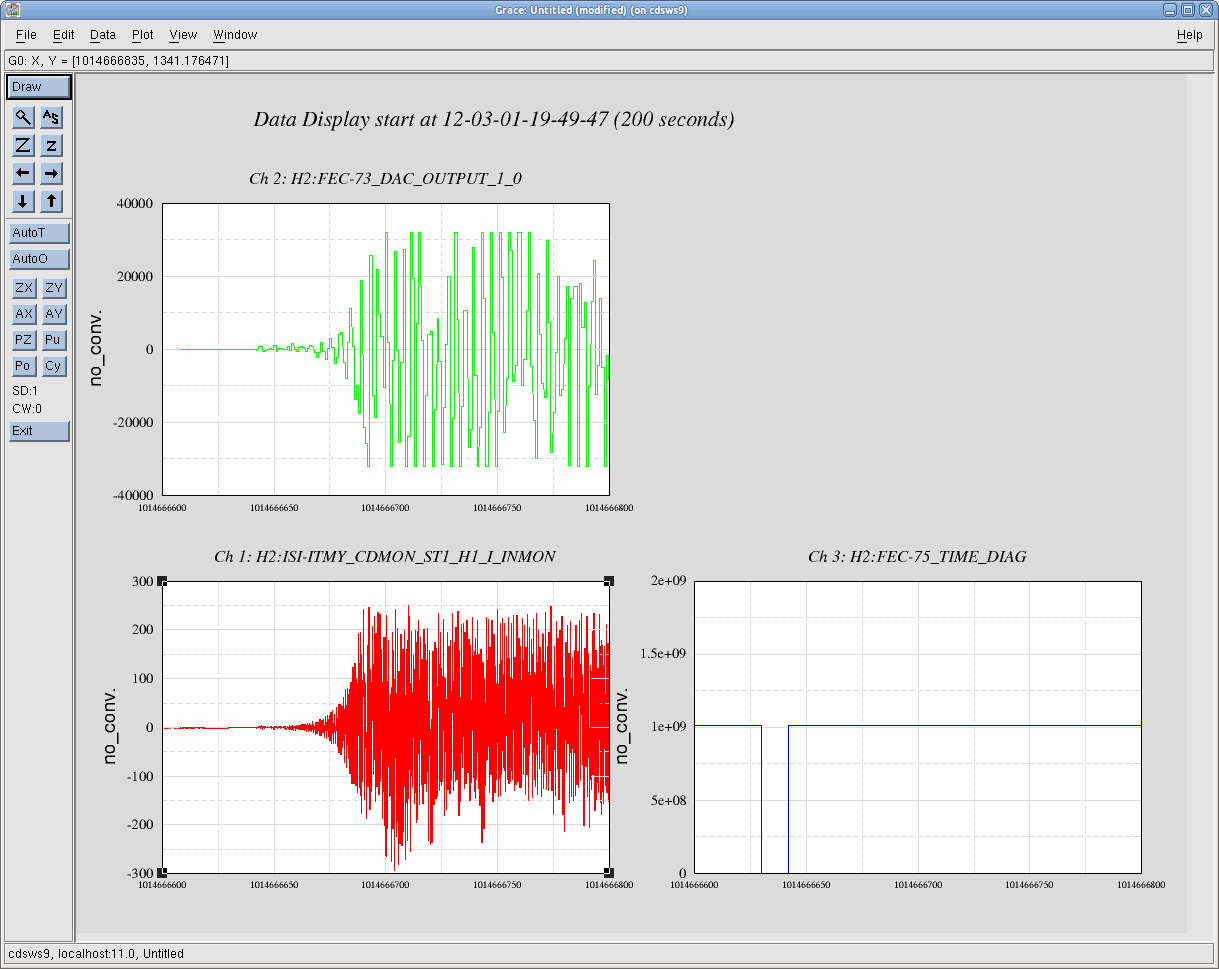
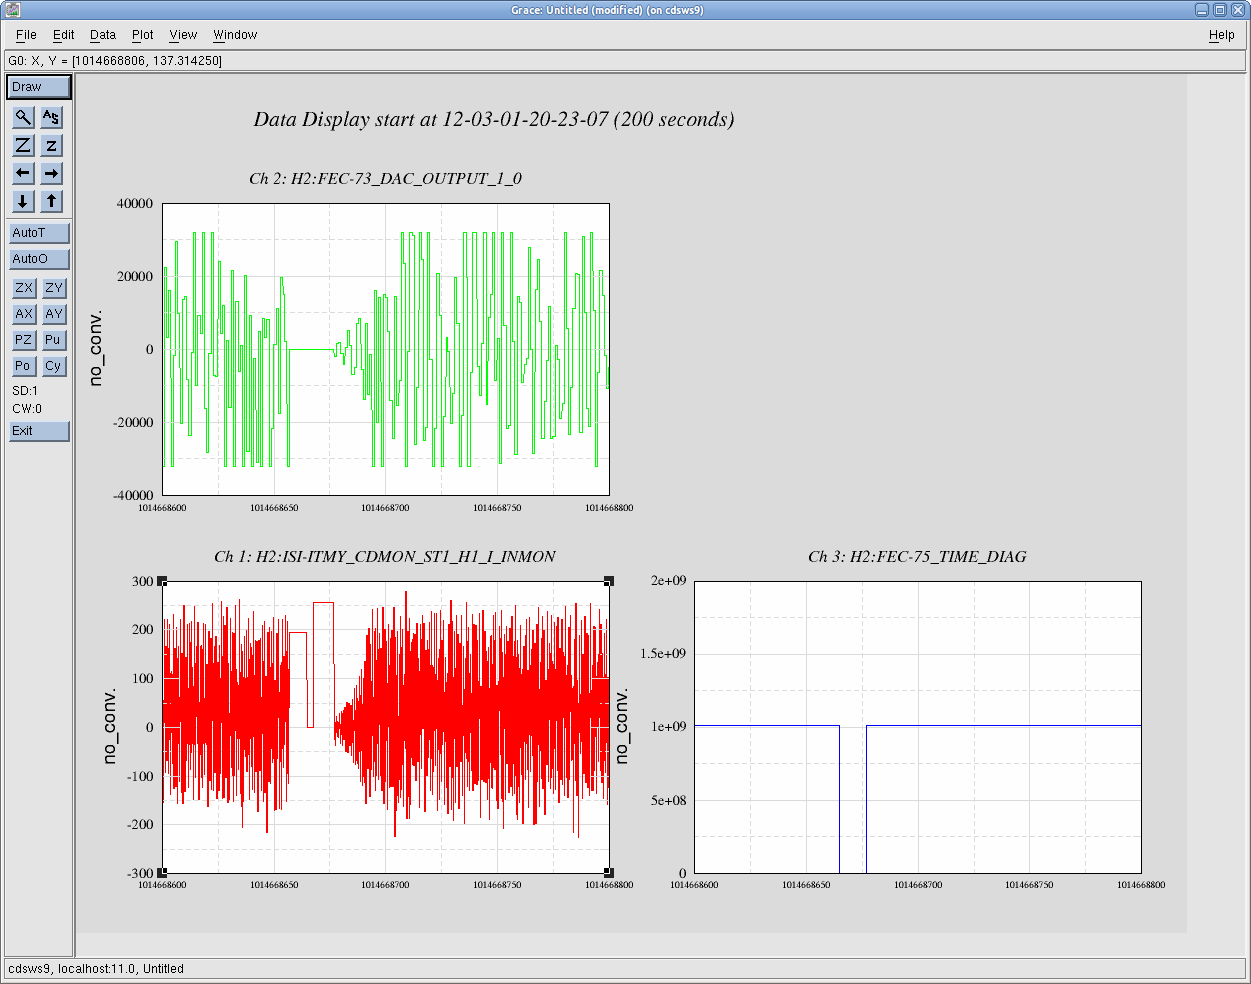
Brian and I have plotted the beginning of the (bad) excitation in dataviewer in both the ISI and IOP models. We have also plotted the GPS time according to the ISI model (DCU_ID 75). As you can see, the GPS time drops out when the model is being off, but comes back up shortly thereafter. This data is for the 11:42 UTC restart when the excitation starts.

We plot the same for the second restart, twenty minutes after which the fiber break occurs. We see the same thing - the model is shut down, then starts again. We see a similar drop in the GPS time to 0 before the model restarts. The excitations also stop when the model stops, and start again when the model restarts. We see a growth in the amplitude of the coil drive signal as well as the DAC signal from the IOP.

This is not inconsistent with a loop instability within the model.
Images attached to this report
Comments related to this report
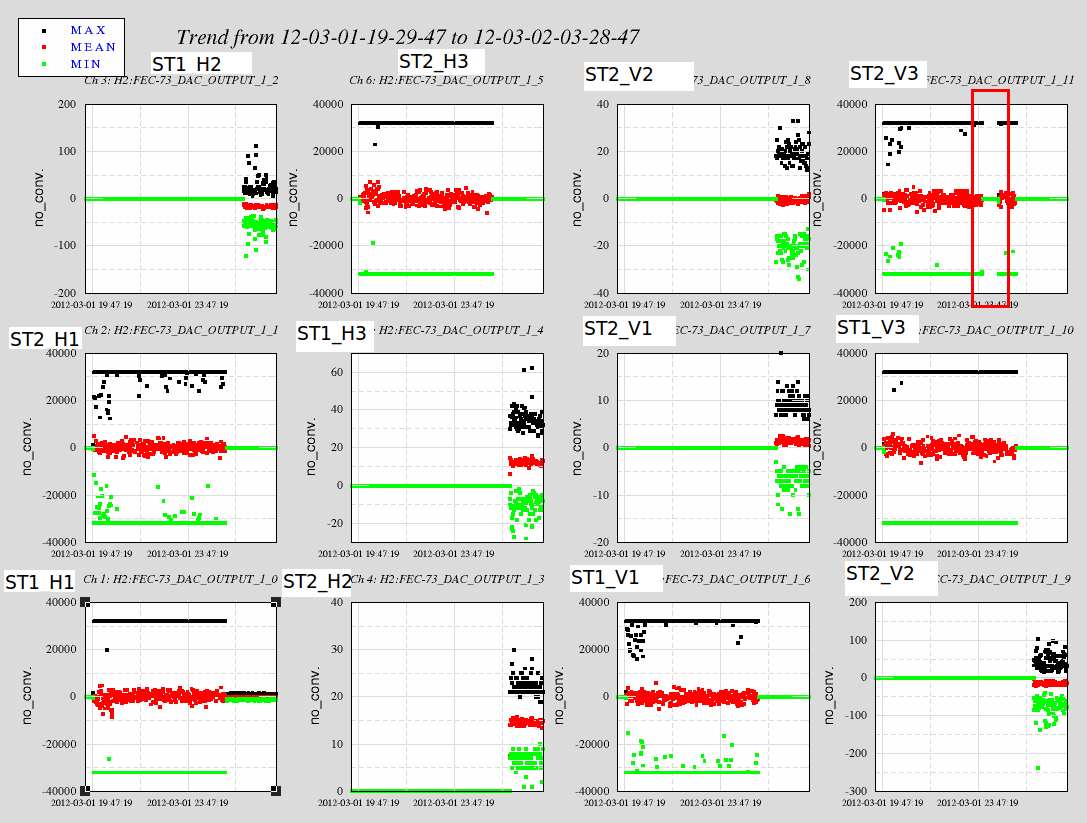
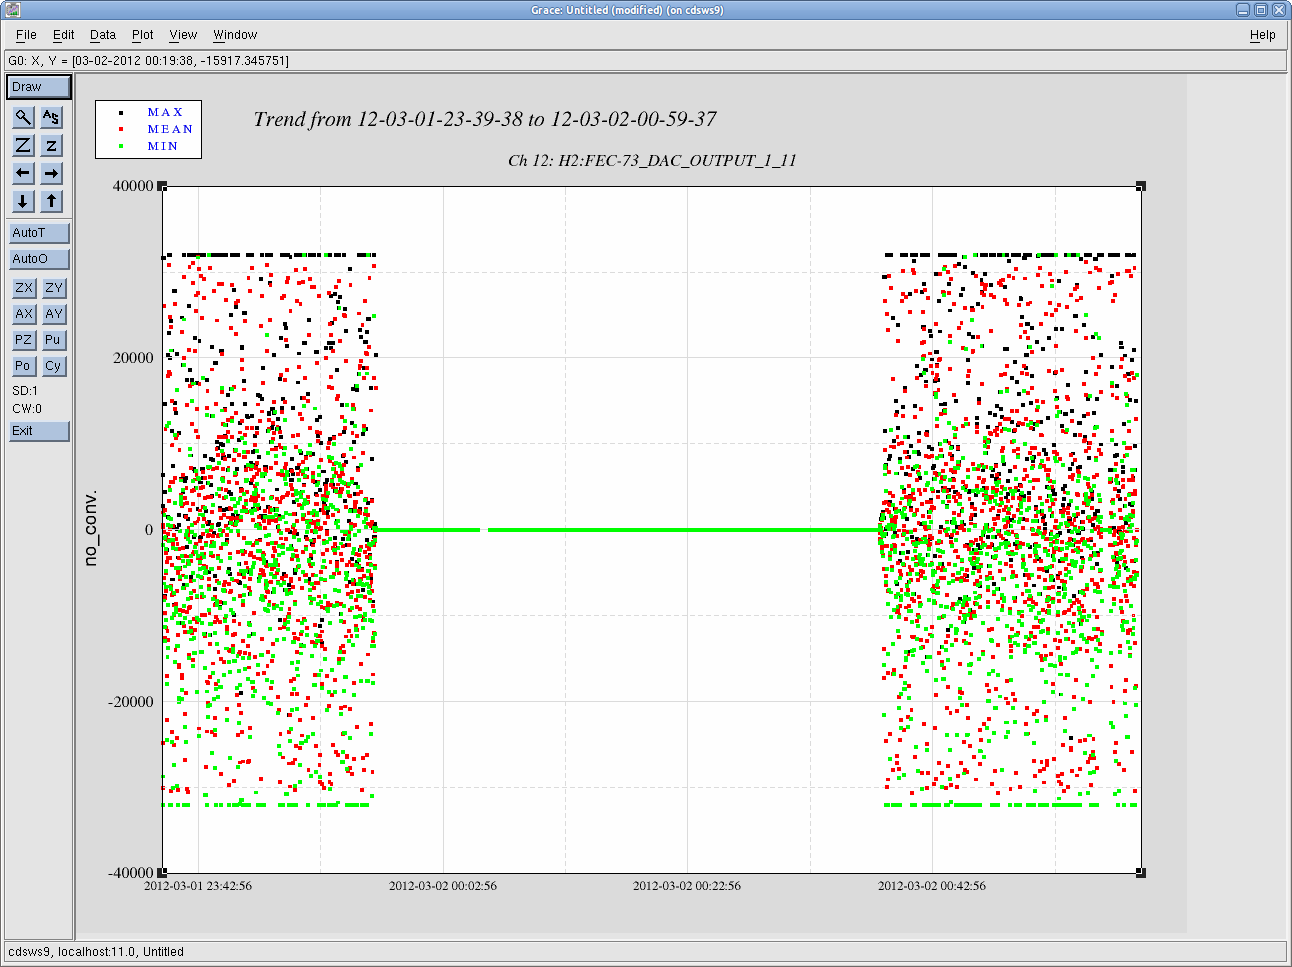
We have also plotted the actual signals that the IOP was driving during the entire event. What's most interesting is that the signals on all channels appear to be max-ed out during the whoe event, except for ST2_V3, which drops out about five or six hours into the excitation, then returns upon a later model rebuild. The signal drops out after the 15:57 PST rebuild and returns after the 16:38 rebuild. Unsure what this entails.
Images attached to this comment