keith.riles@LIGO.ORG - posted 14:00, Thursday 03 December 2015 (23935)
How long does it take to see the narrow H1 lines below 100 Hz?
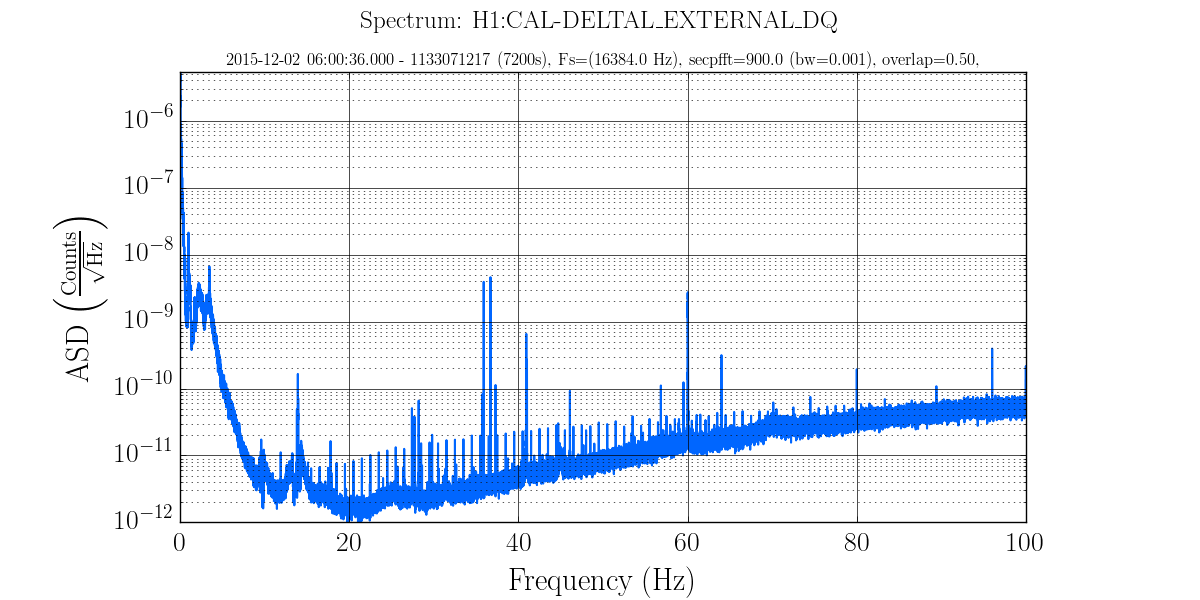
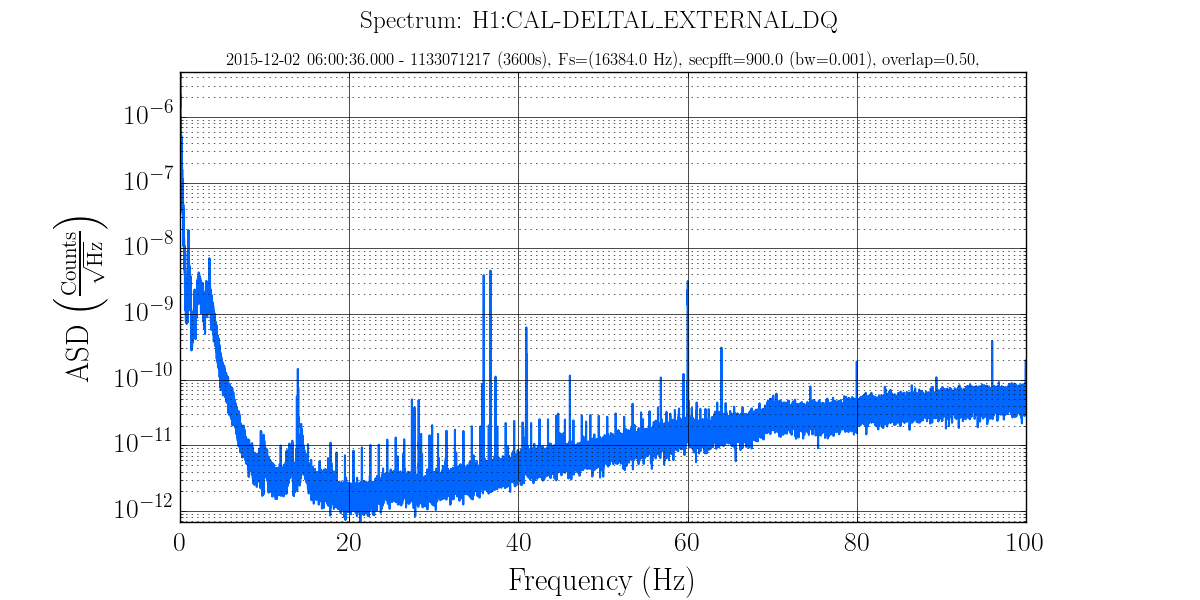
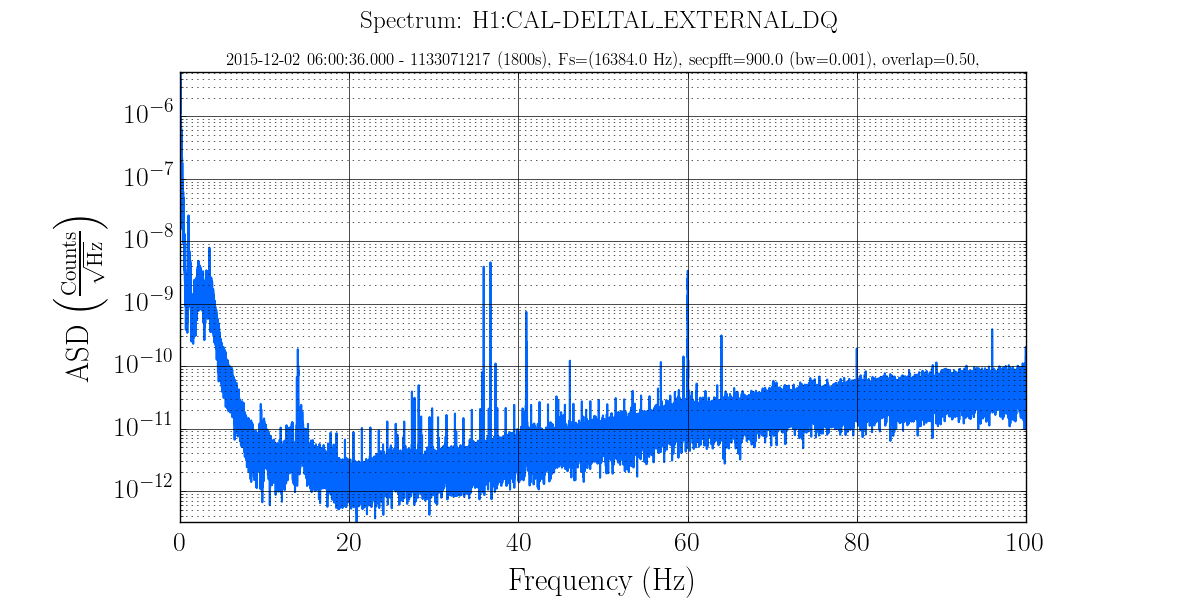
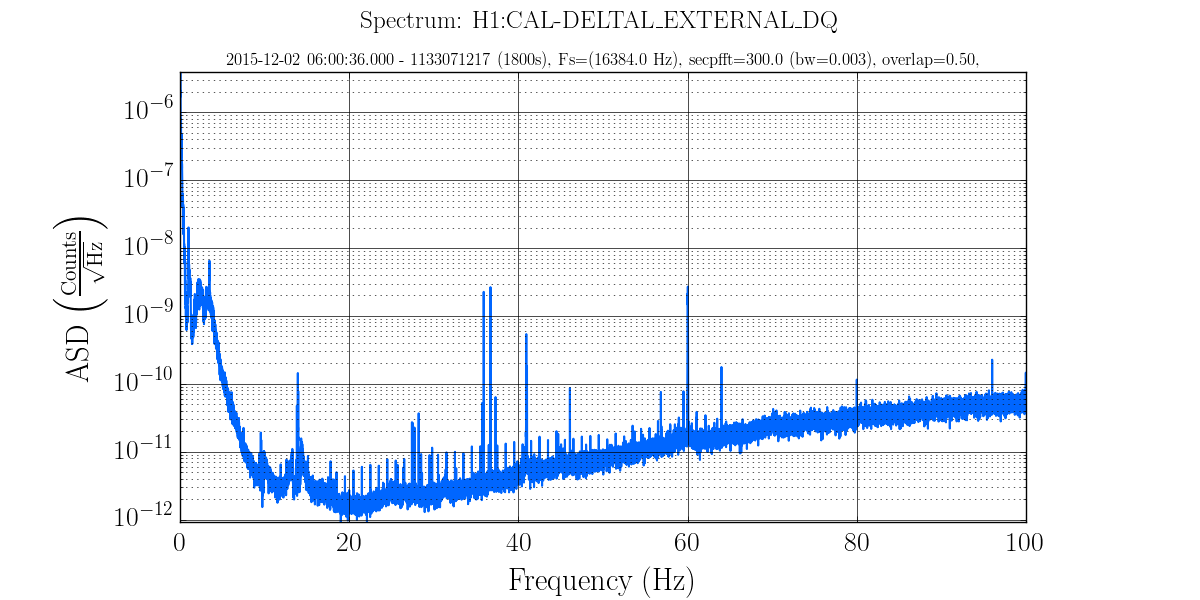
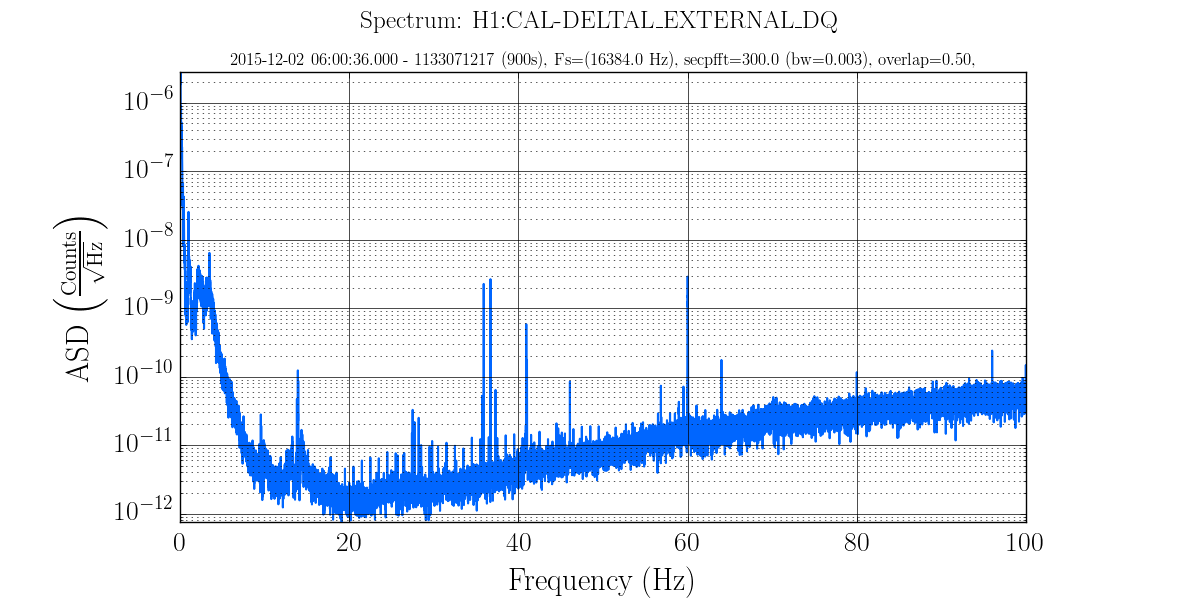
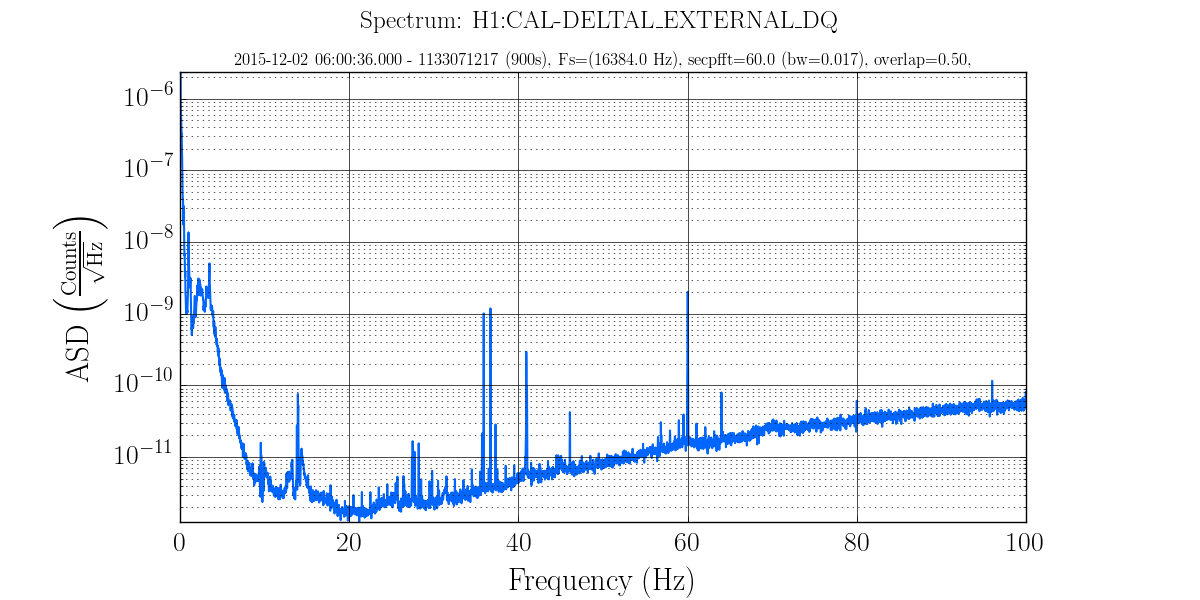
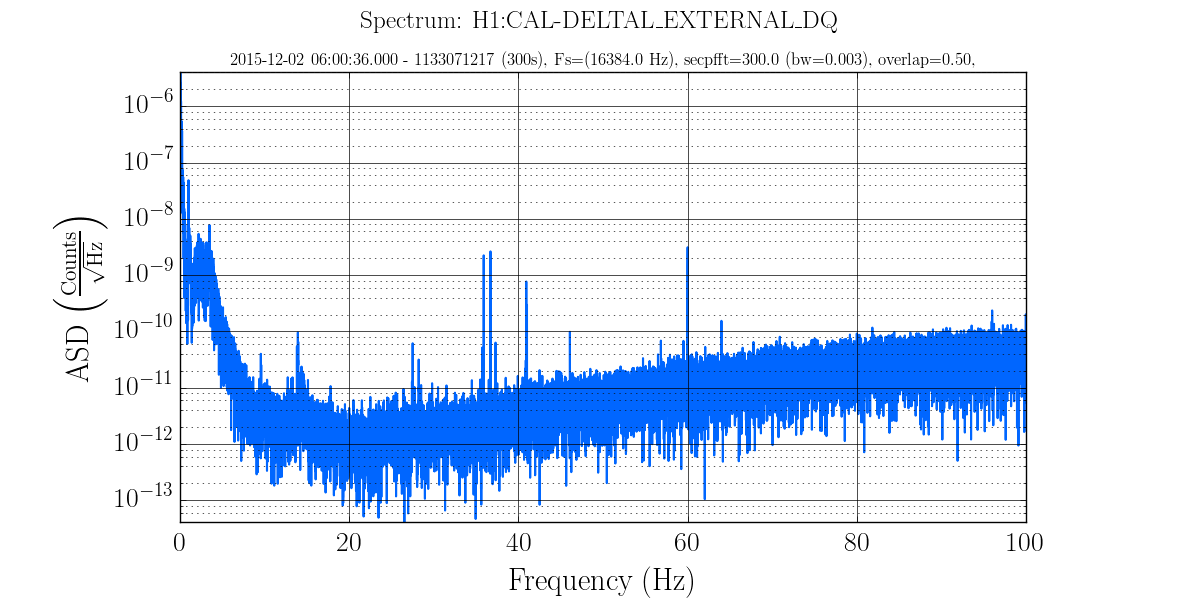
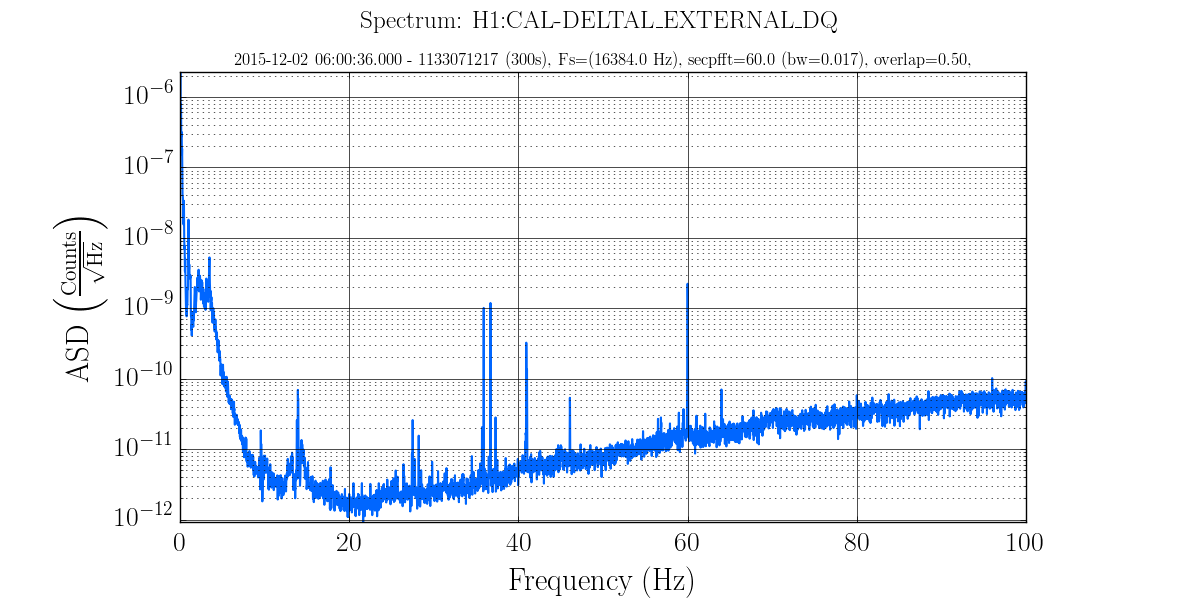
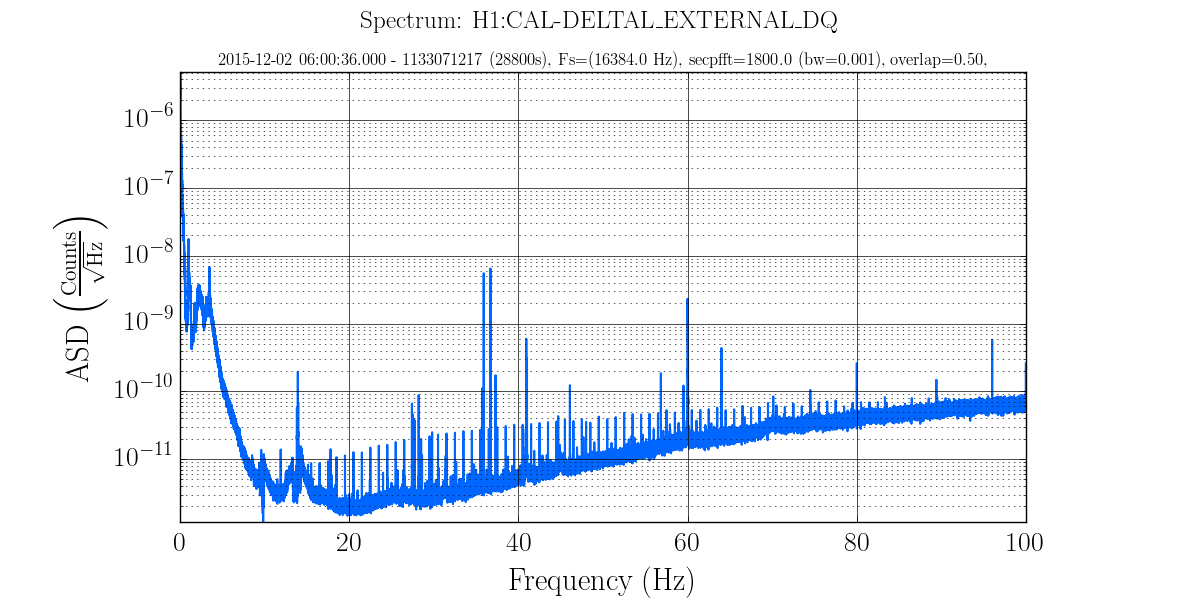
Prompted by a plot I showed at todays JRPC call of the forest of narrow lines visible below 100 Hz in a typical
daily FSscan normalized spectrum (based on a day's worth of 30-minute FFTs), Jeff asked me
how much data one needs to see these lines when trying to investigate them. Below are some
ldvw spectra from this week for a variety of total observation times and FFT coherence times,
starting with long times and moving toward shorter times. From these spectra, I would say
that 15 minutes of observing time with 1- or 5-minute FFTs could be adequate to see if a
particular change has made the stronger lines go away completely, but one would need
to go to longer times to quantify small relative changes in strength.

To see weaker lines, one can go to longer observation times and longer coherence times
(see last figure).

Figures:
1 - 2 hours of 15-min FFTs
2 - 1 hour of 15-min FFTs
3 - 30 minutes of 15-min FFTs
4 - 30 minutes of 5-min FFTs
5 - 15 minutes of 5-min FFTs
6 - 15 minutes of 1-min FFTs
7 - 5 minutes of a 5-min FFT
8 - 5 minutes of 1-min FFTS
9 - 8 hours of 30-min FFTs
Images attached to this report