jeffrey.kissel@LIGO.ORG - posted 15:39, Tuesday 15 December 2015 (24241)
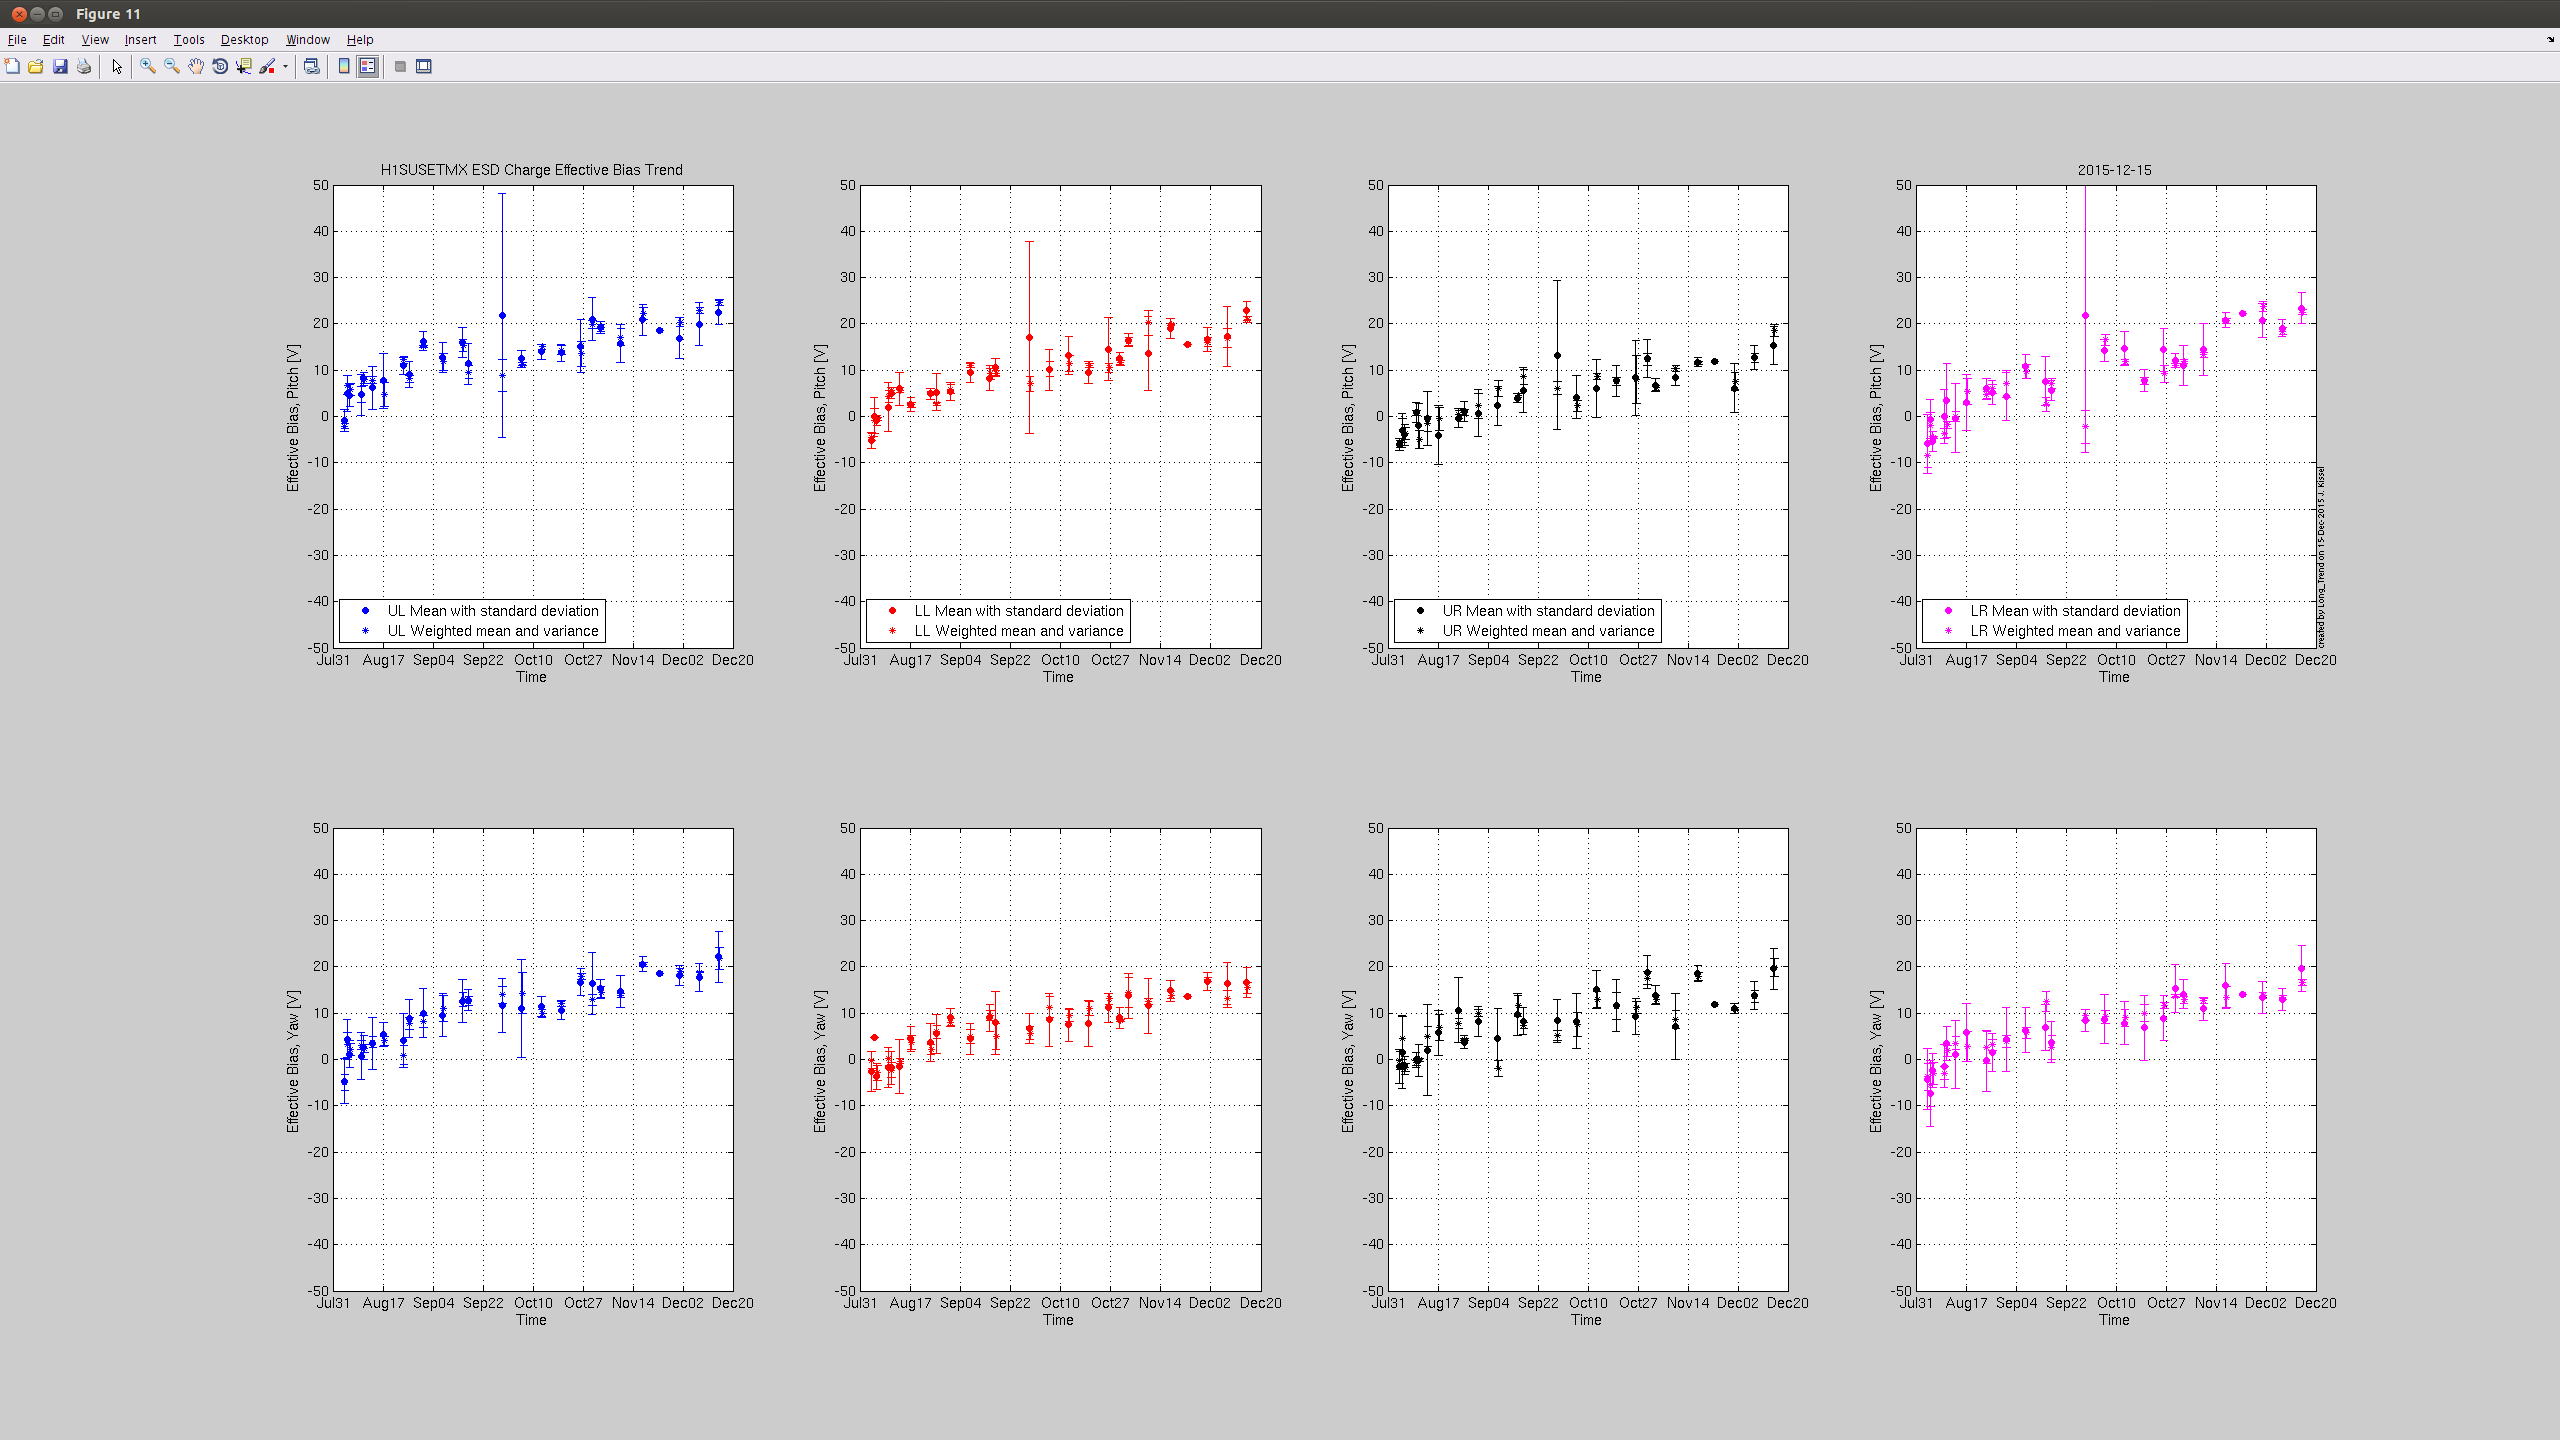
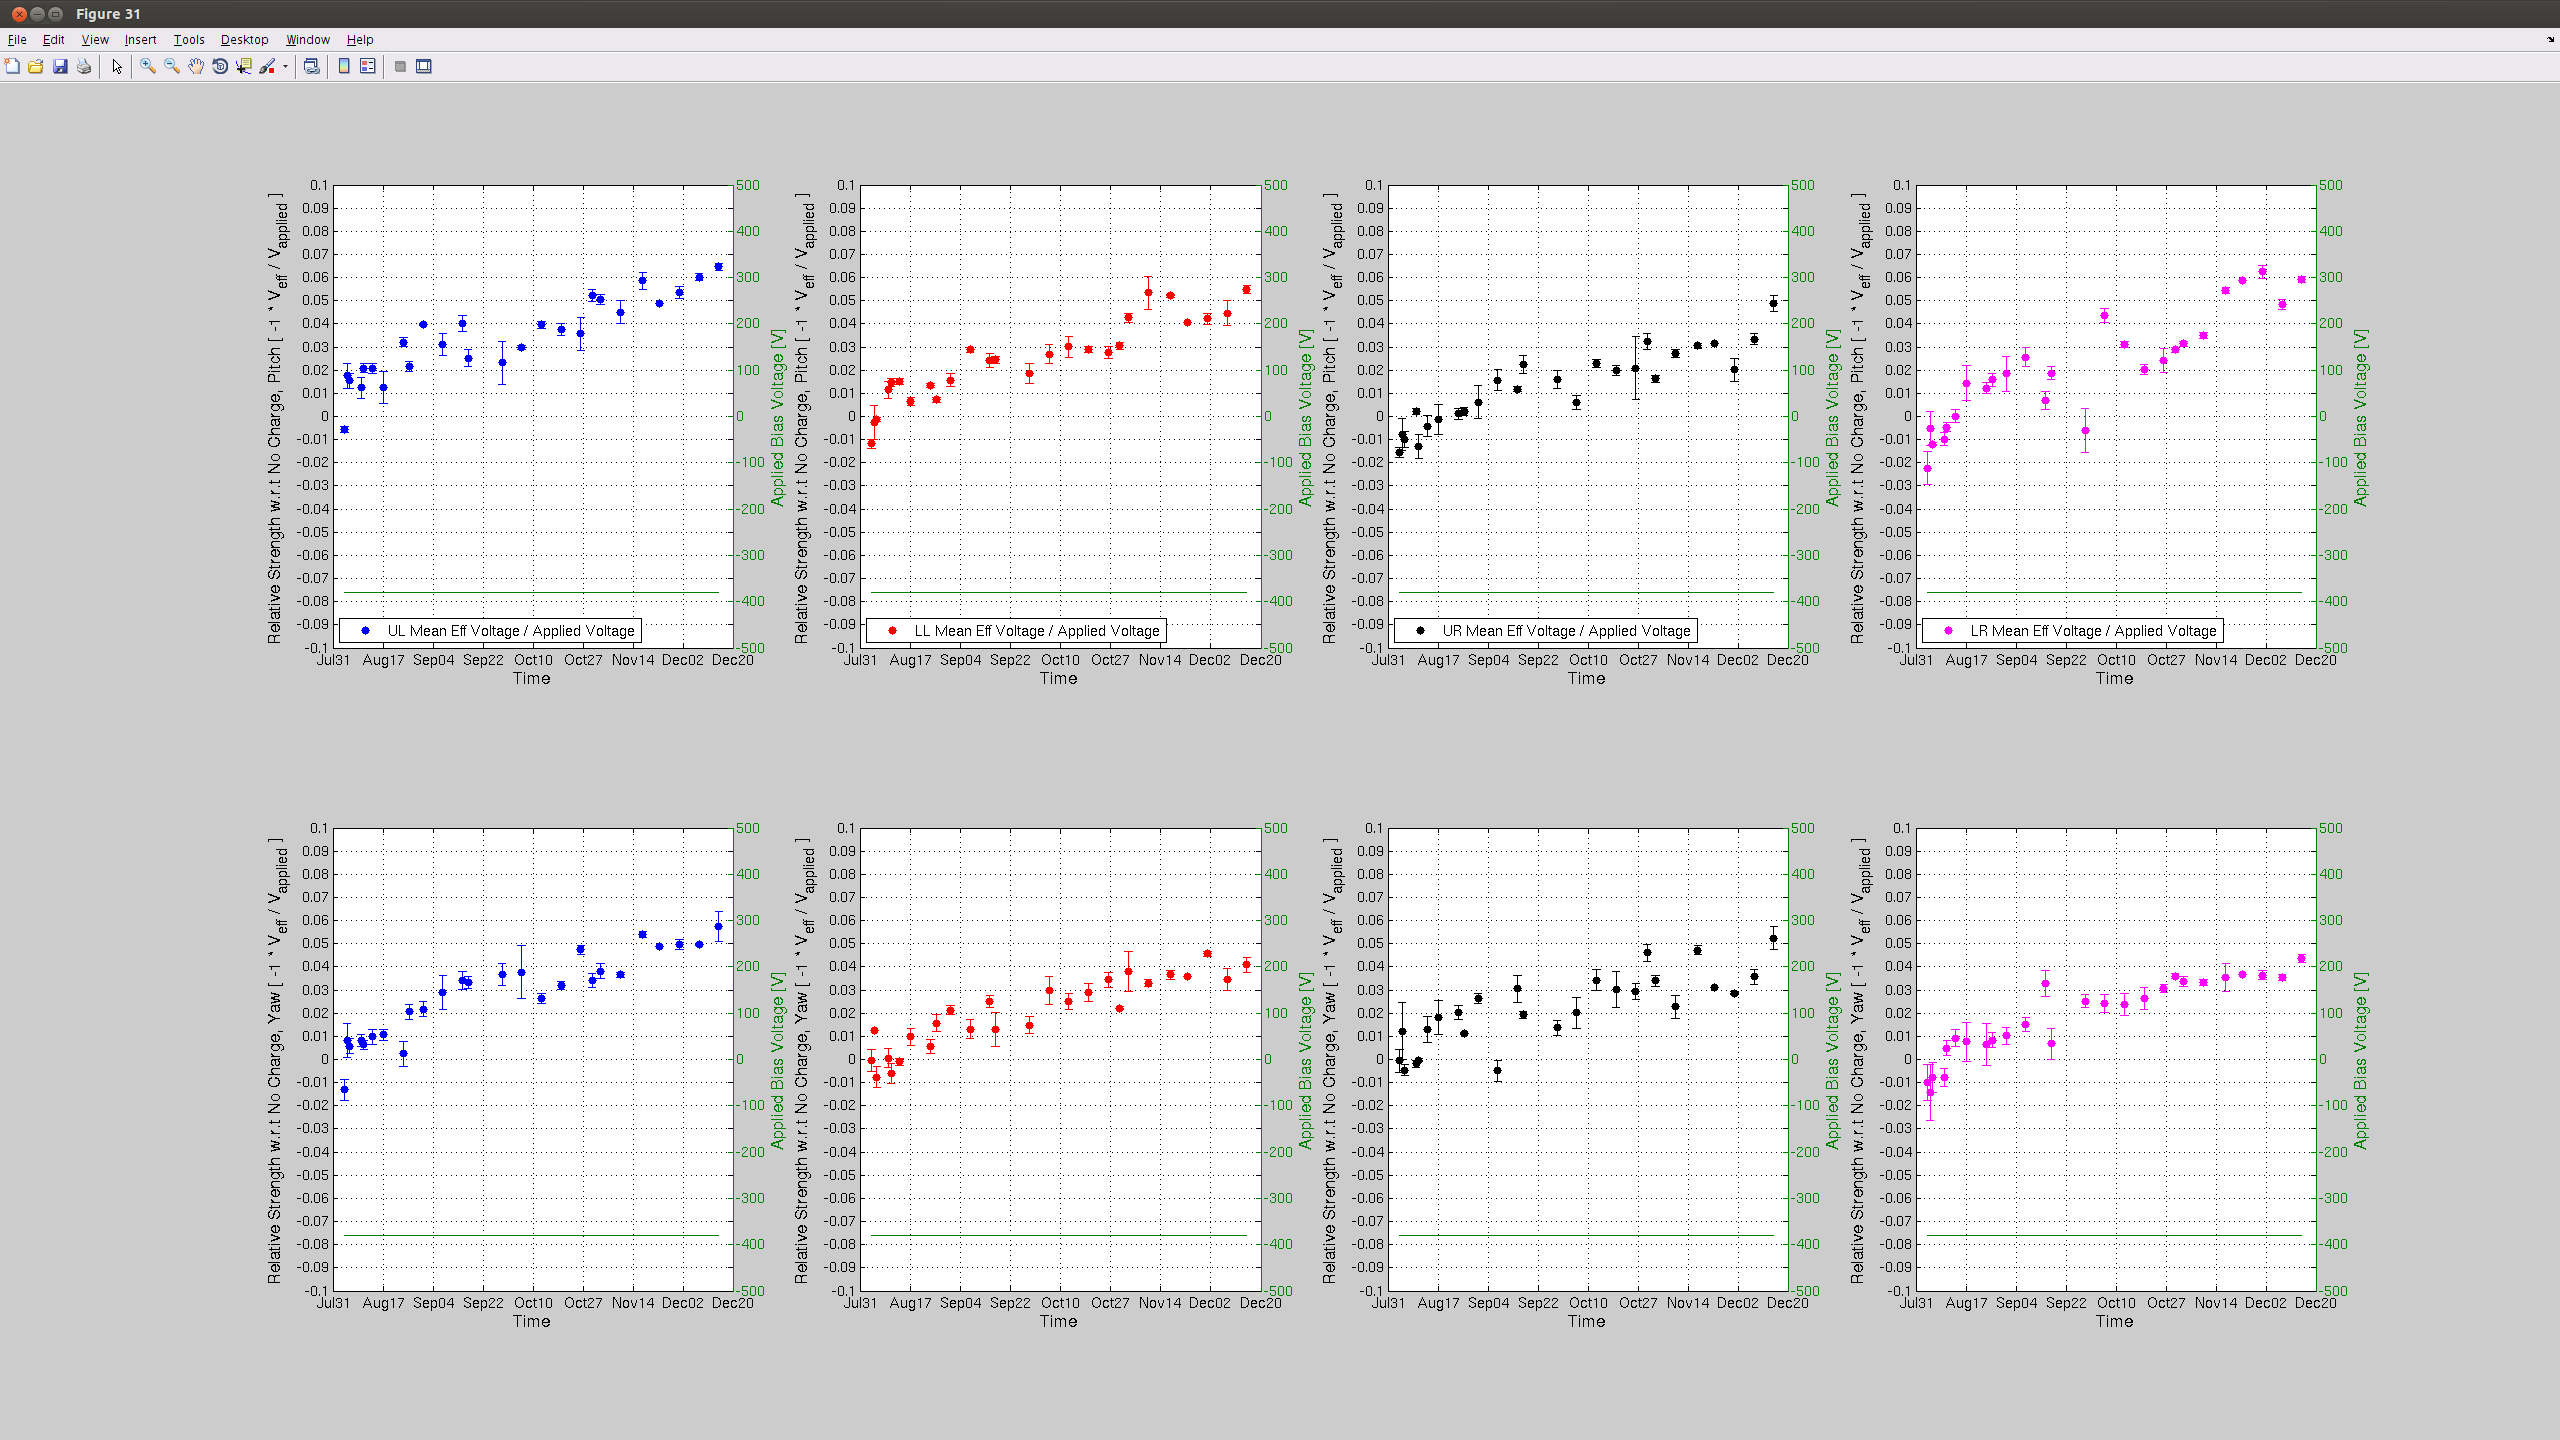
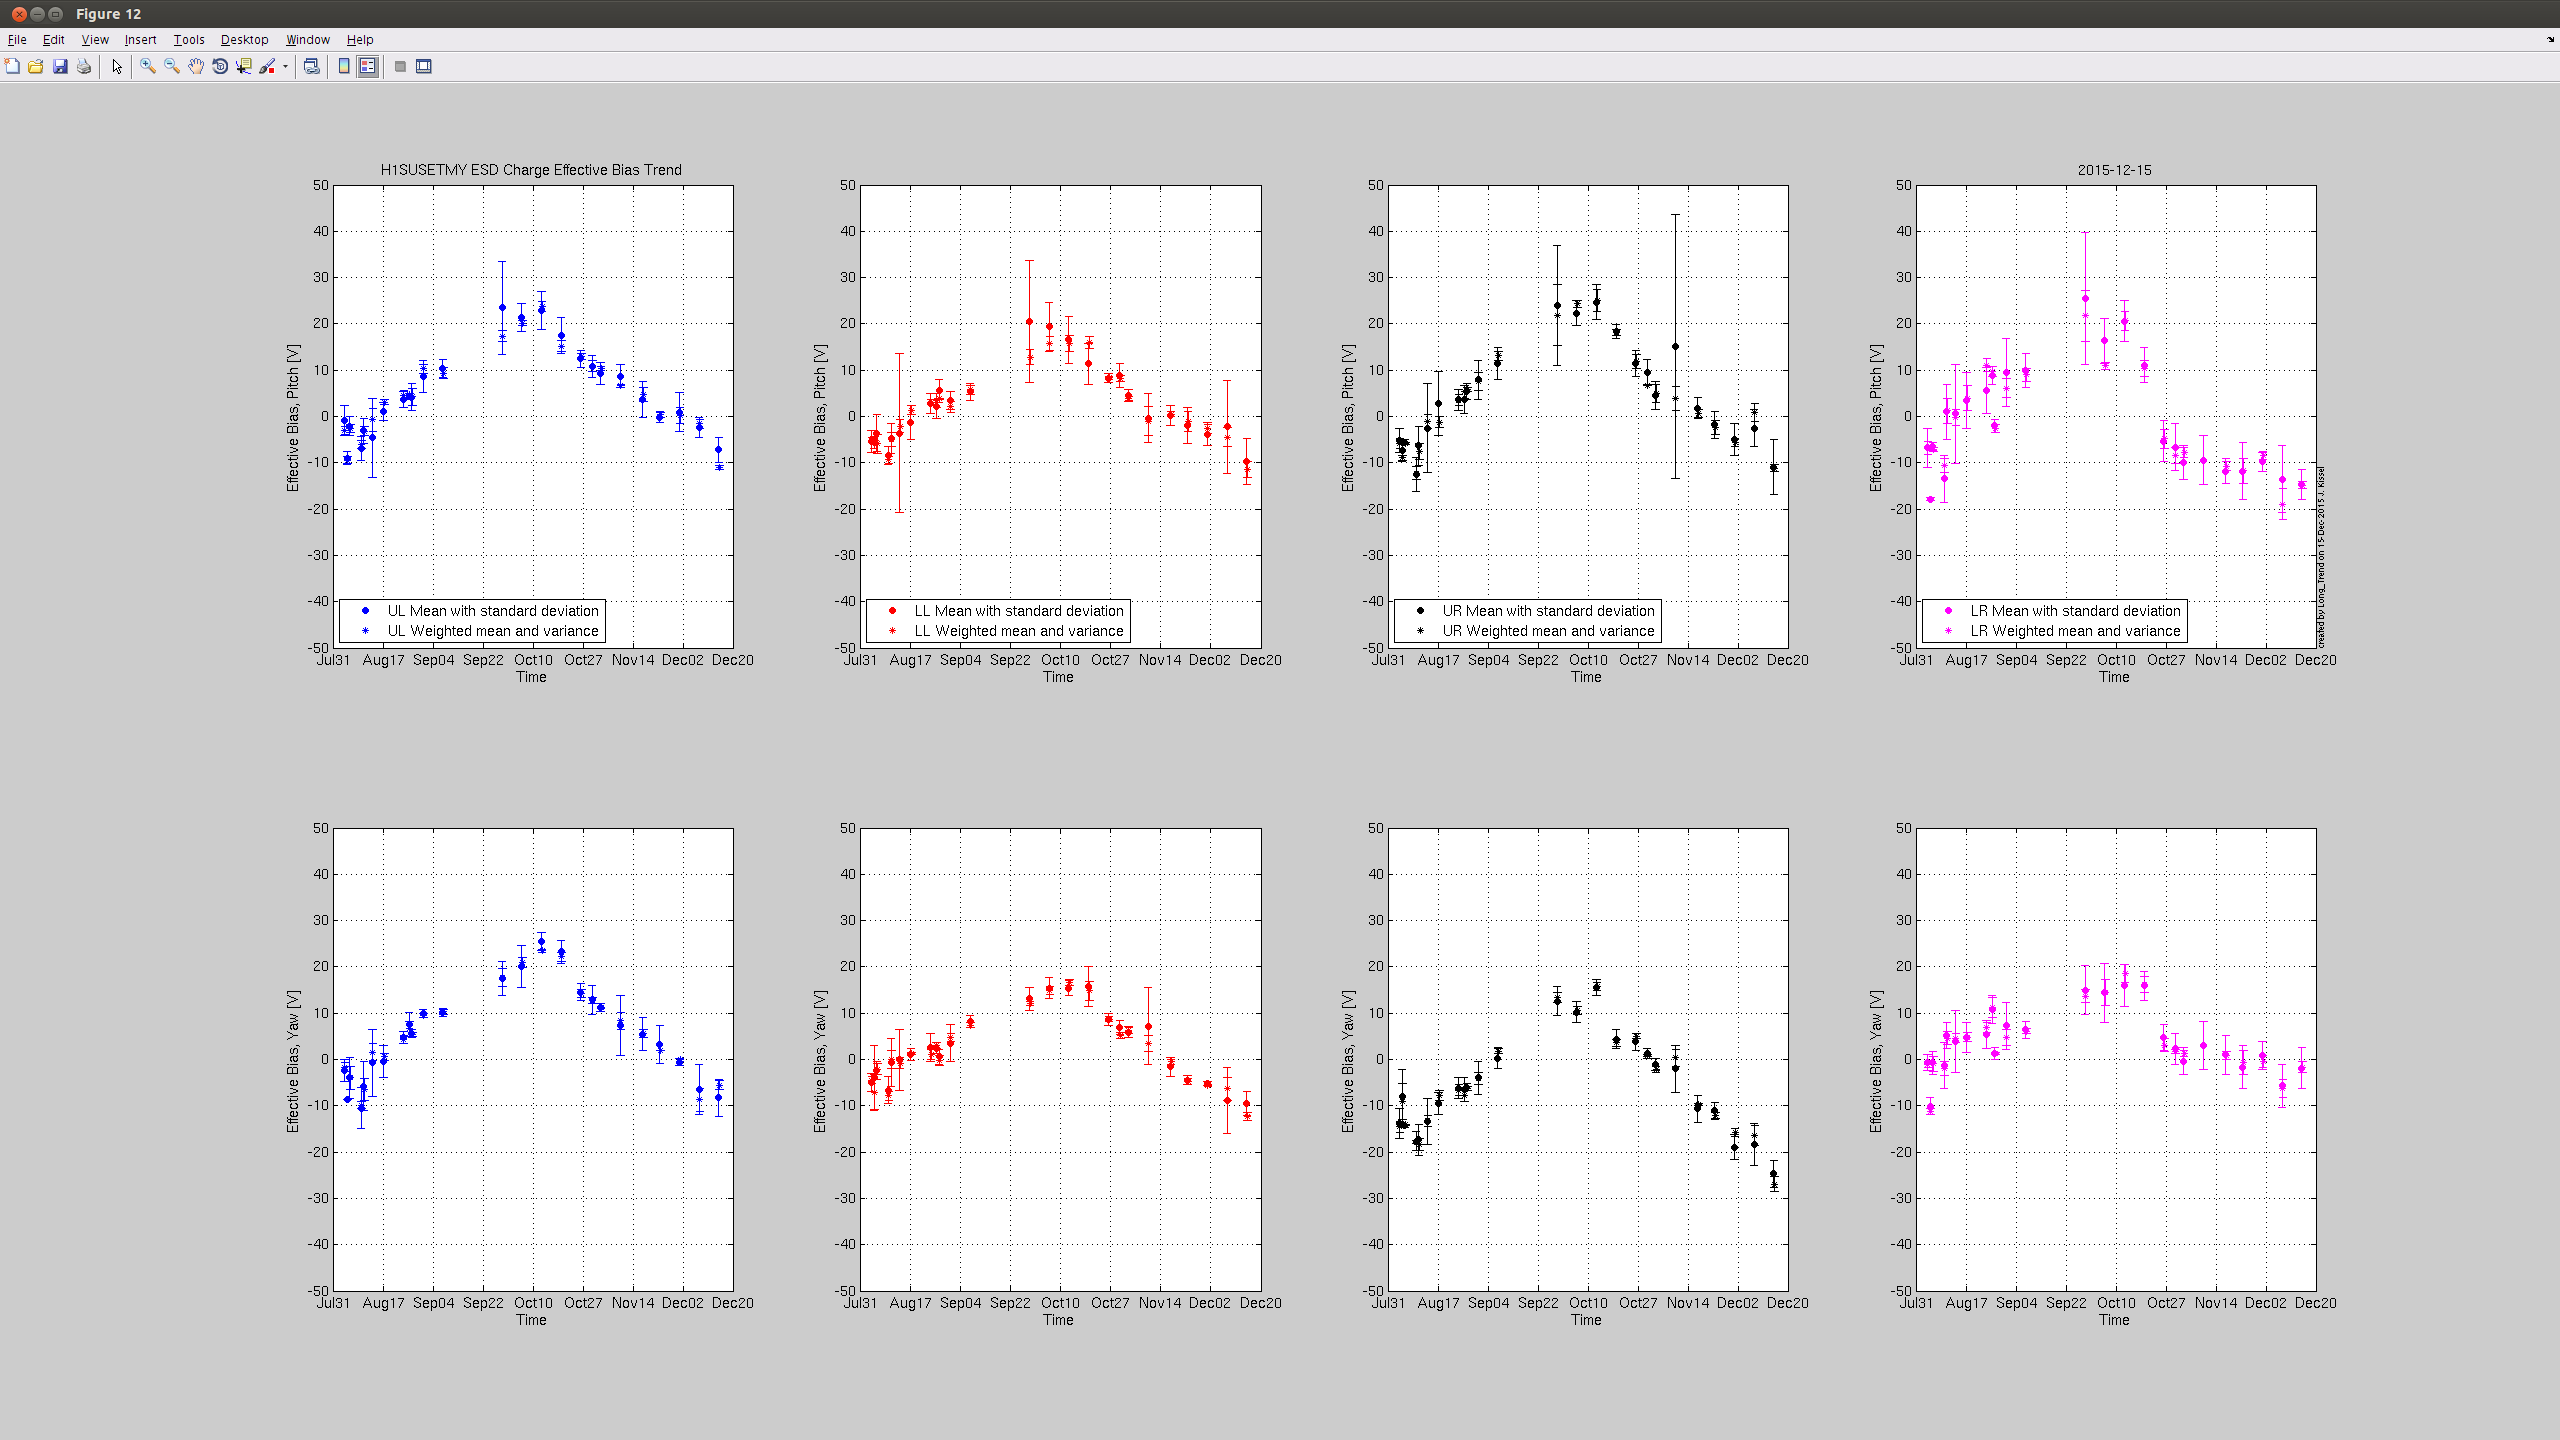
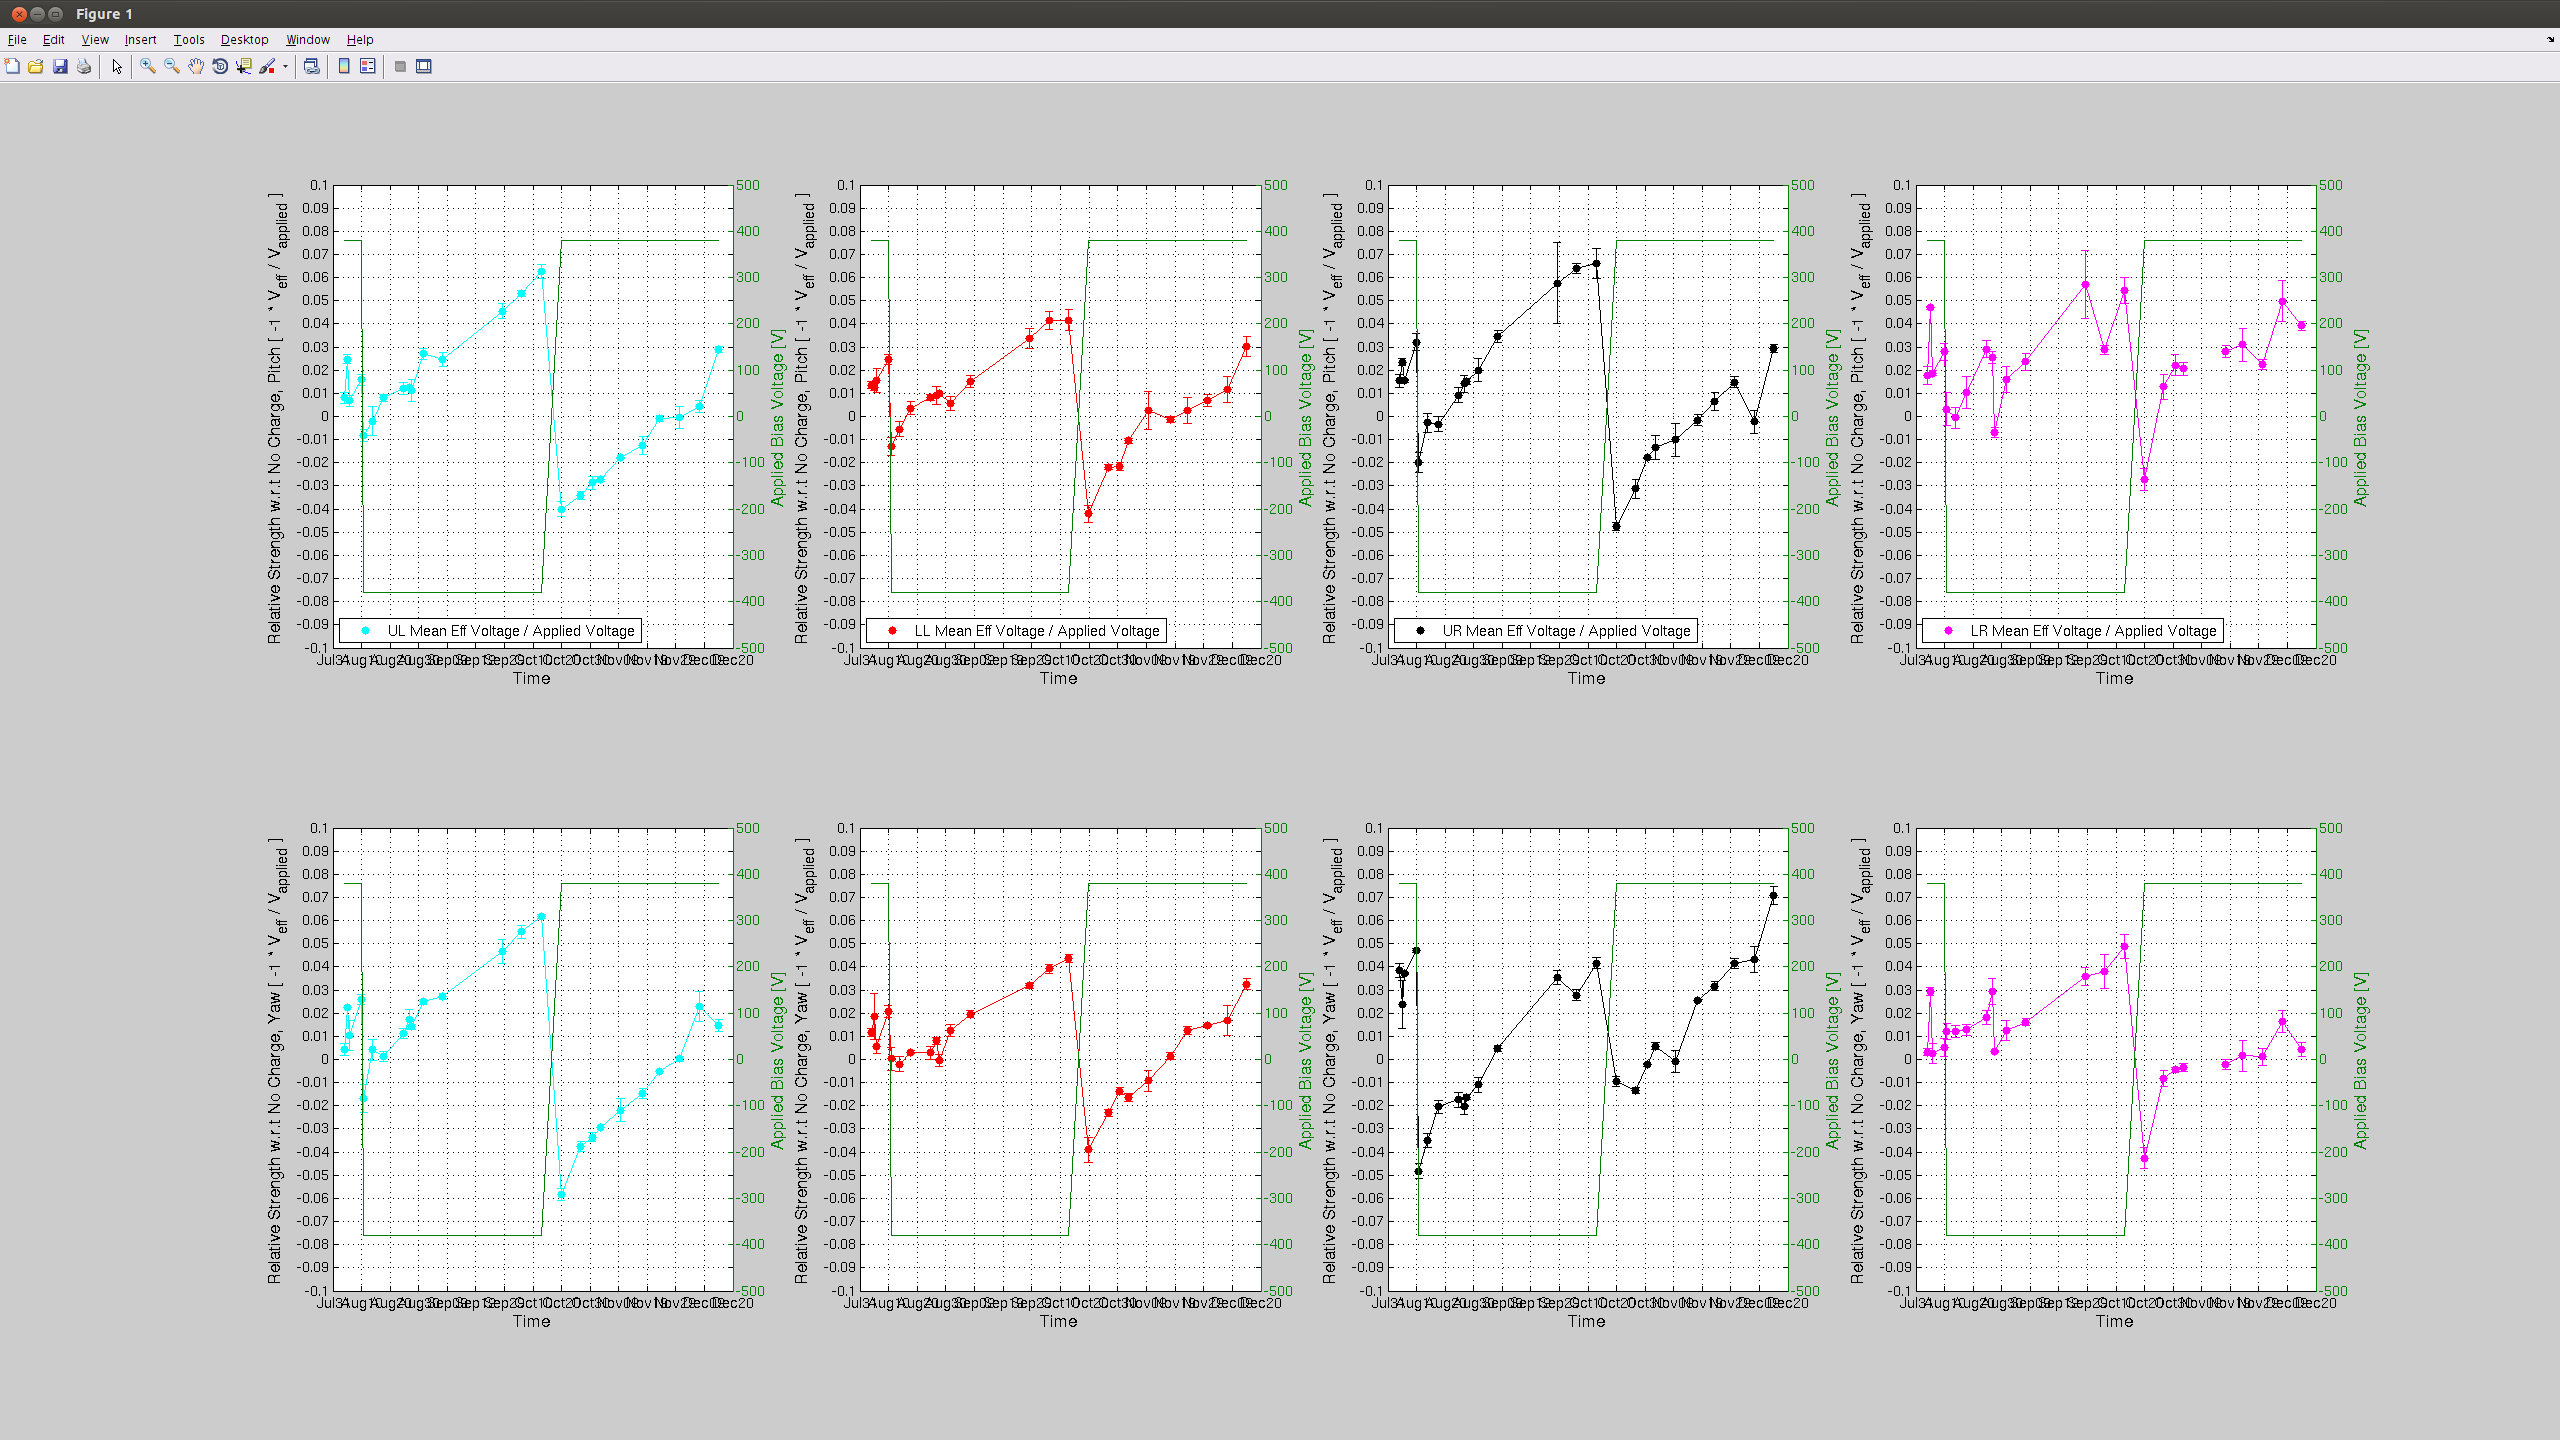
Charge Measurement Update; EY UR Quadrant Surpasses 30 [V], but Long. Actuation Still OK ... For Now
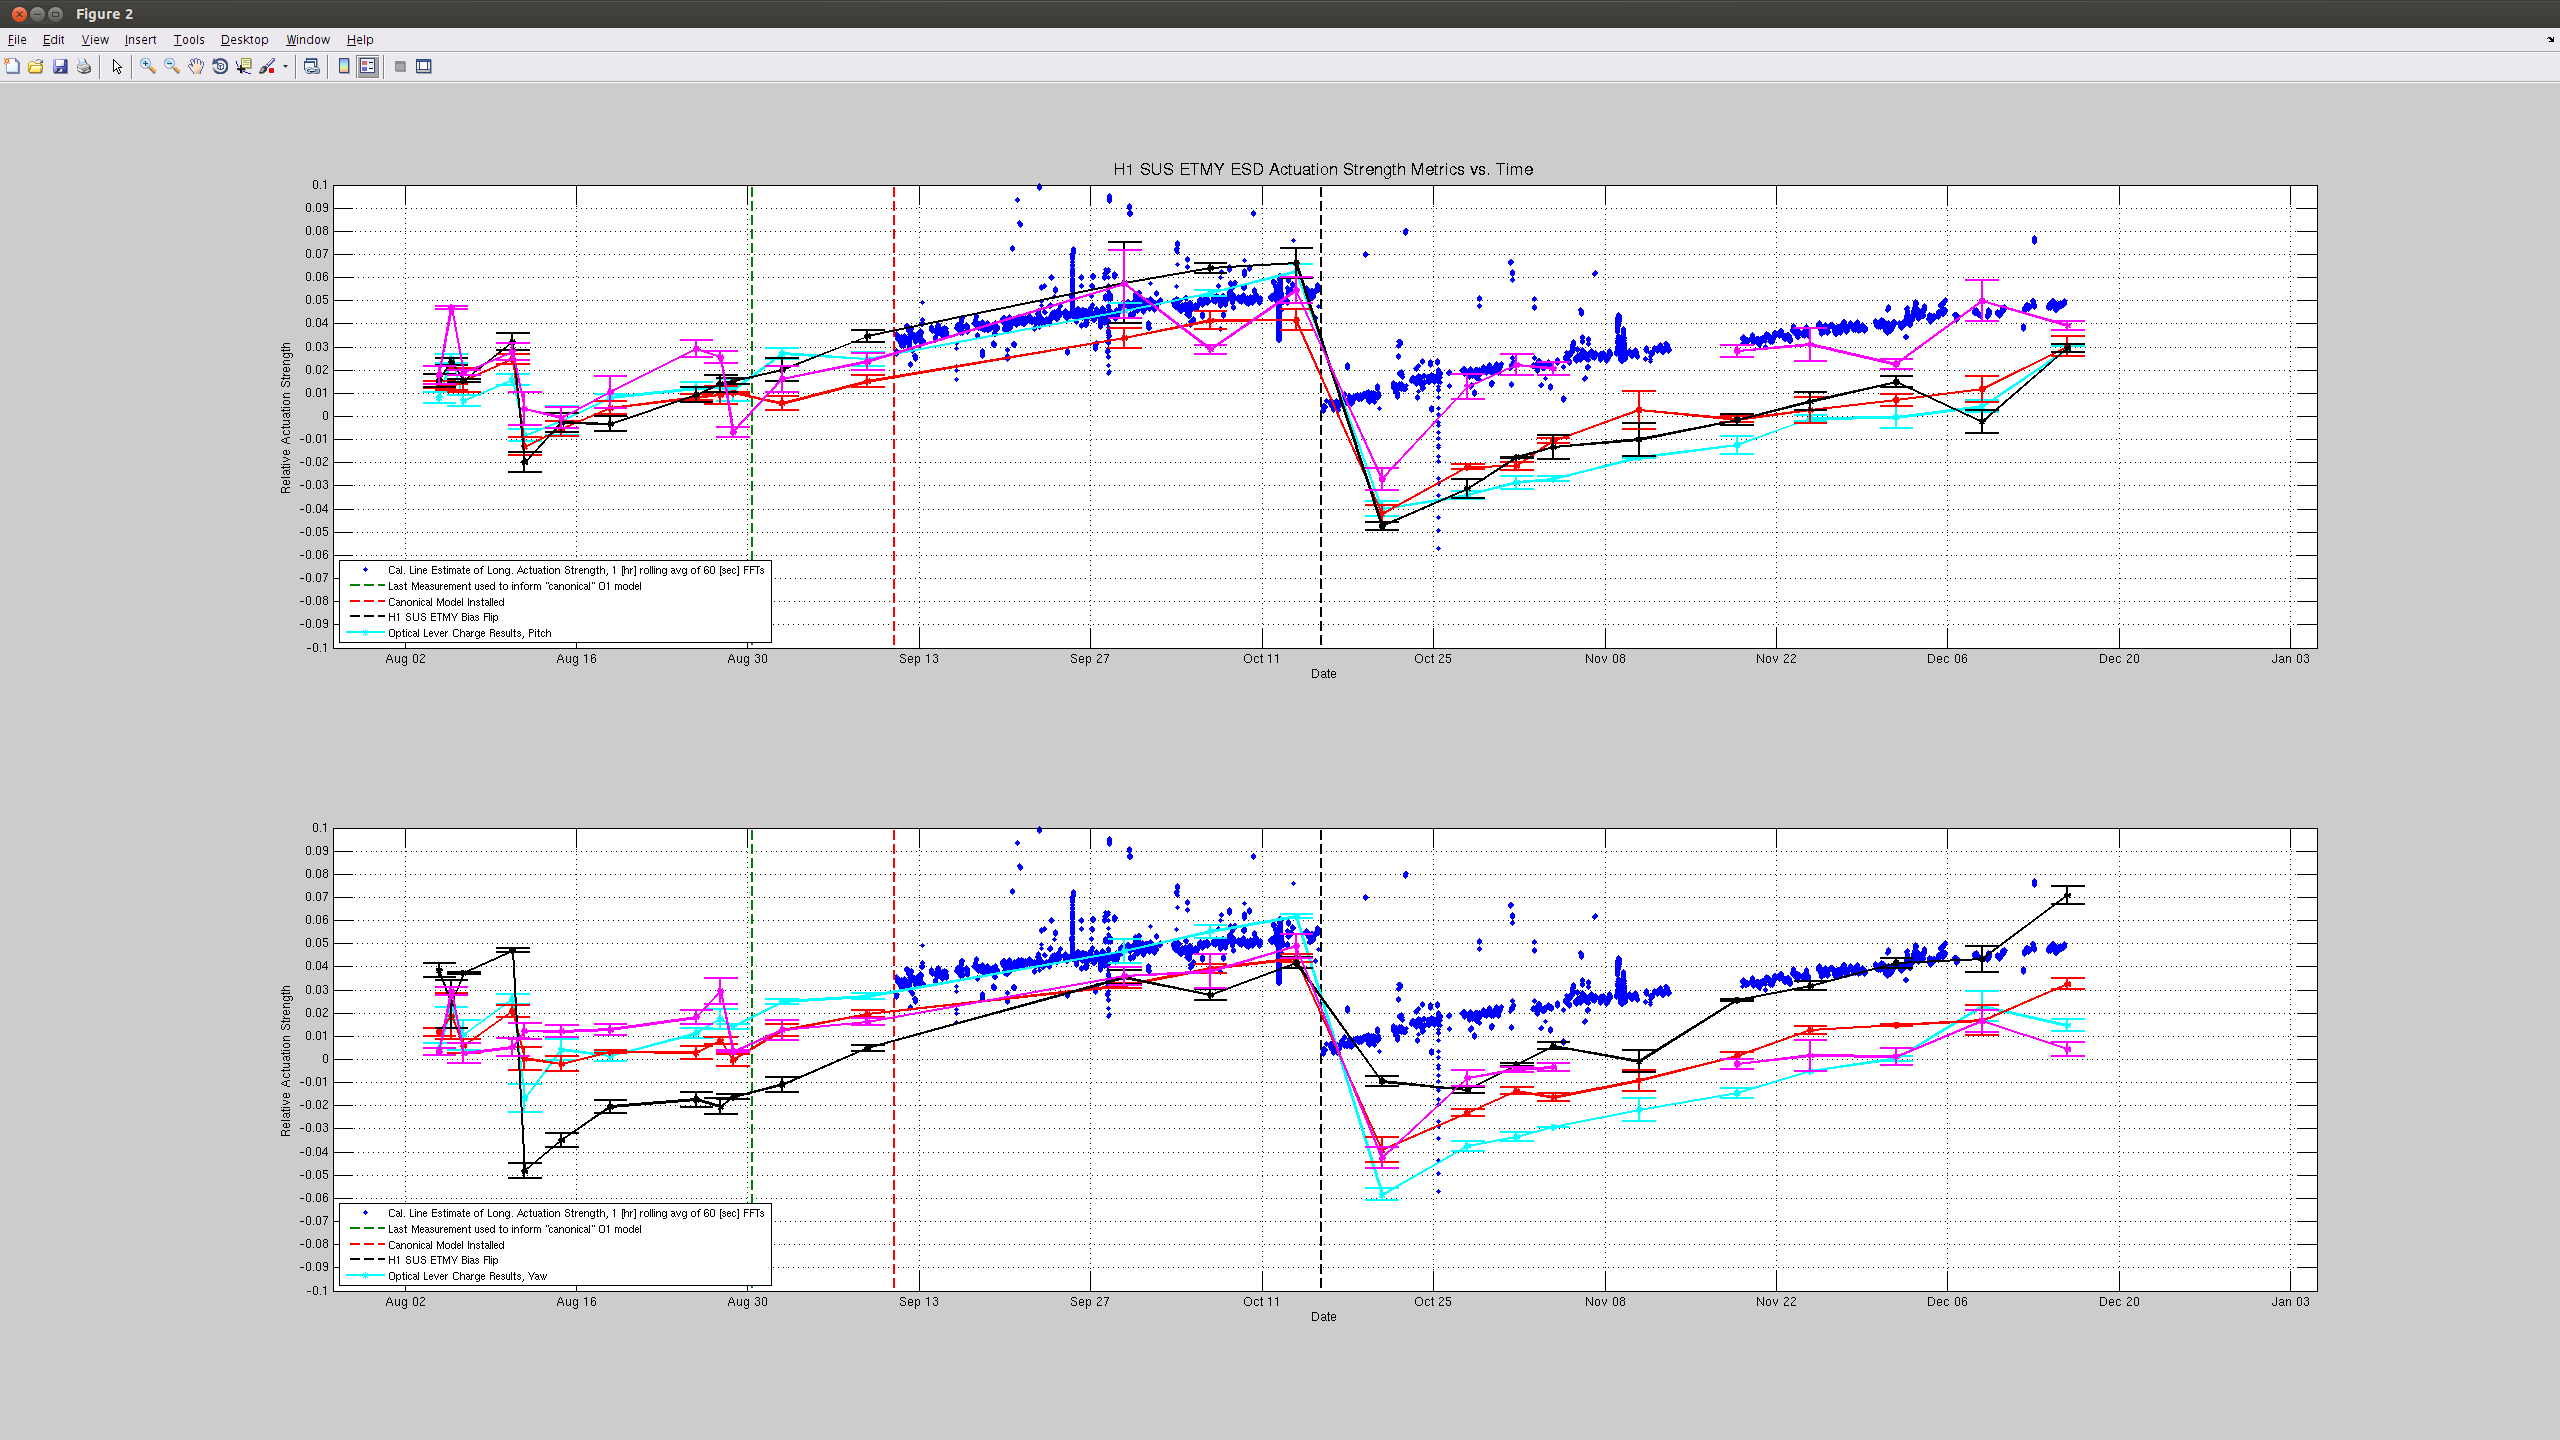
J. Kissel

Gathered the weekly charge measurements today, and -- because we're getting close to the (prior) threshold for flipping the ESD bias sign on ETMY, and we weren't sure if we were seeing a convincing pattern / trend of charge accumulation / slow-down (see LHO aLOG 23866) -- gathered the longitudinal actuation strength as well.

The messages:
- ETMX = still fine. No worries there.
- ETMY =
    - The ETMY UR quadrant, measured in Yaw has now surpassed -30 [V] effective bias voltage according to the optical lever measurements. This was level at which we'd flipped the bias last time; when 3 or 4 out 8 measurements had shown ~ -30 [V]. (see LHO aLOG 22561 and LHO aLOG 22135)
    - All other quadrants are only at roughly -10 [V] effective bias, including the Pitch measurement for the same quadrant.
    - This quadrant (as measured by Yaw) is definitely charging faster than the other quadrants (again, as measured by Yaw), and the relative actuation strength in Yaw is already back to +7% of the reference time.
    - The longitudinal relative actuation strength has not changed as much, it has only trended to 5%. Still difficult to say whether there is a significant decrease in the rate of strength change (let's call it the deceleration of actuation strentgh). By eye, you could easily convince yourself that the rate of change is decreasing, but if you gather data points in the longitunal strength spaced ~two weeks apart, the rate is inconsistently jumping around 0.7 - 1% of change per 2 weeks, or 0.4 - 0.5% per week.

There's 1 month left in the run, or 4 weeks. So, if 5-6% of relative actuation strength discrepancy from the reference time is our threshold (like it was for the last flip) then we'll need to do the flip before the end of the run.

As usual, you can ask "we'll what's LLO doing?" They have actuation strength discrepancy of the test mass stage w.r.t. their reference time  also at roughly 5%. They had made noise about fixing it (not by flipping the bias, but by creating a new reference model) two-three weeks when they were first investigating their 10 [Mpc] drop problems (e.g. LLO aLOG 23488), but they've not pulled the trigger since (which I prefer!!). However -- though Stuart hasn't yet made the same L, P, and Y comparison -- my impression is that their actuation strength acceleration / deceleration is lower than ours.

In summary, we're still in a (dark) grey area for making the call for whether it's worth the 8-hour down-time of flipping the bias, especially with respect to getting another round of full-actuation strength measurements a. la. LHO aLOG 21280. Of course, we *could* try to gather both at the same time, but that starts to get really ambitious -- and we've already seen that when pressed for time, we make mistakes (e.g. LHO aLOG 21005). Further complicating the issue are the holidays -- such measurements require Kiwamu and I present for the full time, and holidays make that cross-section lower than normal (this is why I suggested to Mike and Brian we either do it this week or wait until the end of the run).

----------------------------
Some details on how to gather the test mass longitudinal actuation strength data from the LDAS/DMT tool "SLM" (Standard Line Monitor):
1) Gather the ascii dump of the raw data (which merely calculates the amplitude of each calibration line) from the SLM Tool's webpage. These are available / updated once a day (https://ldas-jobs.ligo-wa.caltech.edu/~gmendell/pcalmon/daily-pcalmonNavigation.html) but for these studies you want the monthly collection, which is available here (https://ldas-jobs.ligo-wa.caltech.edu/~gmendell/pcalmon/monthly-pcalmonNavigation.html).
These should be saved to
/ligo/svncommon/CalSVN/aligocalibration/trunk/Runs/O1/H1/Measurements/CAL_PARAM/
(simply because the CalSVN is far more accessible in the control room and on laptops than Greg's home folder on the LDAS clusters.)

2) Analyze the raw data using
/ligo/svncommon/CalSVN/aligocalibration/trunk/Projects/PhotonCalibrator/scripts/SLMTool/SLMData_analysis.m

for which you should only need to change the name of the parameter file that is called on Line 6 (right under where a comment says "Load Parameter File"). Of course, you should create a new parameter file (of which there are plenty of examples in that same folder, called parameter_*.m. This will save a new .mat file into
/ligo/svncommon/CalSVN/aligocalibration/trunk/Runs/O1/H1/Results/CAL_PARAM/
(with name as specified in your SLMData_analysis parameter file) that covers the duration of data that is new.

3) Concatinate earlier results with the new results you've gathered. This, regrettably is still a rather klunky, by-hand, process. For example, today, I had to take the previously generated .mat file,
/ligo/svncommon/CalSVN/aligocalibration/trunk/Runs/O1/H1/Results/CAL_PARAM/2015-12-01_Sep-Oct-Nov_ALLKappas.mat
and load it with my newly generated data from thus far in December,
/ligo/svncommon/CalSVN/aligocalibration/trunk/Runs/O1/H1/Results/2015-12-15_H1_Kappas_Nov30_to_Dec15_2015.mat
concatinate (e.g. kappa_TST = [file1.kappa_TST(:);file(2).kappa_TST(:)]), each variable and then save it as a new file,
/ligo/svncommon/CalSVN/aligocalibration/trunk/Runs/O1/H1/Results/2015-12-15_H1_ALLKappas_Sep10_to_Dec15.mat
Since the results from SLM tool are only available in at-most month-long chunks, this has too be done every new month. Note that, for the current month, even though the link suggest only up to the first of the month is available, all data up to 00:00 UTC of the current day of the month is available.

To compare these new longitudinal results against charge measurements, I ran the usual analysis instructions (see aWiki) to completion, ending with
/ligo/svncommon/SusSVN/sus/trunk/QUAD/Common/Scripts/Long_Trend.m
but then by-hand saved select variables from the work space,
save([dataDir chargeDataFile],'DayDate','WeightedMeanPitch','AppliedBias','VariancePitch','WeightedMeanYaw','VarianceYaw','limit')
where I've defined dataDir and chargeDataFile in the work-space before hand (also by hand) to be also in
/ligo/svncommon/CalSVN/aligocalibration/trunk/Runs/O1/H1/Results/CAL_PARAM/2015-12-15_H1SUSETMY_ChargeMeasResults.mat

Then, I run the (sadly still scripted, and copied from date to date when I have a new time I want this run)
/ligo/svncommon/CalSVN/aligocalibration/trunk/Runs/O1/H1/Scripts/CAL_PARAM/compare_chargevskappaTST_20151215.m
which produces the last plot attached, as long as all of the input file names are changed correctly to the latest date.
Images attached to this report
Non-image files attached to this report
