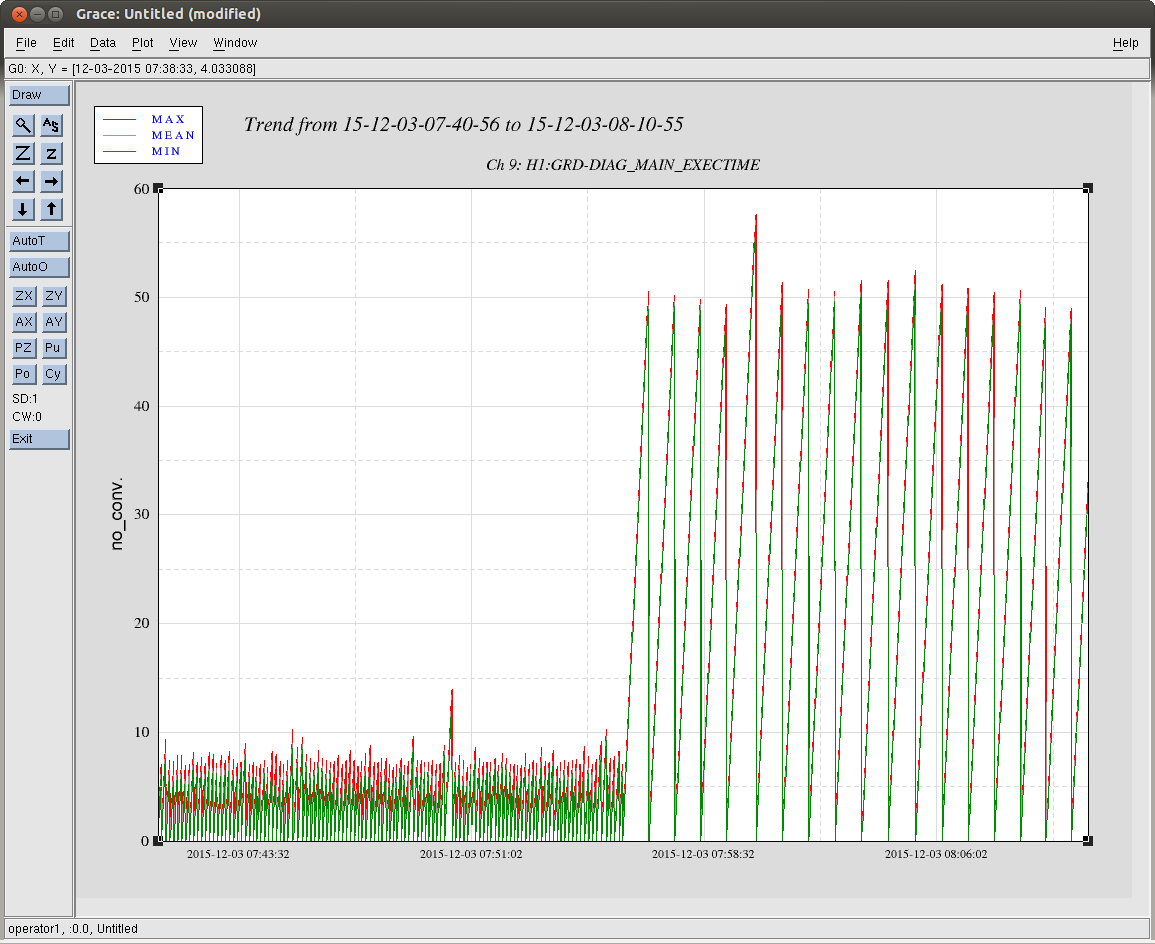
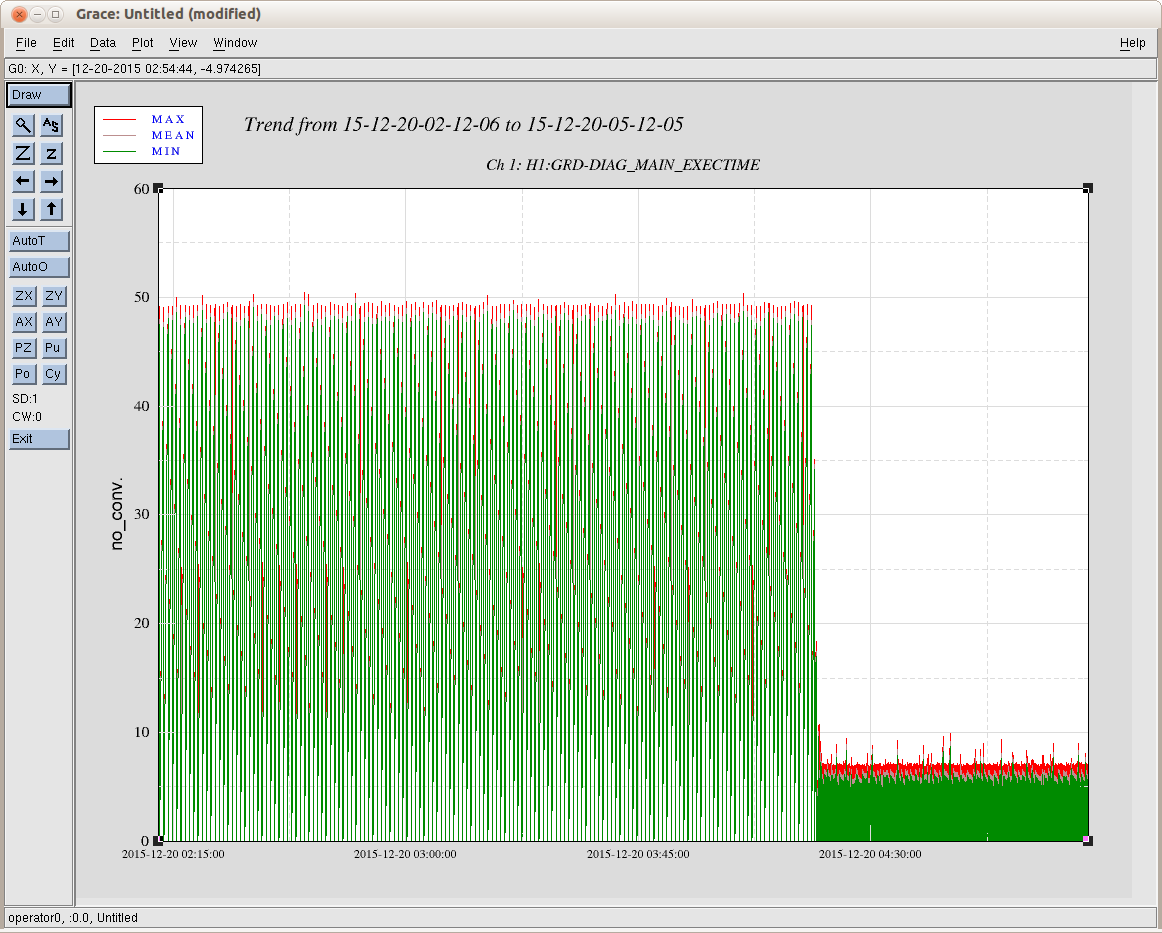
The DIAG_MAIN exec time normally runs around 6/7sec, and every few months it will jump up to ~50sec. It is not a gradual increase, it will just shoot up. December 3, around 8am PST was the most recent time increase, and last night around 20:15 PST it dropped back to ~7sec. I have checked a few other nodes (IMC_LOCK, ISC_LOCK, ISI_ITMX_ST1, and a few SUS nodes that I can't remember) and their exec times dont seem to show any coincidence with this. The DIAG_MAIN node is different than most of the other ones because it will make numerous ezca calls continuously to check on channels and evaluate what may be out of normal, so it might make sense that the other nodes are not showing the same signs.
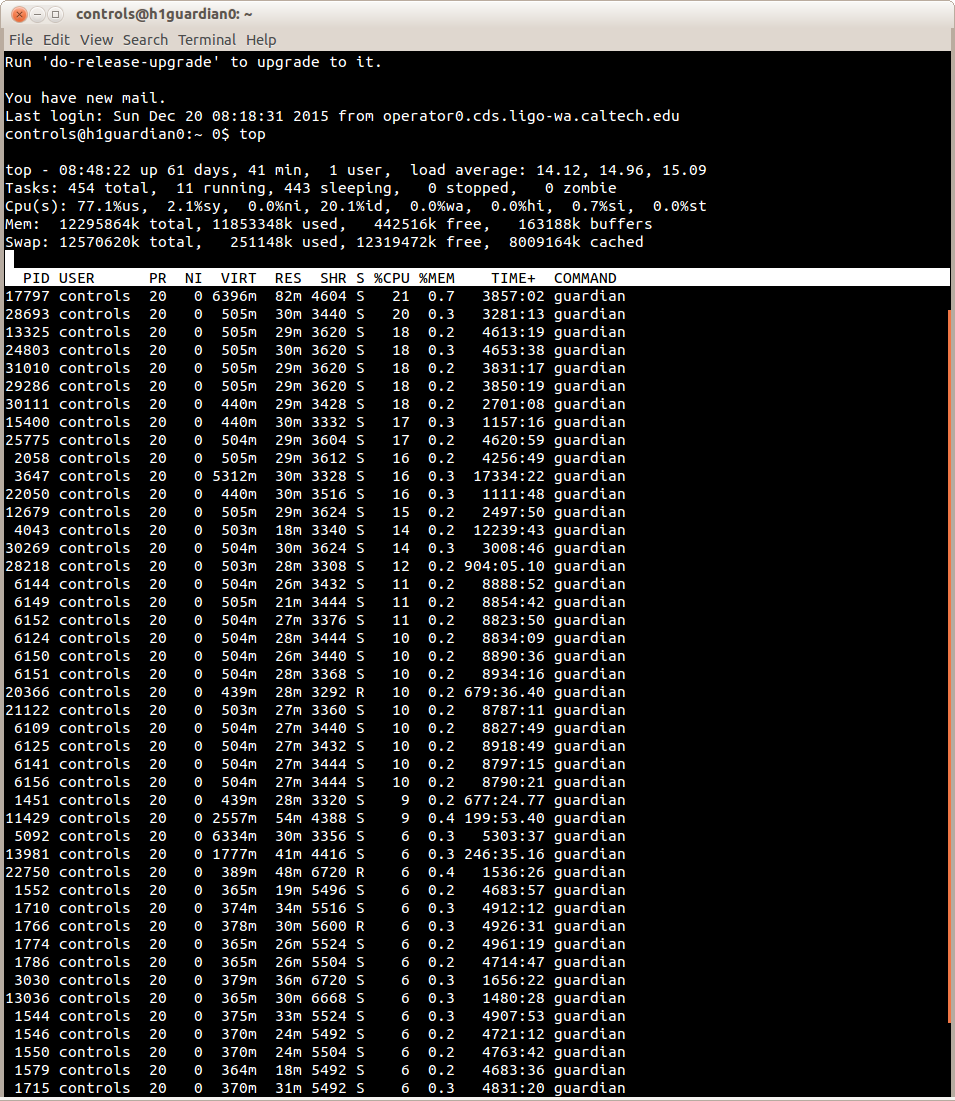
I quickly logged into the h1guardian0 machine this morning, while LLO was down, to see if the usage has dropped from last time I checked on the 3rd. I wasn't smart enough then to take a screenshot, but from what I remember from the 'top' command screen the tasks were about the same and the CPU%'s were similar but maybe now slighty lower, but only maybe. [Login times to h1guardian0: 16:18,16:48 UTC for a few minutes each time.]
Nothing seemed to have happened around 20:15 last night, we have been locked and observing for the past 34 hours. The investigation continues...