cheryl.vorvick@LIGO.ORG - posted 09:28, Wednesday 23 December 2015 (24409)
Comparing changes in ETMX ISI and ETMY ISI as the useism increased
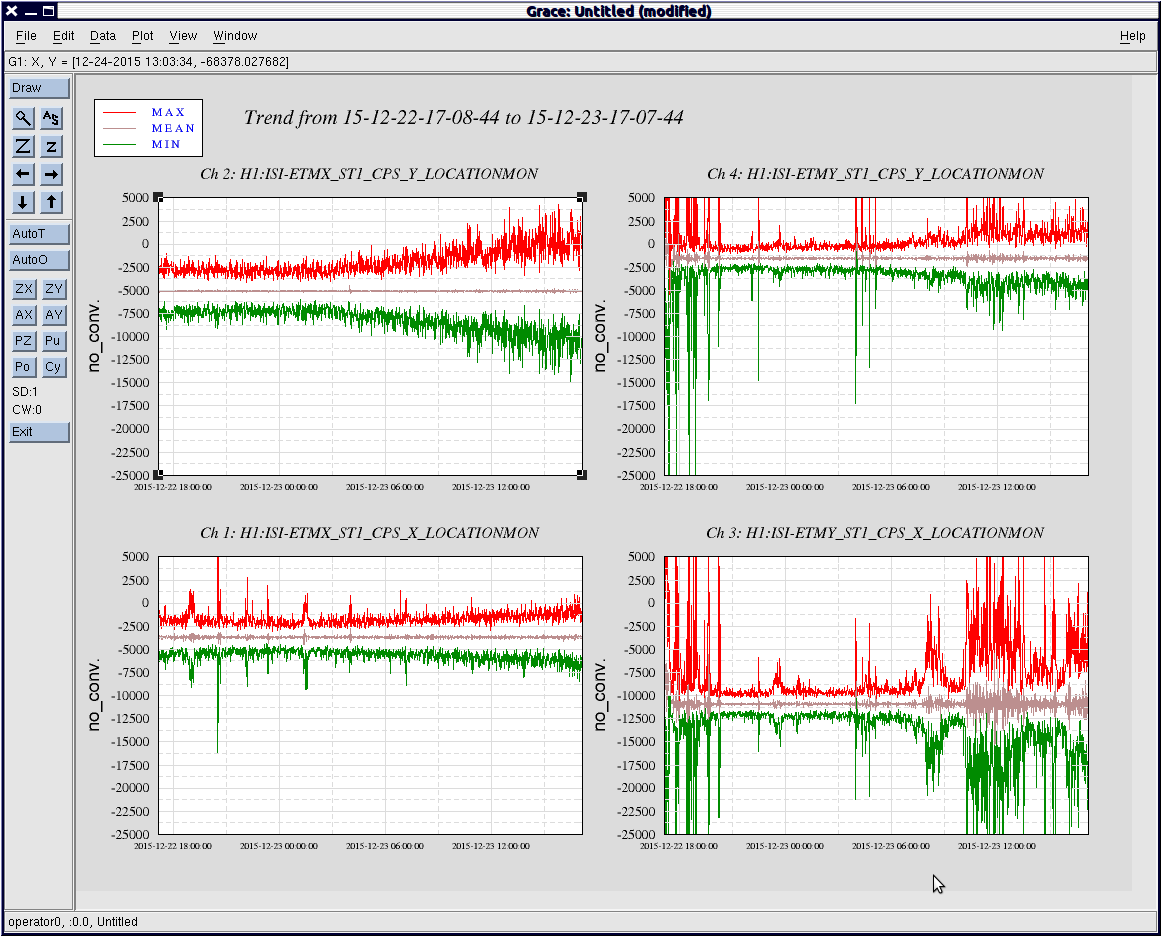
Plot shows ETMX and ETMY Stage 1 X loaction and Y location over the last 24 hours.
During the last 24 hours, useism has increased from 0.4um/s to 1um/s.
ETMY ISI (left, top and bottom) shows a steady increase in the amplitude of the oscillations in X Location and Y Location.
ETMX ISI (right, top and bottom) shows an increase in the amplitude of the oscillations in X location and Y Location, however, the increase in amplitude of the signals, and the signals themselves are anything but "smooth."
Images attached to this report