[Sheila, Jenne, Travis, JeffK, EvanH]
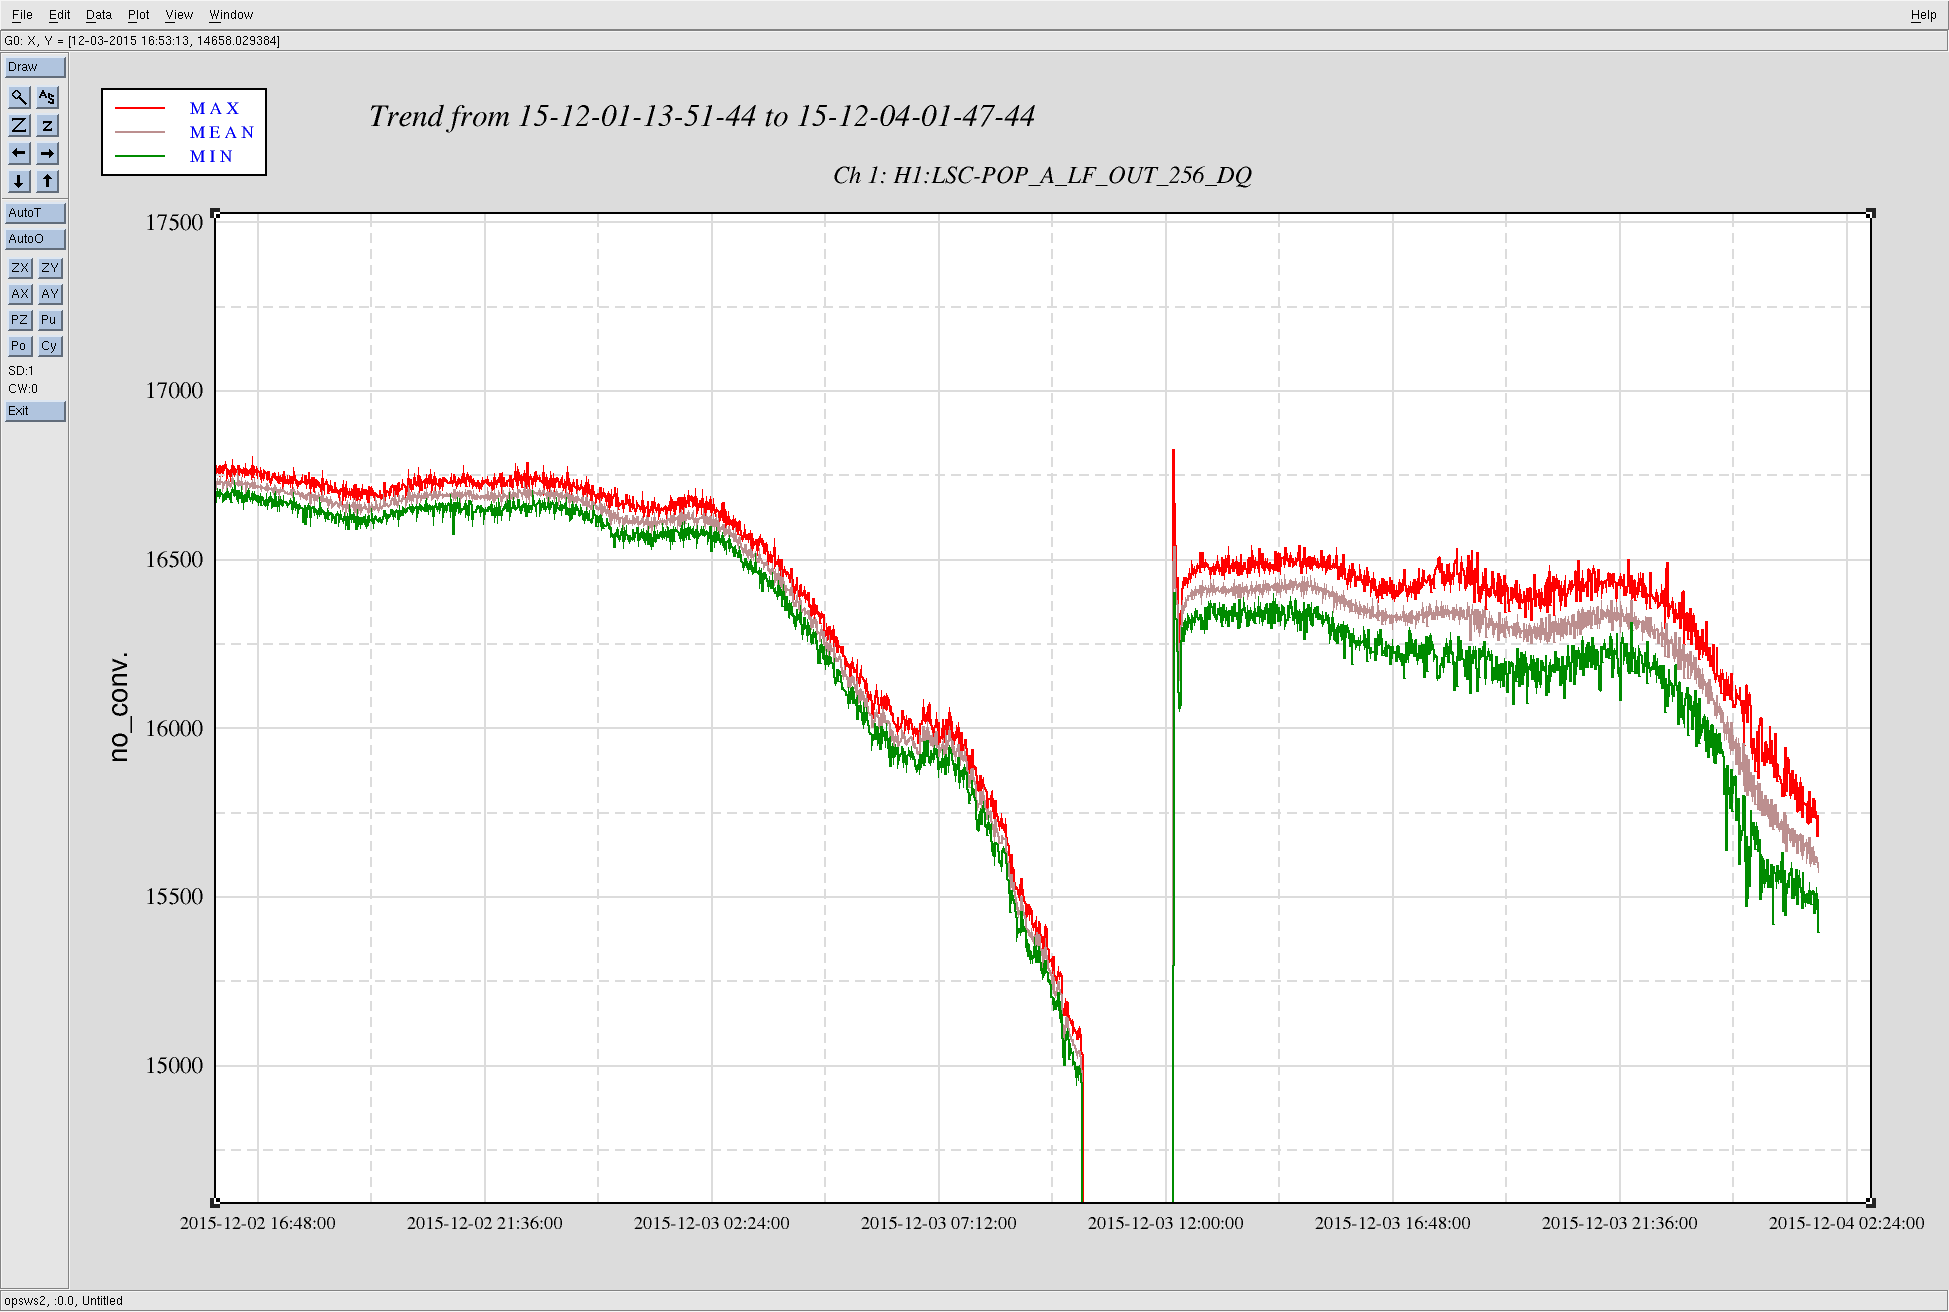
The transmitted powers through the IFO are dropping on a several-hour timescale, and we don't know why. It looks like this was also happening at the end of yesterday's 31 hour lock. (POP_LF is shown for the last day or so in the attached plot.) These are the only 2 locks in the last 10 days that have this trend - for all the others the powers stay nice and steady.
The power into the interferomter as measured by both IMC_Trans and IM4_Trans is steady, so it's not anything from the PSL or IMC.
We have looked at all the alignment and length control signals that we can think of, as well as the witness channels on the bottoms of the optics, and we aren't seeing anything that jumps out at us as a cause of this power drop.
Intriguingly, the REFL power is dropping as well as the transmitted powers, so perhaps we're losing our mode matching throughout the lock? Sheila found that the TCS CO2 power is different after Tuesday maintenence this week, although it's not changing throughout these locks.
Anyhow, we're not sure what is wrong, so we're not sure what we would tweak if we could, so we're leaving the IFO alone. But, I suspect that once POP_LF gets down near 15,000 counts we'll lose this lock.
This morning Keita, Evan and I had another look at these two locks where the POP power dropped.
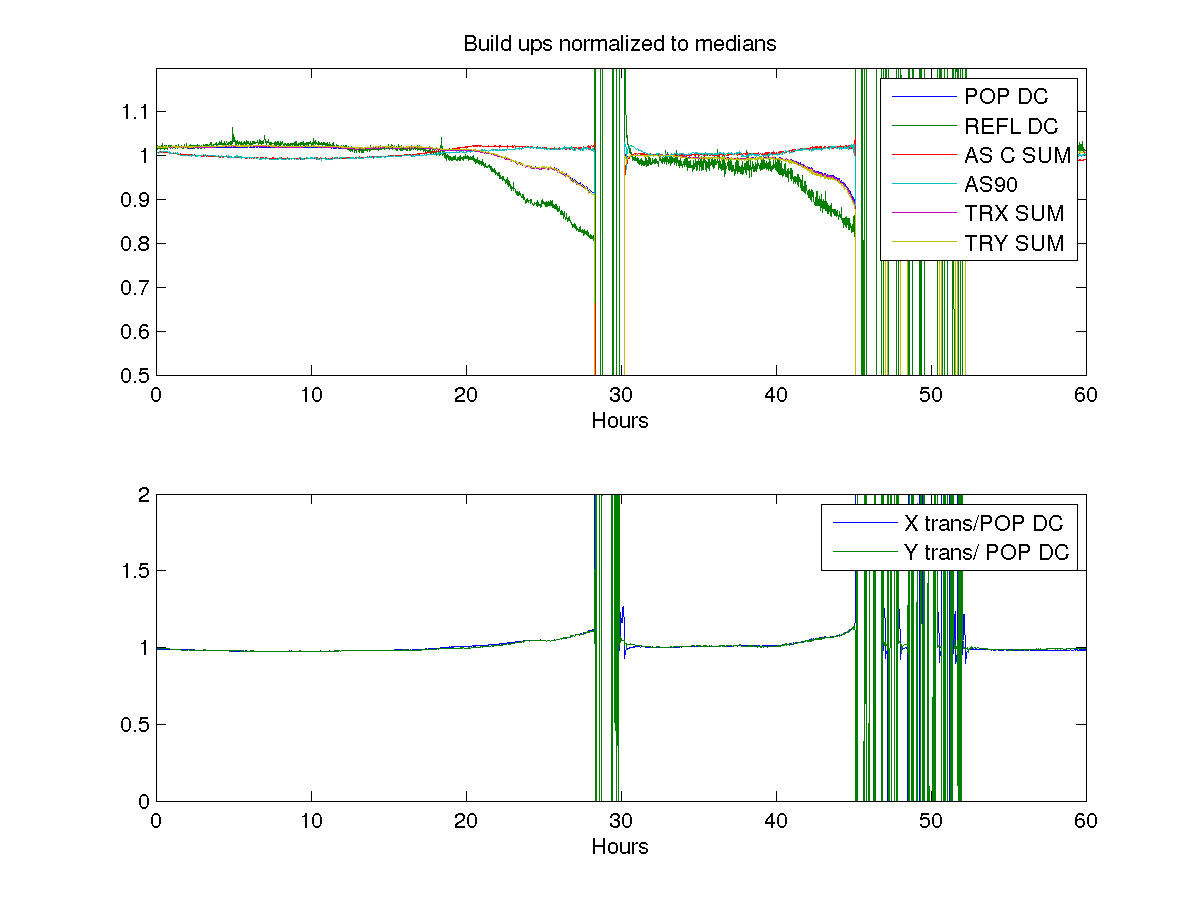
The first attached plots show various power build ups, normalized to their medians durring this 2.5 day stretch of data. The lines for POPDC, TRX, and TRY are almost on top of each other, and drop by about 10% in the 5-10 hours before the lockloss. The lower plot shows the arm transmissions normalized by the POP power, which is mostly stable but increases by about 10% at the end of the locks. From this we can conclude that the problem doesn't seem to be either a mode mismatch or misalignment of the arm cavities, but something happening in the vertex.
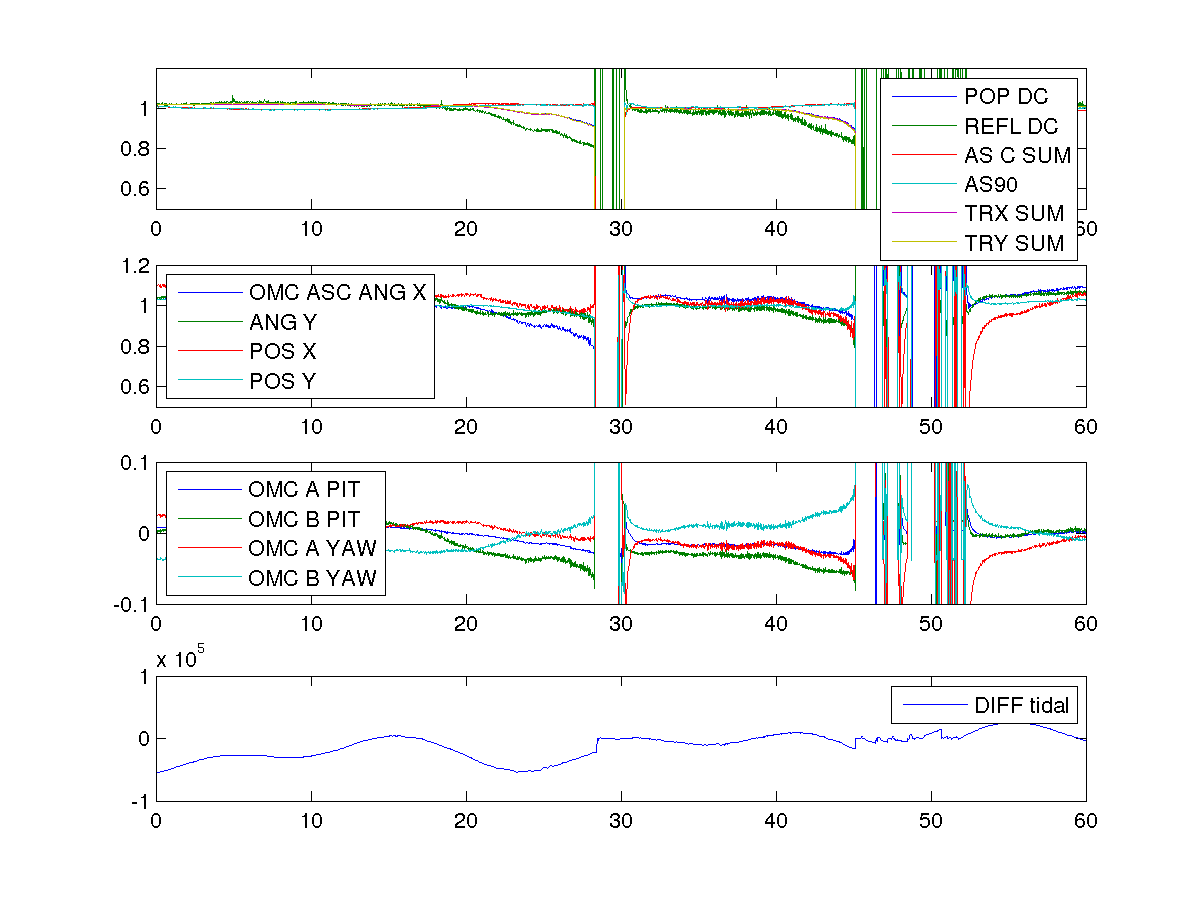
In both cases the refl power drops sooner than the POP and arm powers, and it drops by almost 20%. AS90 and AS_C are fairly stable.
One possiblity is that somehow the OMC was becoming misaligned, the DARM offset was increasing to compensate for this. The second plot shows the OMC ASC control signals (normailzed to their medians), and the OMC QPDs (detrended) durring this time. Although there does seem to be small ez=xcursions in these signals at the end of the locks, its not verry conclusive. The difference of X and Y tidal control signals in the bottom panel might have shown us a change in DARM offset, but it seems like the tidal signal is large compared to anything that is corellated with the power drops.
Note: there was a typo in the script used above, in the first plot lower subplot I was not plotting the ratios that I though I was. Conclusions are not changed.