Evan, Kiwamu,
As some of us have already noticed, there is a broadband noise with a 1/f^{0.5} shape in frequency from 60 to 200 Hz. This noise is unidentified.
Do not believe any statements in this report until futher analaysis. Something is fishy with the claibration of the cross-spectrum.
We are planing to check how stable this noise level is over the course of the entire O1.
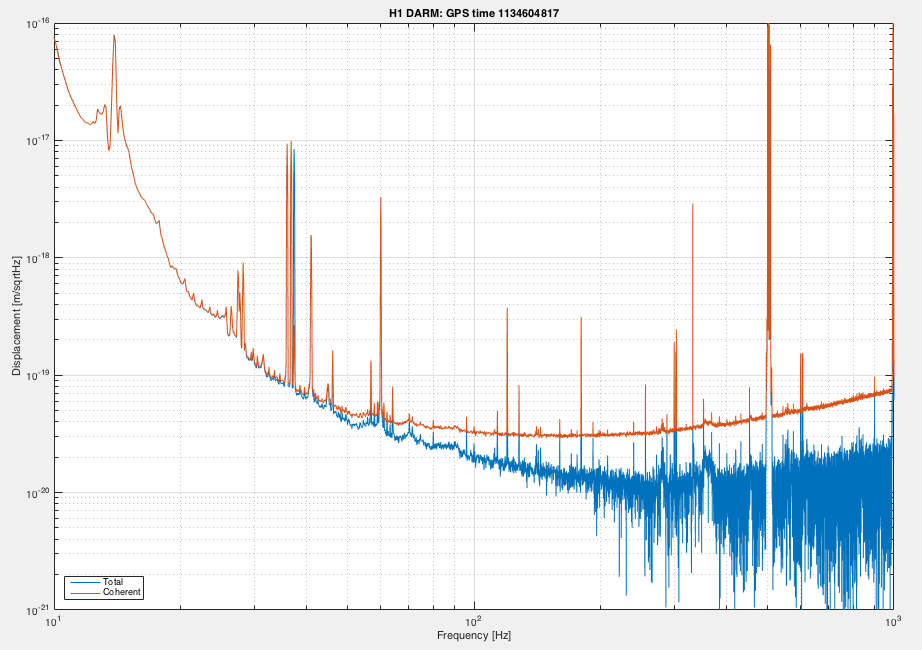
The below shows an example spectrum of DARM.
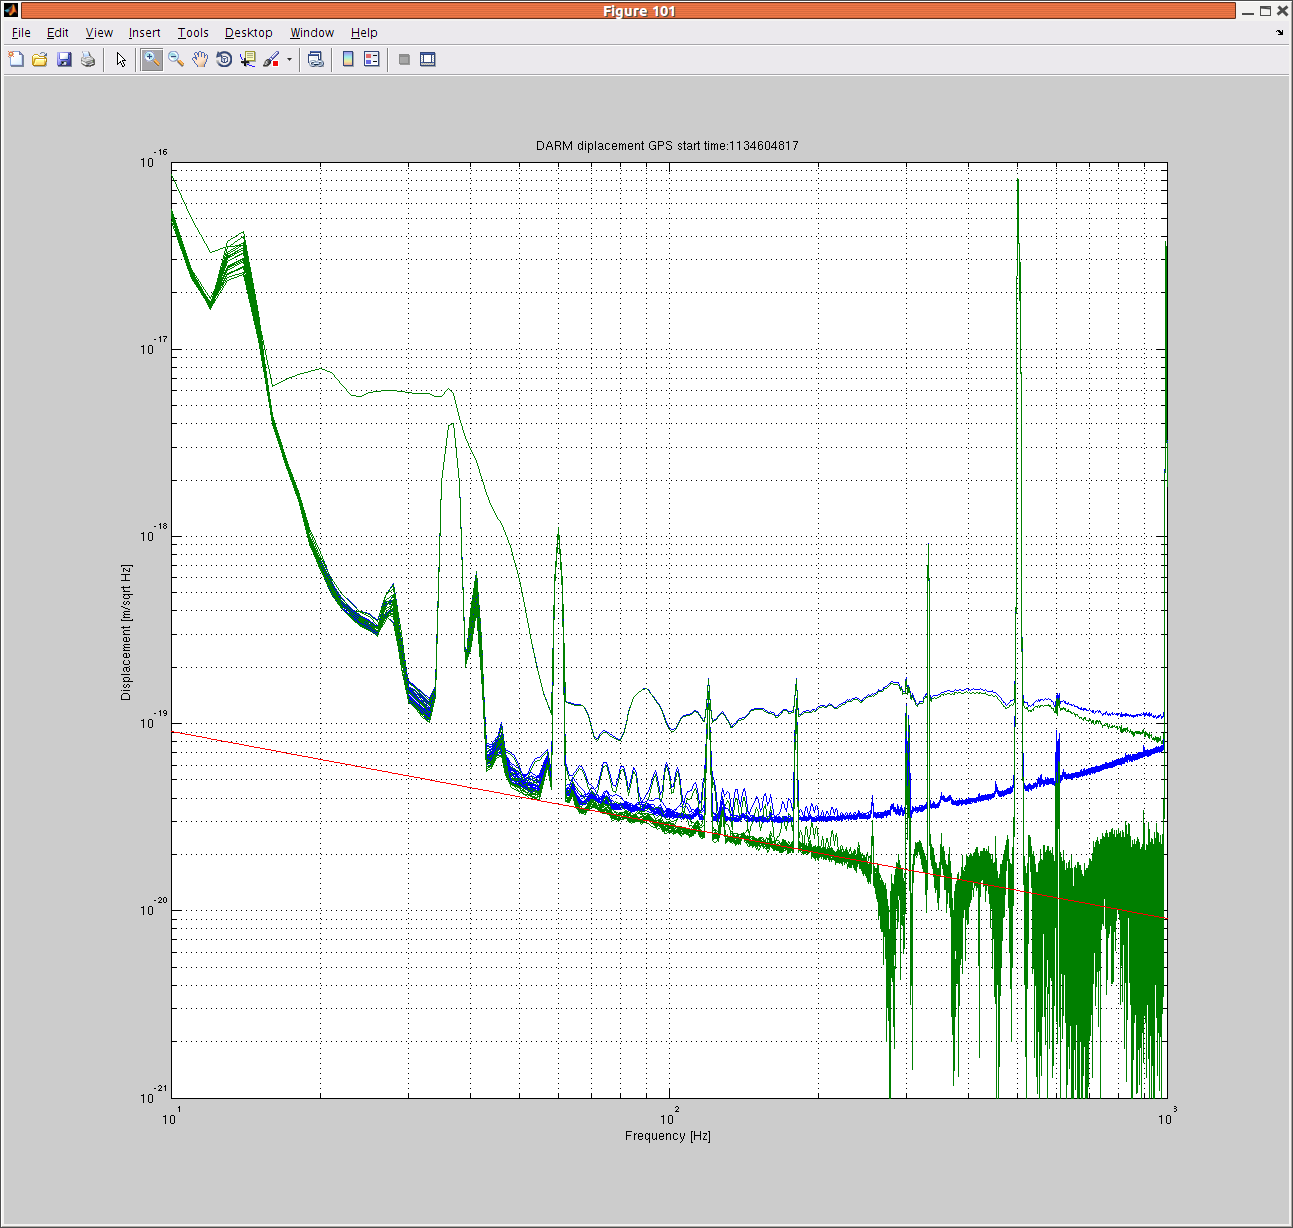
Blue curves are twenty spectra of DARM (aka C01 frame, converted into displacement), each of which is made by the Pwelch with Hanning, detrended, 50% overwrap for a 12 minutes time series. The data starts at a GPS time of 1134604817. Green curves are the square-root of twenty cross-power-spectra of DCPD A and B which are reconstructed from the sum and null streams of the DCPDs. The DARM suppression effect was removed from the sum signal. The cross-spectra are then calibrated to the displacement using the latest O1 DARM model of the calibration group. No time varying correction (i.e. kappas) is applied. Red line is a 1/f^{0.5} line to show how steep the slope of the green curves is. I also attach the fig file.

Gabriele, Evan, Kiwamu
The spectral shape seems to be 1/f in the range from 50 to 150 Hz rather than 1/f½.
There was a human-error in my code for calibrating the cross-spectrum. It was removing the loop suppression after the power spectrum of the null stream was subtracted from that of the sum stream. This was fixed such that the subtraction happens after the removal of the suppression in the sum spectrum. The below is the latest plot.
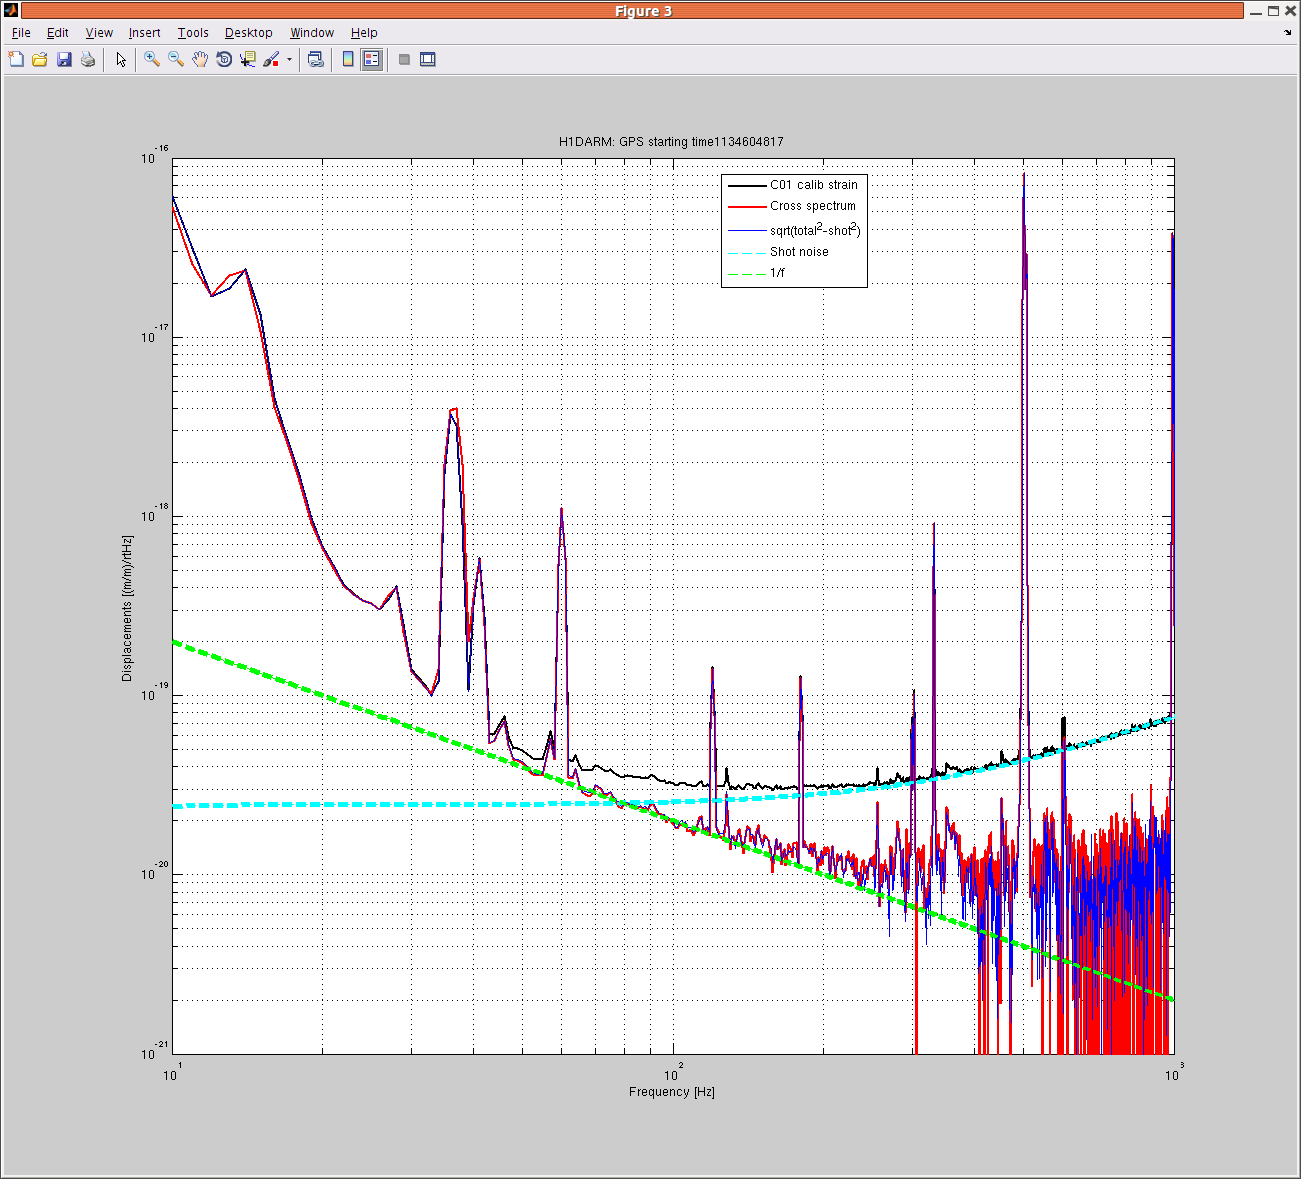
The plot shows the ampitude spectral desnsities of the calibrated darm displacement (aka C01) and the calibrated cross-spectrum. The cross-spectrum should represent noises which are coherent between two OMC DCPDs.
As a coarse verification, I have eye-ball-fitted the shot noise level with the fixed cavity pole frequency of 341 Hz (shown as a dotted line in cyan). Then I subtracted the shot noise component quadratically out from the actual displacement spectrum (in black). The residual (in blue) agrees with the estimation from the cross-spectrum. In order to check the slope of the cross-spectrum, I also drew a 1/f line. The cross-spectrum seems to follow 1/f from 50-ish Hz to 150 Hz.
The fig file is attached as well.
An update can be found in entry 25106
A higher resolution version is attached. The frequency resolution is set to 0.1 Hz, 50% overlap with Hanning for 1 hour data. No new findings.
The 1 Hz comb feature (see for example alog 24695) is becoming visible in 20-50 Hz. By the way, the legend in the plot is wrong.