This afternoon I took measurements of the DHARD Yaw loop at different PSL powers. In addition to general characterization of the O1 IFO, I will use this data to verify the ASC loop model. Once we're confident in the loop model at powers that we can measure, we will use it to try to design ASC filters that we can use for high power operation in a few months.
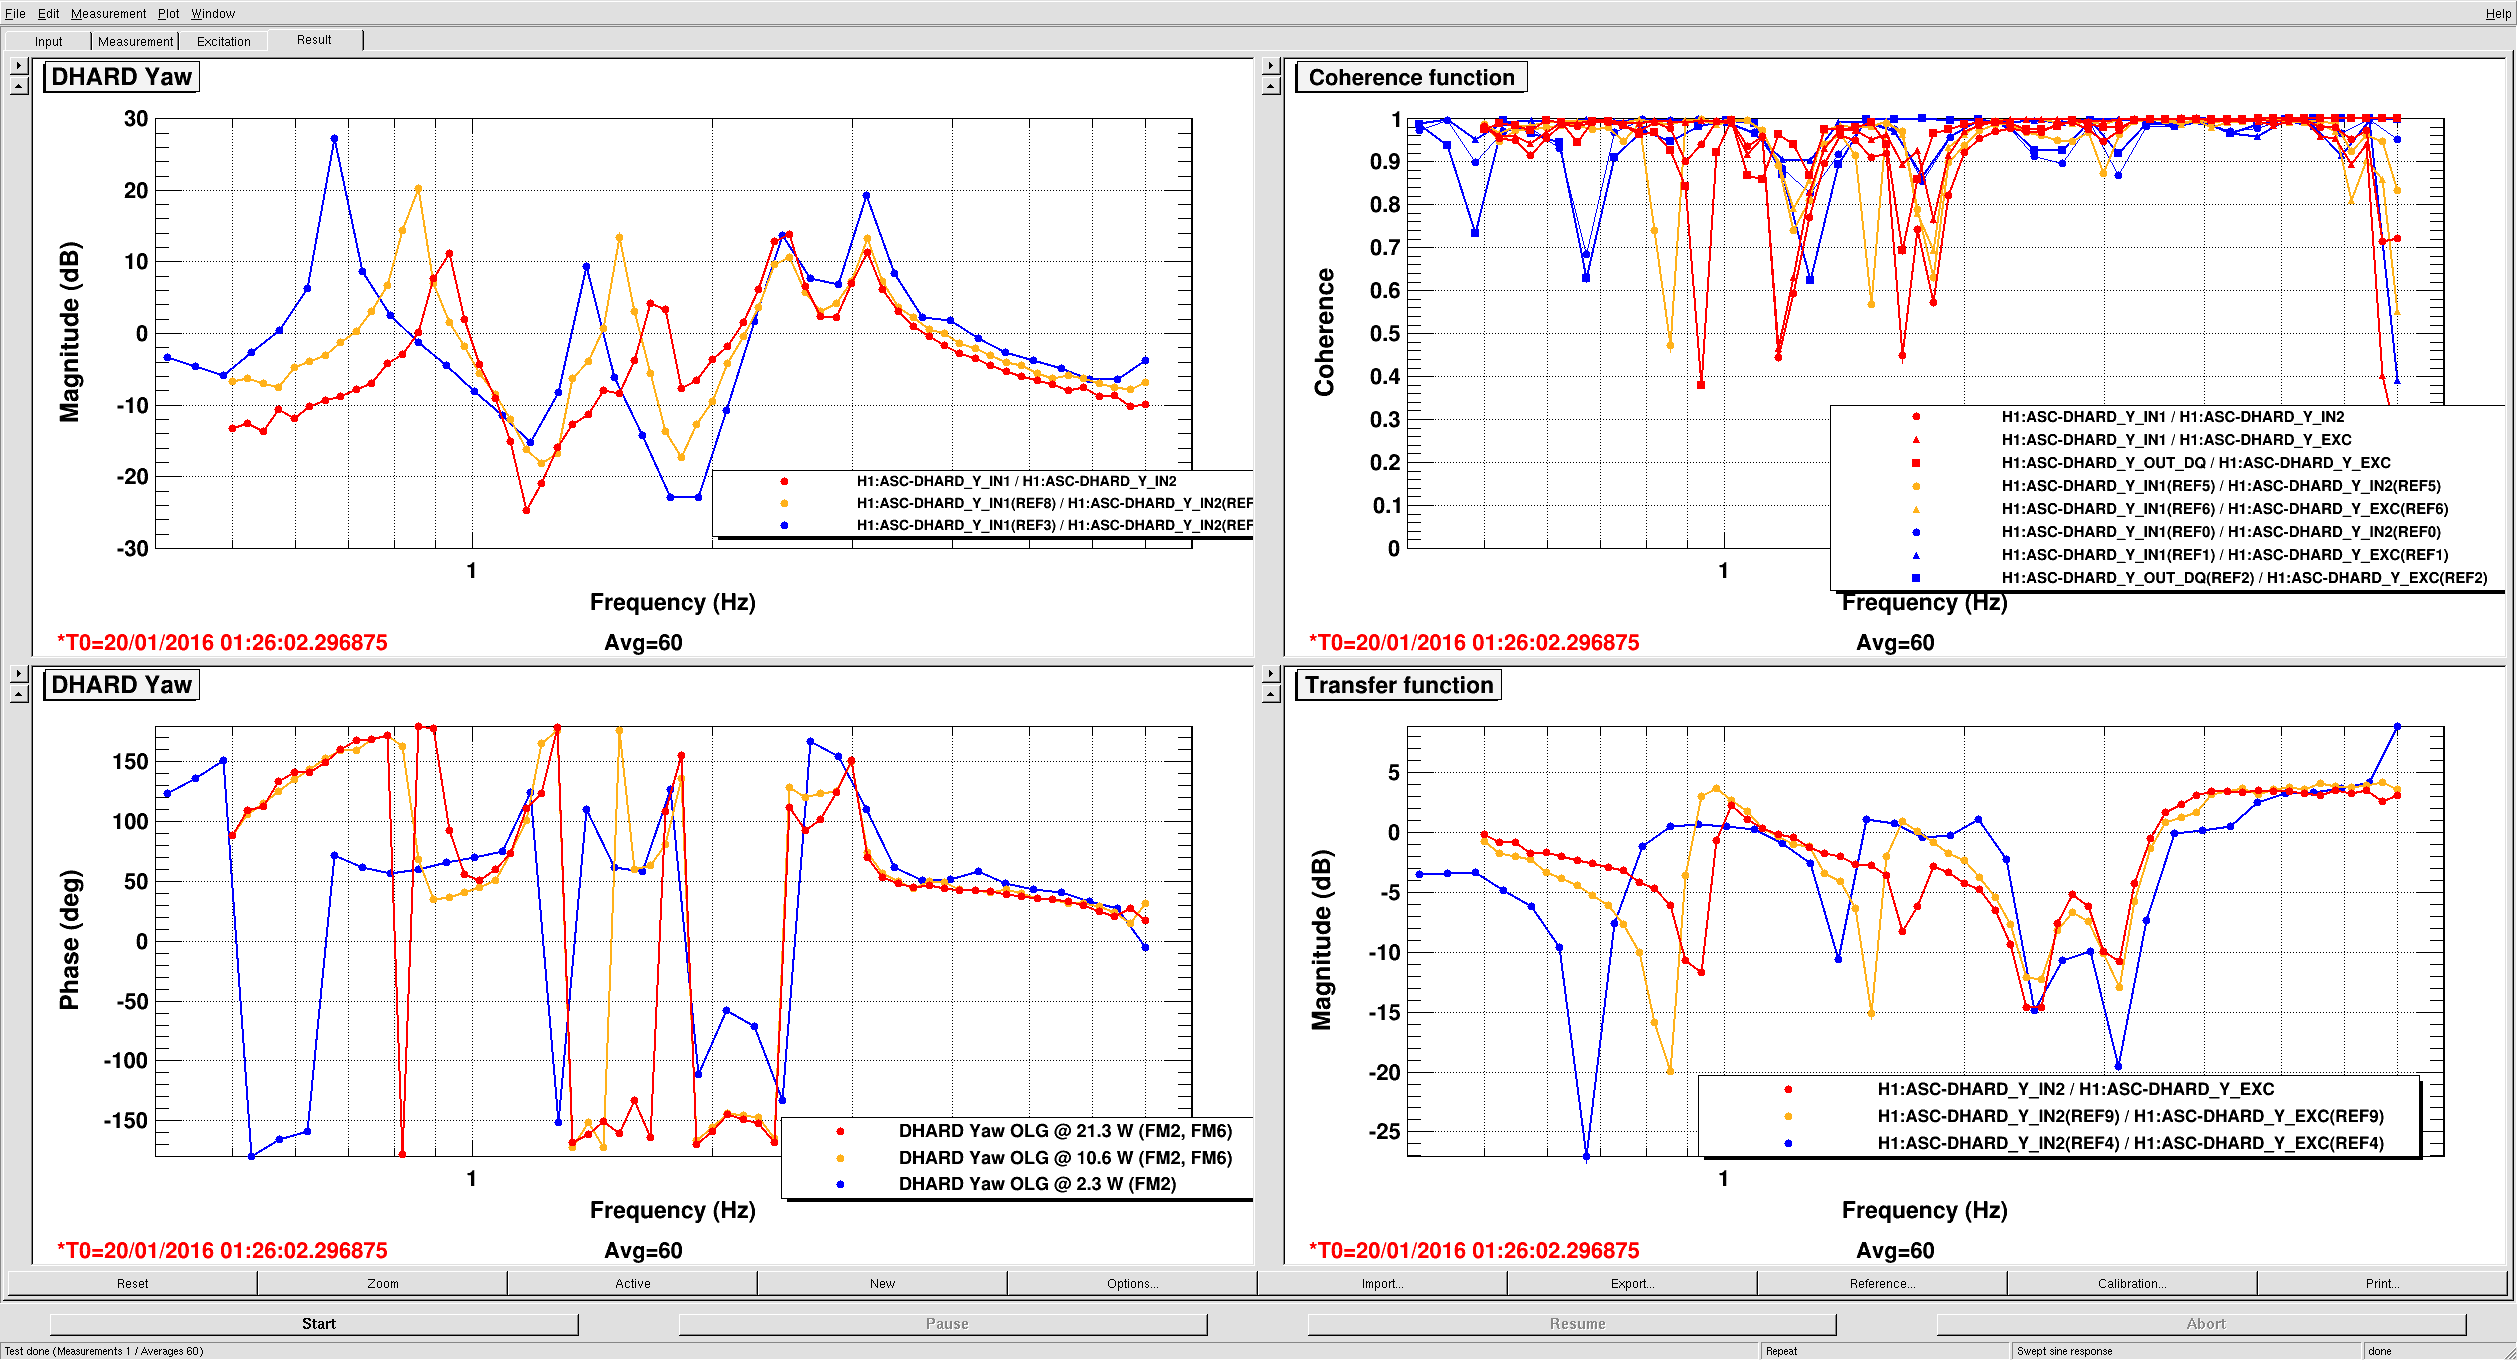
In the first attached screenshot and .xml file, the measurement at 2 W is blue, the measurement at 10 W is orange, and the measurement at 20 W is red.
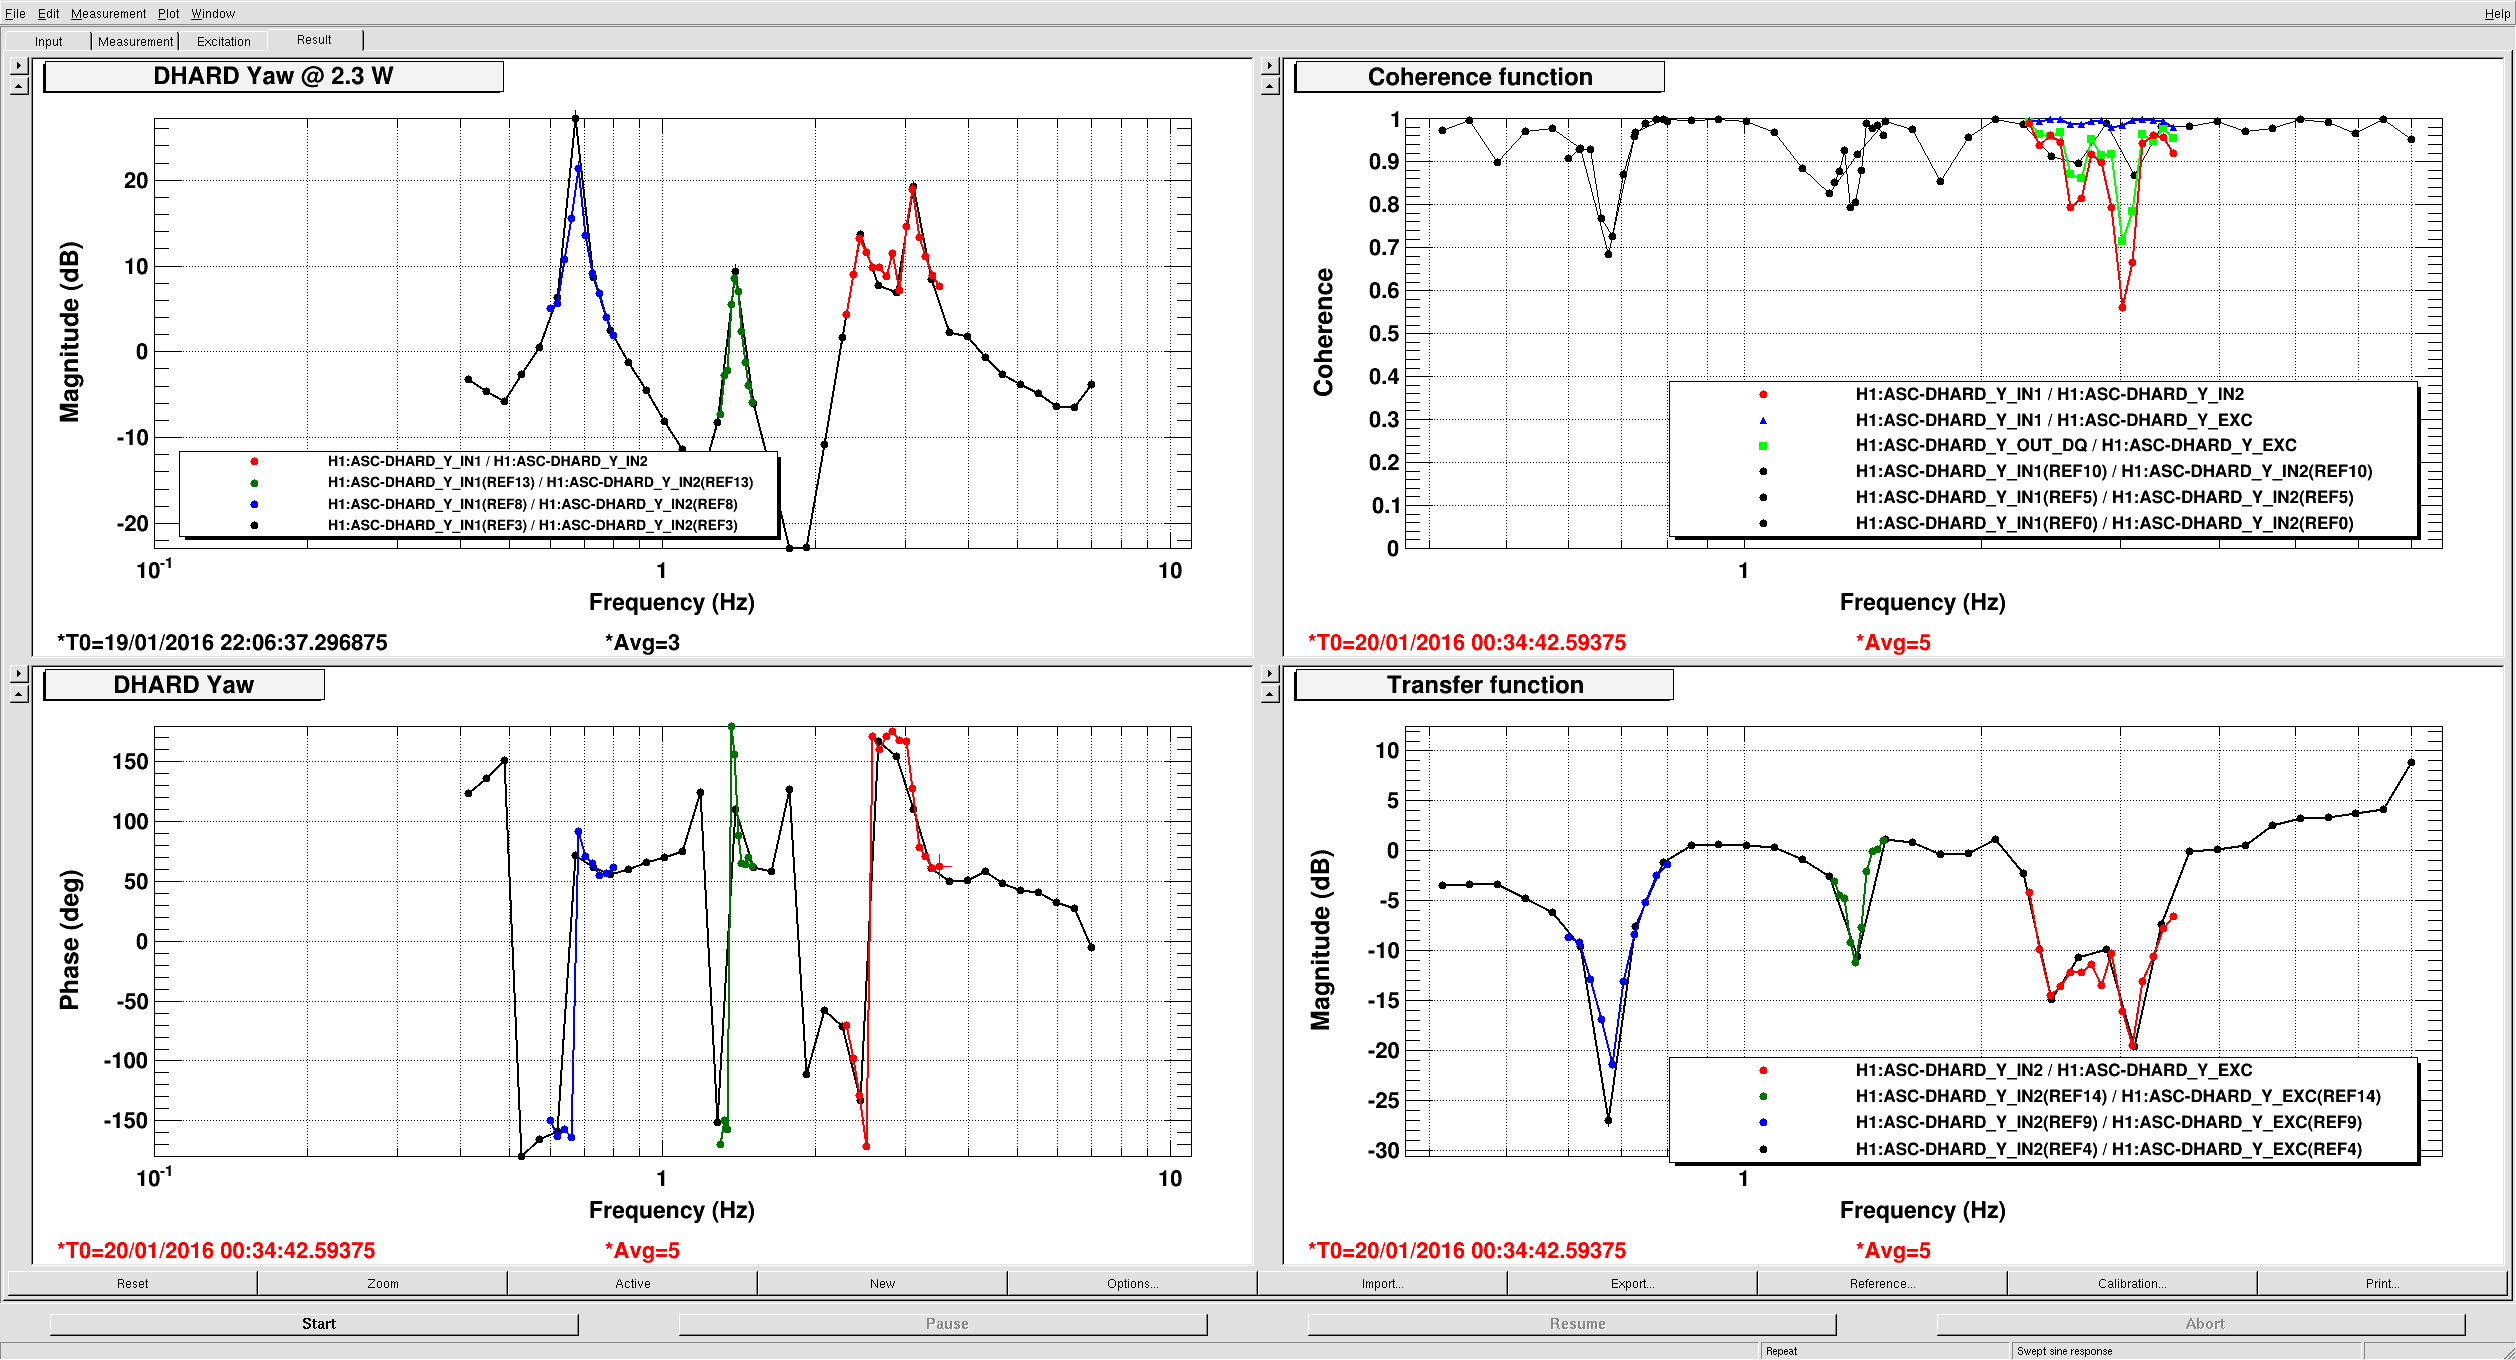
The 2 W measurement was taken at the DC_READOUT state, and only FM6 of the DHARD Yaw filter bank was engaged. This measurement was taken from a lock stretch earlier in the day, using 40 points at 3 avg each. In the xml file, the 2 W data is saved as references 0-4. In the second screenshot and .xml file, I include some higher resolution measurements of the peaks, with 5 avg for each point.
The 10 W measurement was taken at INCREASE_POWER, and both FM2 and FM6 were engaged. This measurement used 60 points at 5 avg each. In the xml file, the 10 W data is saved as references 5-9. I had modified the lscparams.py guardian code to stop the power increase at 10 W, but I have reverted that change, so everything should still be as normal.
The 20 W measurement was taken at INCREASE_POWER, and both FM2 and FM6 were engaged. This measurement used 60 points at 5 avg each. In the xml file, the 20 W data is the "live" traces.
The 10W and 20W measurements today are broadly consistent with the measurements from 31 July 2015 (alog 20084), which is good.

I have plotted yesterday's Dhard Yaw measurements against the ASC model that I have.
The ASC model seems to be missing some gain related to the laser power, since I need a different fudge factor for each input power to get the upper UGF of the model to match the measurement. This is probably a problem with the Optickle part of the model since that's the only thing that should change very significantly in overall gain as a function of power. The suspension model (which includes radiation pressure) shows the peaks from the lower stages moving to higher frequency with higher input power as expected.
In the individual plots (eg. 2W_only), I show the measurement (dark blue) with some error bars (light blue) derived from the measured coherence plotted against the model (black trace). The 10 W and 20 W measurements match the model pretty well (except for the gain fudge required), but the 2 W measurement doesn't match the model very well below a few Hz. I'm not yet sure why this is.
In the final plot attached, I show all 3 models (solid traces) and all 3 measurements (dotted traces), but without error bars to avoid clutter.
