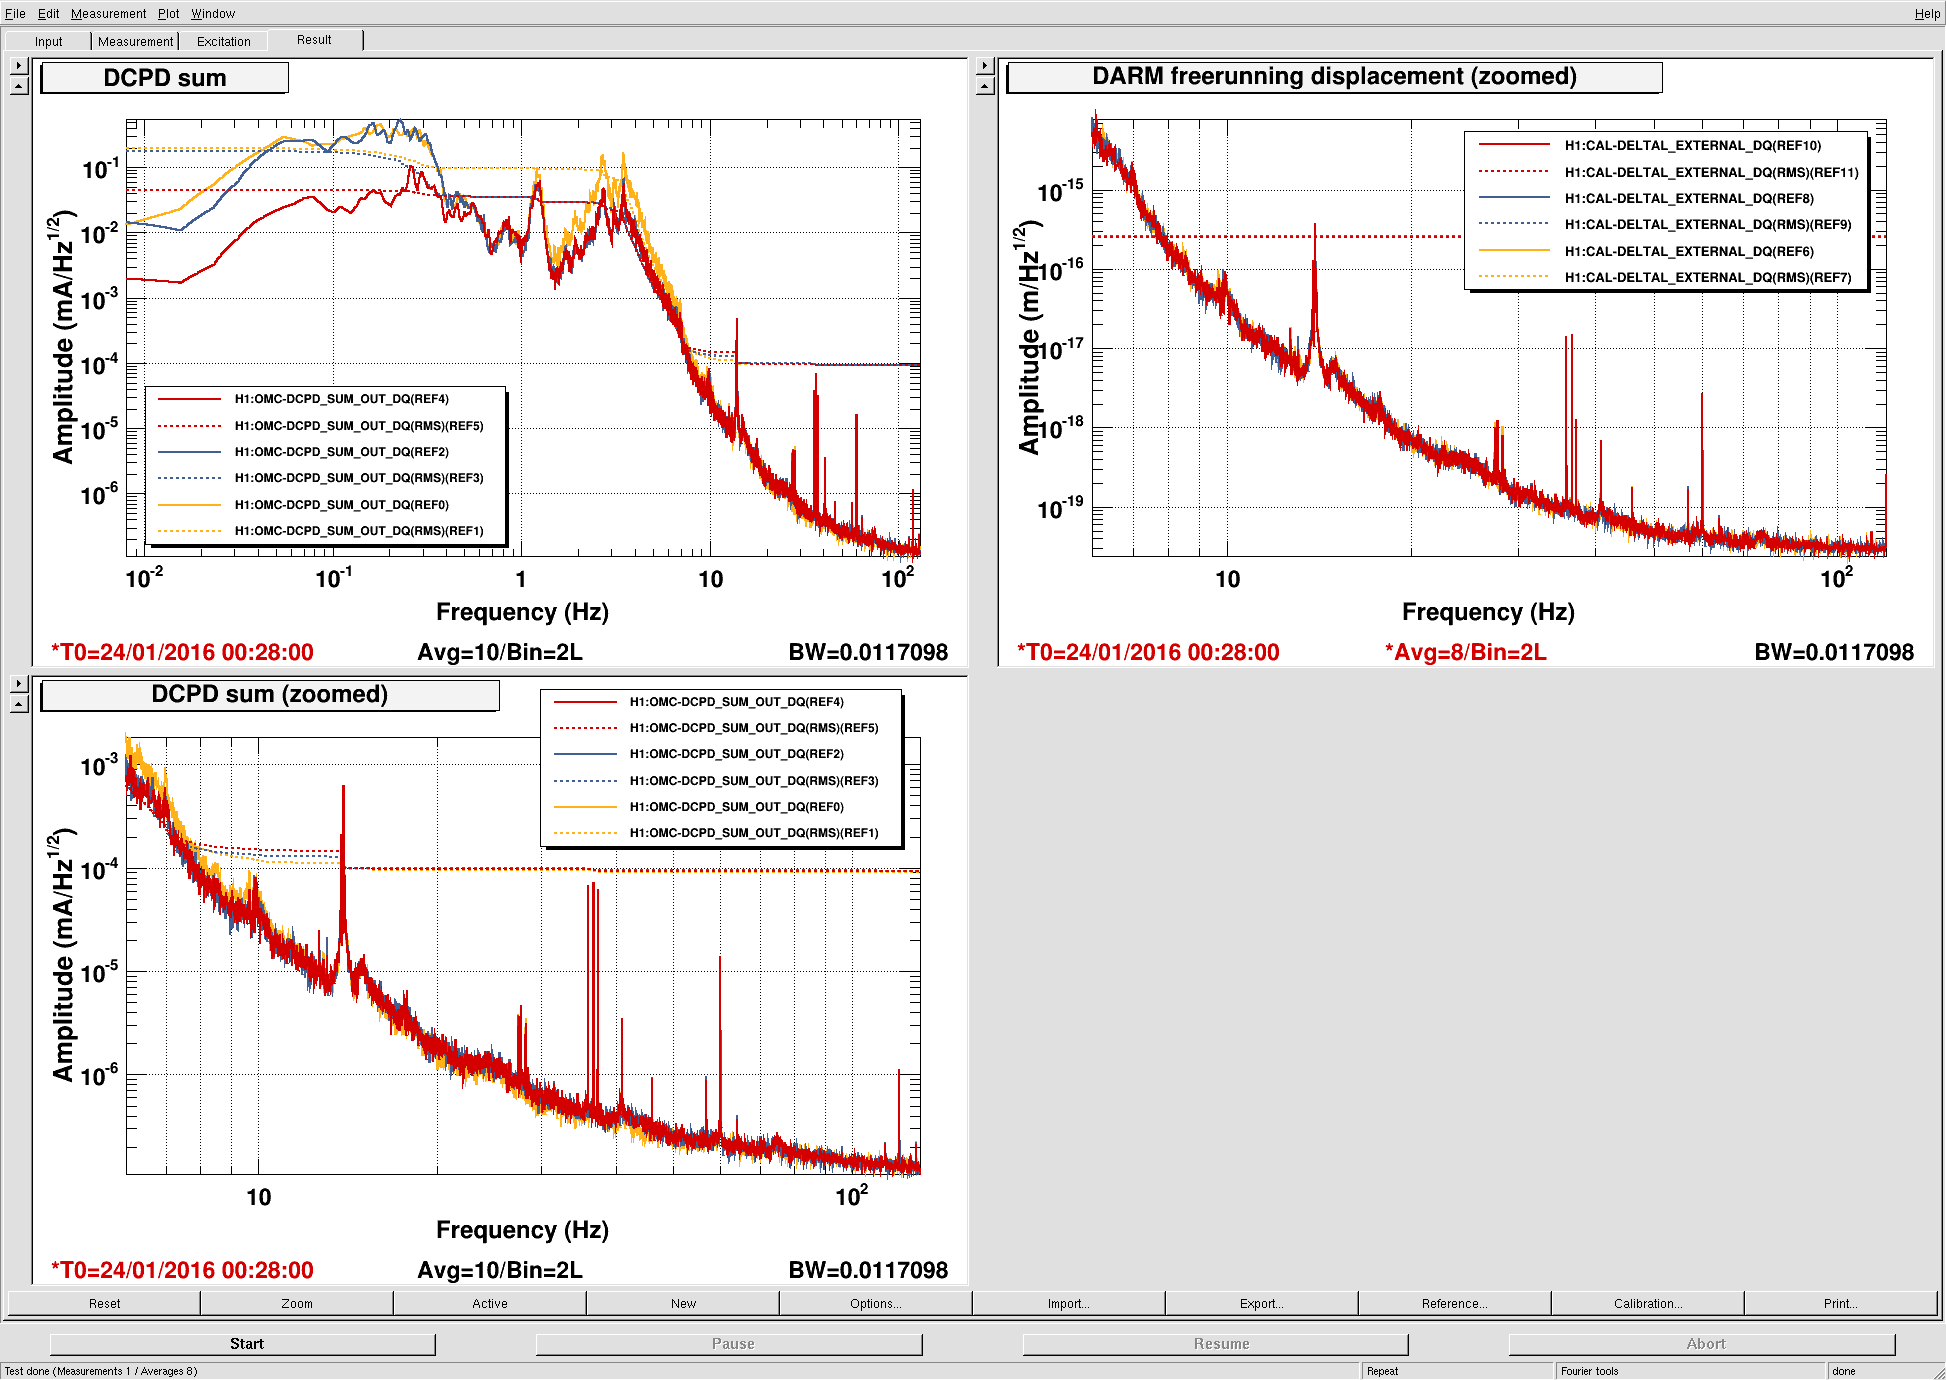
I spent some time looking at how we can reduce the DARM residual.
In the attached plot (template lives in evan.hall/Public/Templates/LSC/DarmResReduce_2015-01-23.xml), yellow shows the nominal DARM residual and estimated freerunning displacement.
Blue shows the residual after the addition of a 3 Hz resonant gain. I put this in LSC-DARM FM10, so the freerunning estimate should still be correct. [However, since the DARM filter bank is full, I had to overwrite some other filter. After this test was over, I reverted my changes and placed this RG filter in the LSC-OMC_DC filter bank for safekeeping.]
Red shows the residual after the addition of the 3 Hz resonant gain, as well as a microseism boost, which I put in LSC-OMC_DC. This affects the freerunning estimate, but the amplitude and phase changes at and above 10 Hz are minimal (less than 2 ° of phase change at 10 Hz).
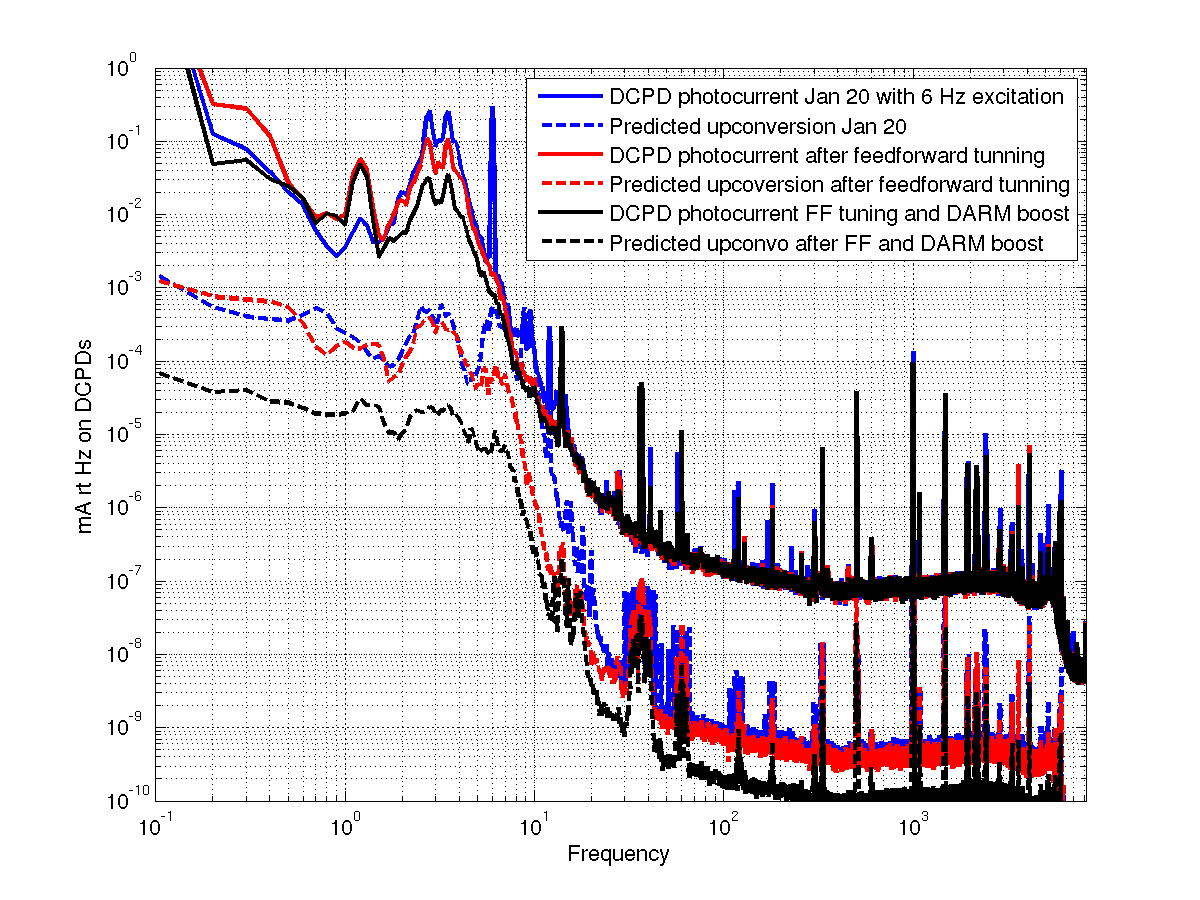
Here is a plot similar to the one in 25053.
It shows the DCPD spectra from last saturday when I had a 6 Hz line injected, with the predicted upconversion from the DC readout quadratic term explaining the line at 12 Hz as well as the noise in the DCPDs at around 10 Hz. The red trace is the spectrum evan calls nominal above, where there were no changes to the DARM loop but the feed forward was retuned, as you can see the predicted upconversion is reduced by nearly 2 orders of magnitude at 10 Hz, and the upconversion around the calibration lines is reduced.
The black trace is once Evan had added both a boost and a resonant gain to the DARM loop, so we expect the DCPD specrtum to be reduced at low frqeuency simply because of the change in the DARM loop shape. You can see that there is also a reduction in the predicted upconversion around the calibration lines as well as at 10 Hz.
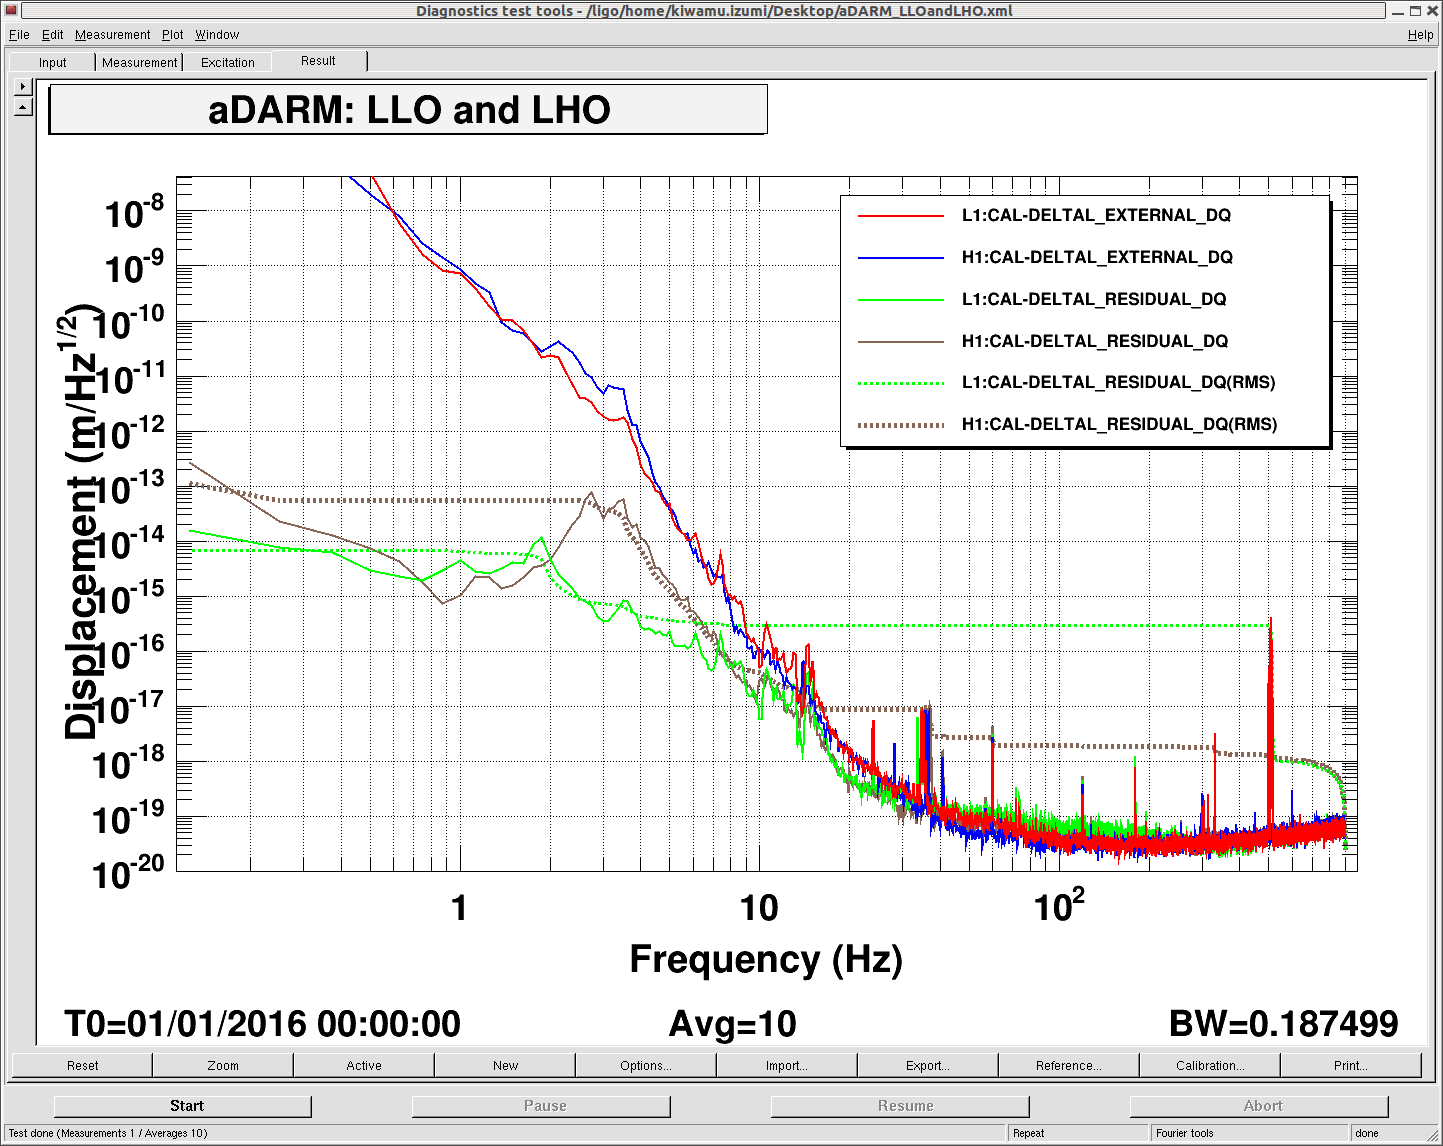
Incidentally I was looking at the residual spectra of LLO and LHO (from Jan 1 2016 00:00:00 UTC) for some other reason. I post the plot for the record.