gabriele.vajente@LIGO.ORG - posted 10:20, Thursday 28 January 2016 (25222)
DHARD pitch coupling is linear and stationary
Using the noise injections I performed yesterday night, I could check that the coupling of DHARD picth to DARM is mostly linear and stationary.
In the attached plot:
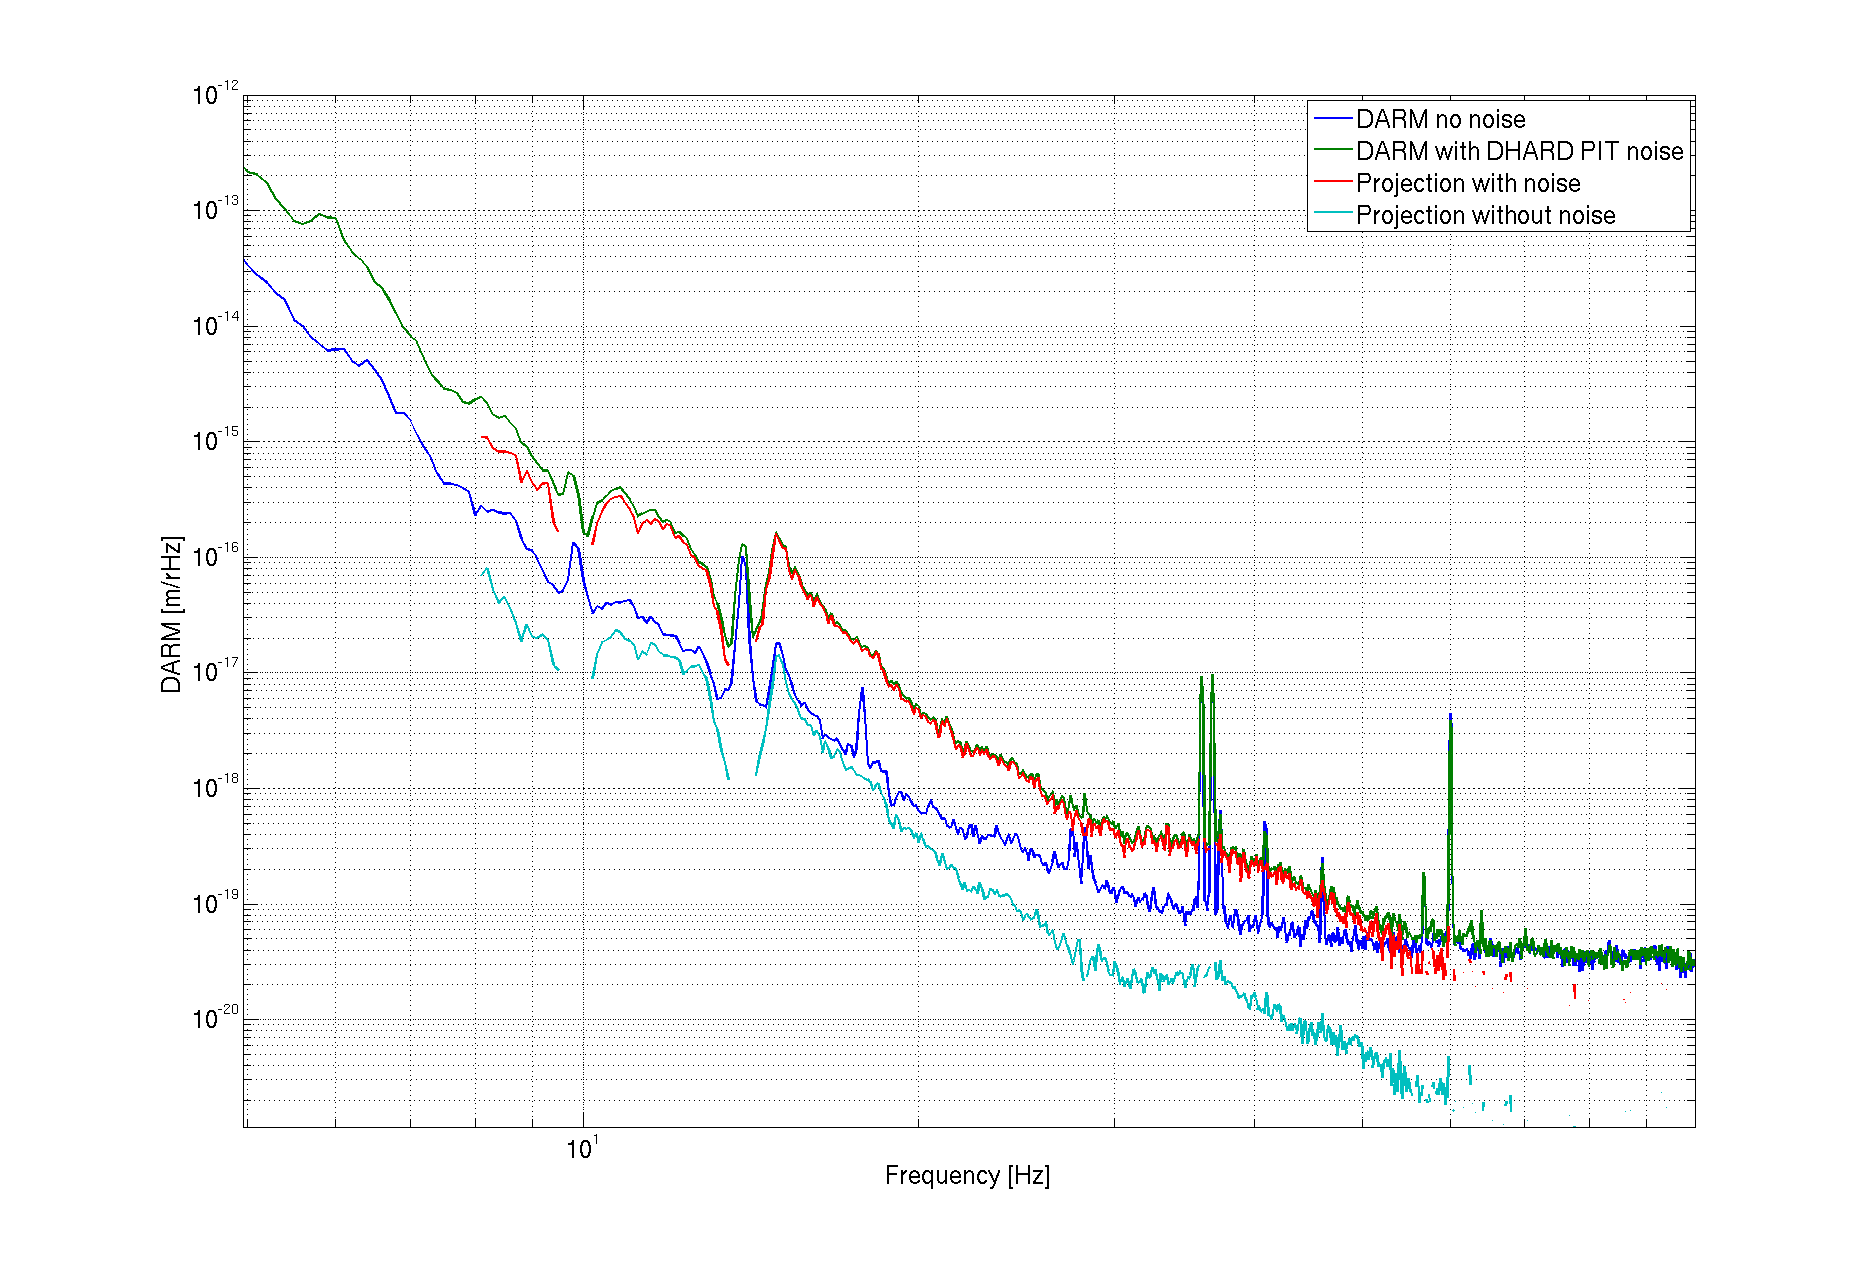
- Blue is the DARM sensitivity without any noise injection
- Green is the DARM sensiivity when DHARD pitch noise was injected with maximum amplitude
- Red is the projection of DHARD pitch noise, using the measured transfer function, while the noise was on
- Cyan is the projection of DHARD pitch noise, using the measured transfer function, without noise
What can we learn from this plot?
- The fact that the red and green curves match means that the measured linear and stationary transfer function is a good estimate of the noise coupling: this is a good indication that the noie coupling is indeed dominated by a linear and stationary term
- The cyan curve is quite close to the measured sensitivity below 20 Hz: DHARD noise is a significant contribution to the total noise in this region, confirming what already found with a coherence analysis
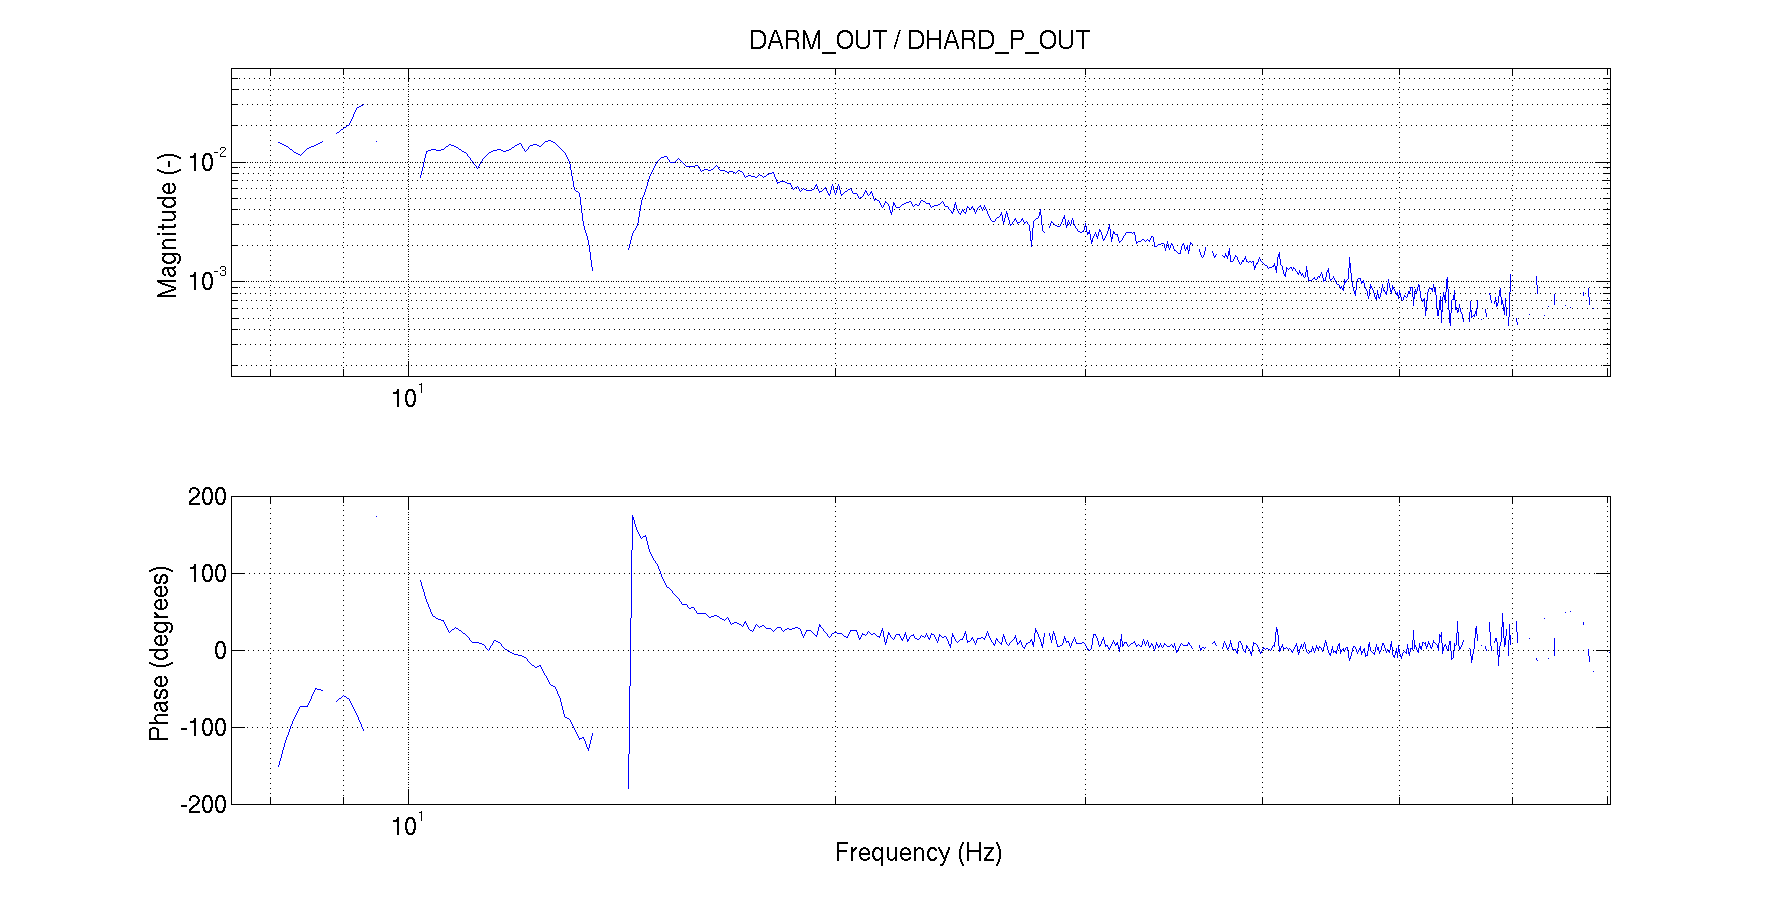
The second attached plot hows the transfer function between DARM_OUT and DHARD_P_OUT. It's quite flat and feature-less, except for the bounce and roll mode notches. This suggests to me that we could reduce the DHARD pitch coupling by adjusting the differential gain of ETMX and ETMY P2L to minimize the noise coupling.
Images attached to this report