Aftef improving the angular decouplig and the feedforward, the noise curve looks quite smooth to me, except for a small bump betwen 15 and 20 Hz and some other bumps between 55 and 80 Hz, to be investigated.
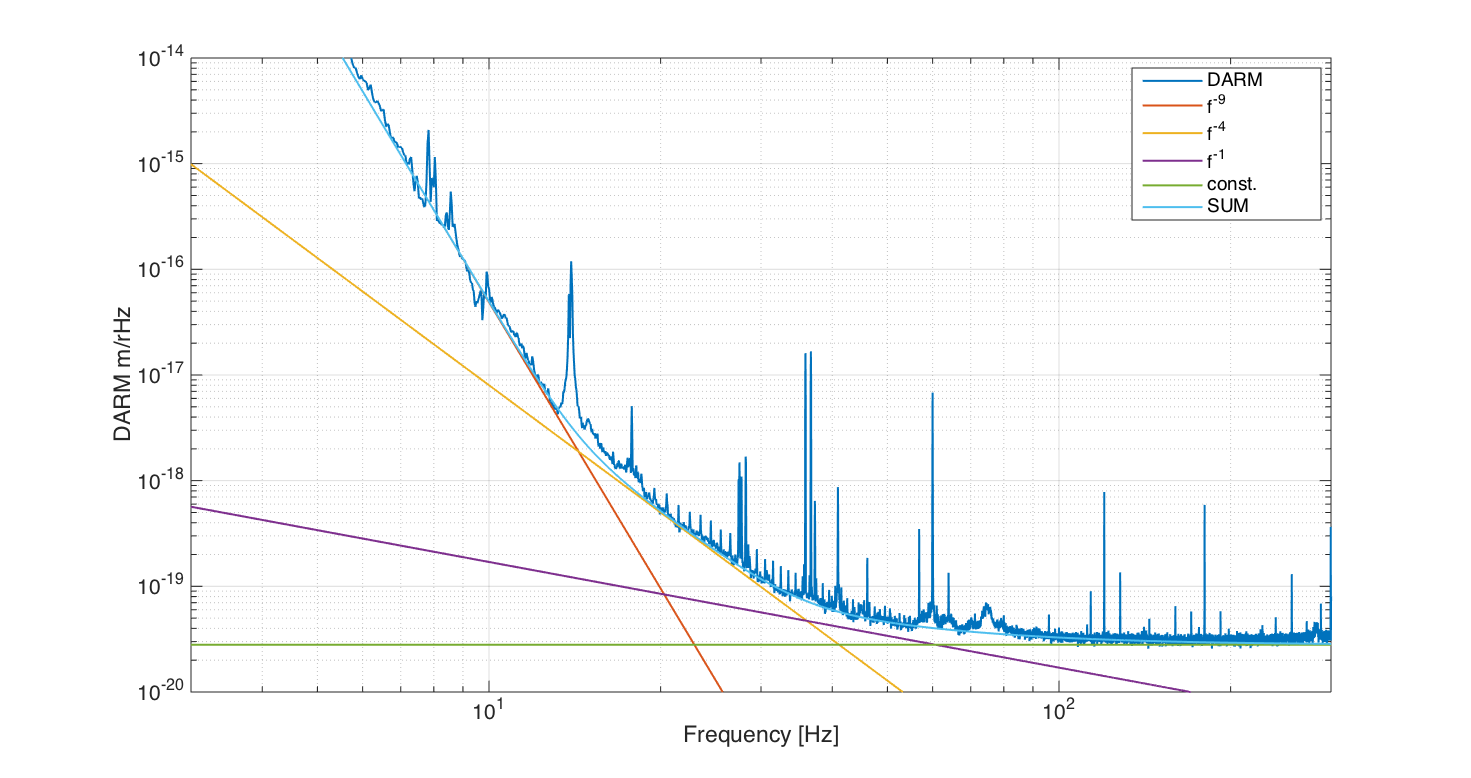
So I played the noise slope fitting game, to see what kind of noise shape we would need to explain the curve. At high frequency there's shot noise (flat) and Kiwamu's 1/f noise. At very low frequency (below 14 Hz) the noise curve looks very steep, and it seems to be something like 1/f^9, although it's very difficult to properly estimate the slope here, it could easily be 1/f^10.
What's most interesting to me is that between 20 and 40 Hz, the noise floor is explanable with a 1/f^4 slope. I find this interesting because it points to suspension displacement or actuation noise in the second to last stage, for example excess noise in a DAC or coil driver in one of the test masses, or even in the BS.
Caveat: this is just a hint, the slopes and amplitudes I estimated might be very wrong, and there's no real indication that we only have three or four separate noise contributions.
P.S. I wanted to upload the MATLAB fig file, but it's 21 Mb and so it seems I can't attach it here.