This is related to Jenne's elog entry about spot centering on the test masses and my retuning of the P2L gains.
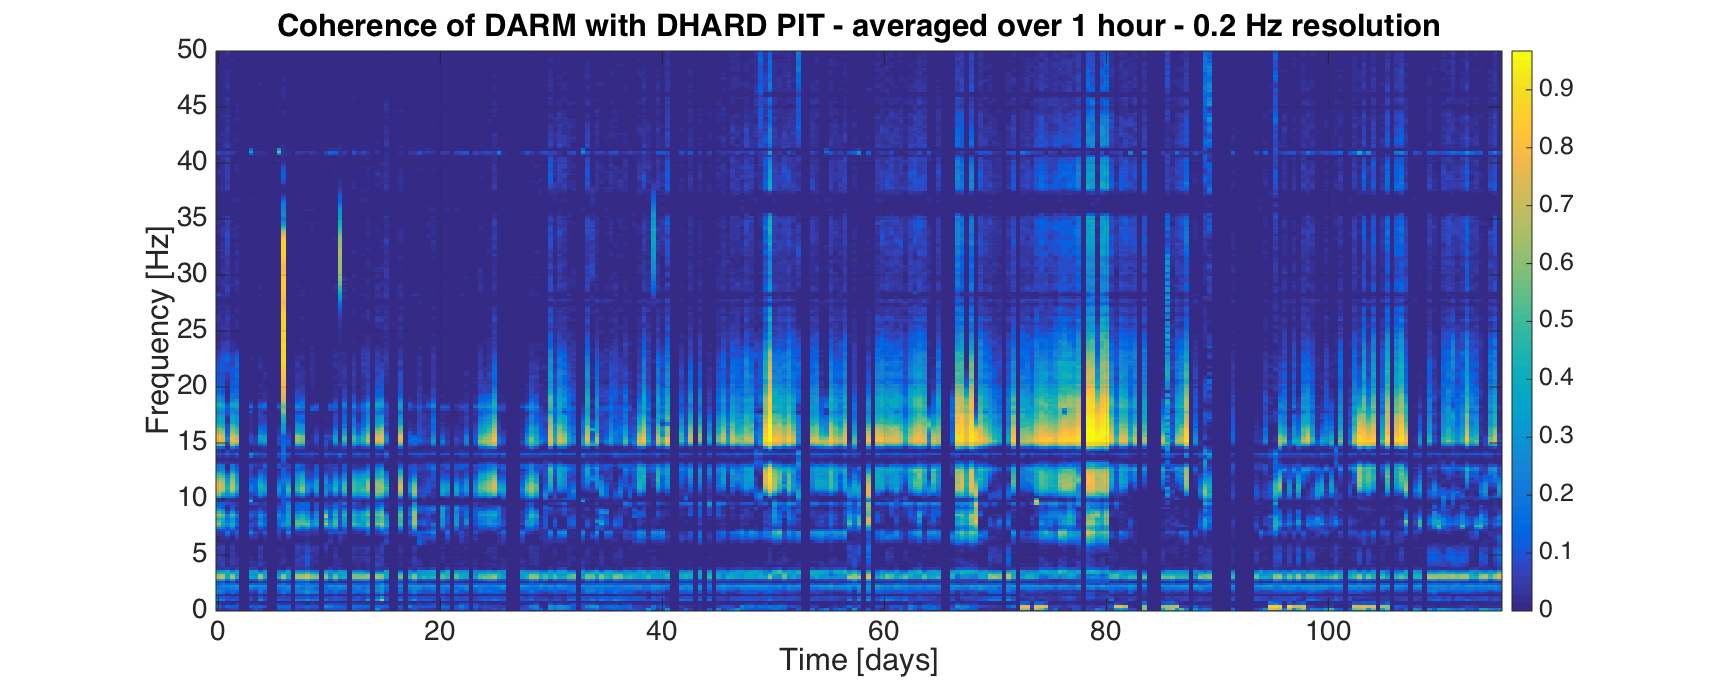
I computed the coherence between DARM (CAL-DELTAL_EXTERNAL) AND DHARD pitch (ASC-DHARD_P_OUT) for chunks of half hour of data, thorugh all O1, selecting all observing mode segments longer than 0.5 hours. I also computed the transfer functon between DHARD and DARM.
The first plot shows a 'coherence-gram' of the results. Each vertical section of the plot correspond to one lock segment, at a given time (see x axis for the number of days from O1 beginning). The color code shows the coherence. It's clear that the coherence in the low frequency region (10-20 Hz) changed quite a lot duing the run.
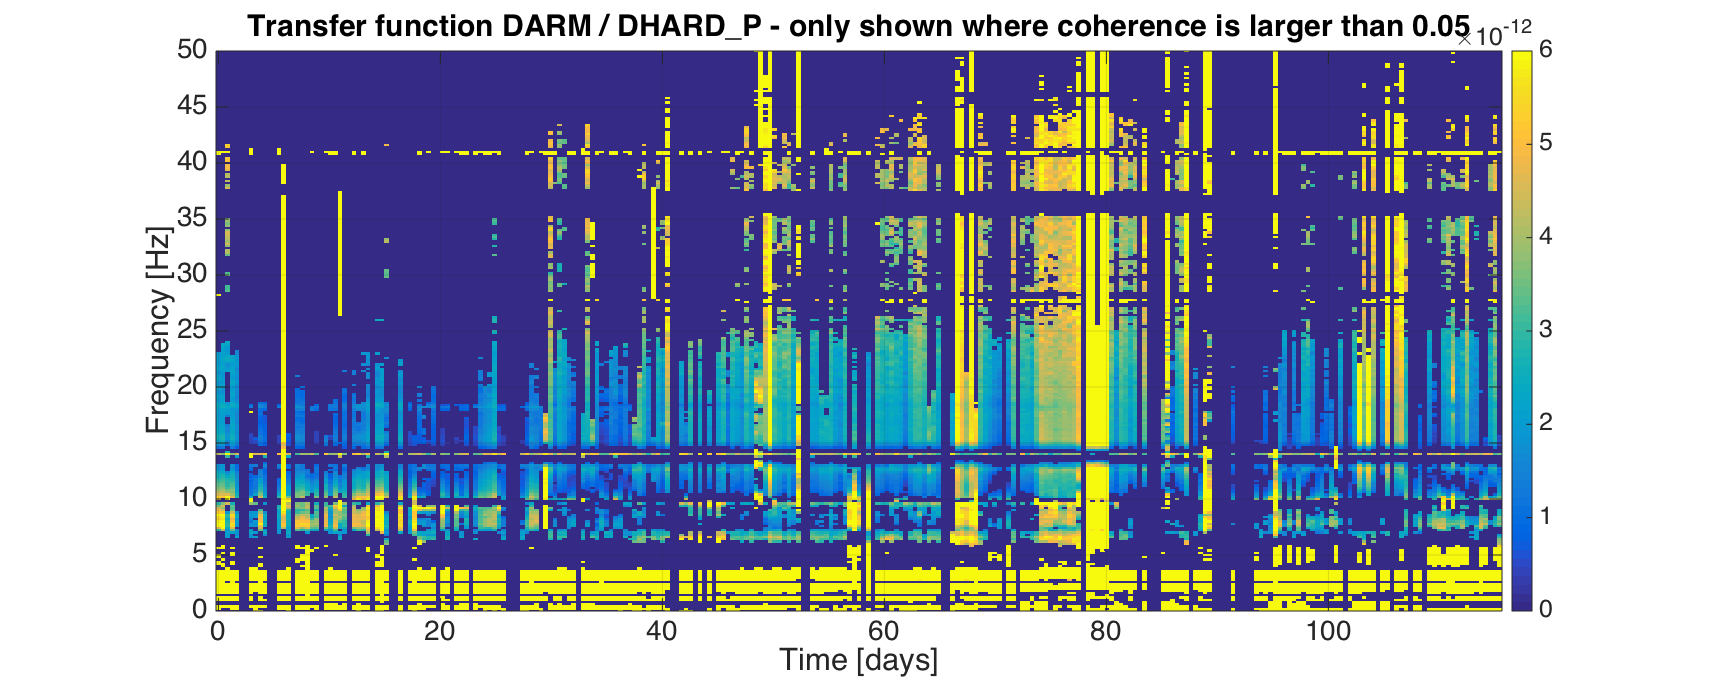
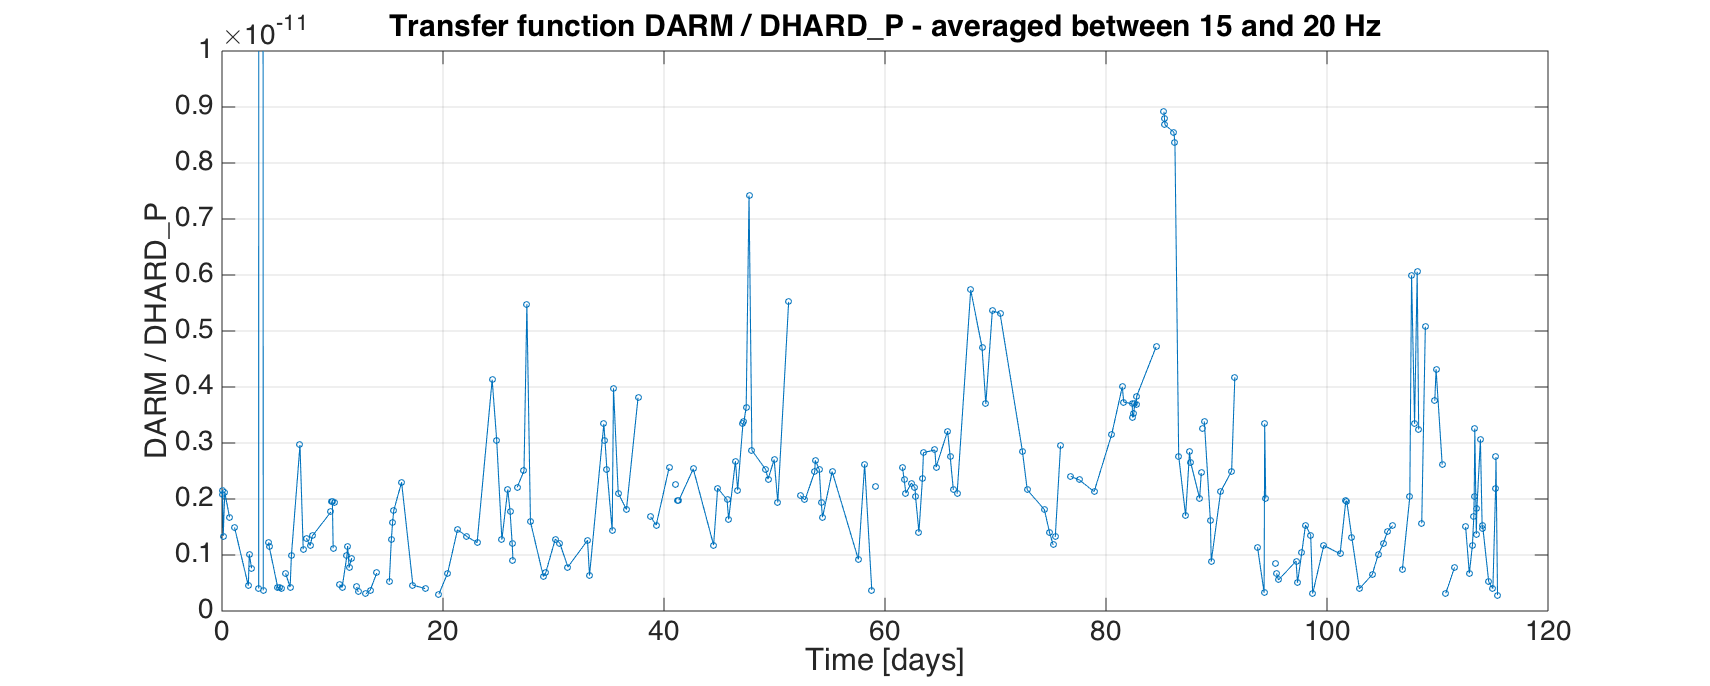
In a similar way, the second plot shows a 'transfer-function-gram' of the results. Each vertical section of the plot correspond to one lock segment, at a given time (see x axis for the number of days from O1 beginning). The TF is shown only for points with coherence above 0.05. Again, the variability over long periods is quite large. To better see this, the third plot shows the averaged TF between 15 and 20 Hz (the TF is flattish in this region). This plot shows even more clearly that the DHARD pitch to DARM coupling changed by large factors during the run, on a time scale of days.