Kyle, Gerardo

We want to know if we can use the measured exhaust flow of CP3 to distinguish between relatively low LN2 pump levels versus relatively high LN2 levels and then exploit this as part of a makeshift control loop and/or justify increasing the time interval between manual over-fills.  CP3 was last manually over-filled this past Wednesday afternoon.  So this morning, at the ~42 hour mark, we used a plastic garbage bag to capture the exhaust until the bag was taught full (see image).  We did this twice and got the following results:

220L/90sec = 145L/min, 220L/100sec = 130L/min.

6 hours later we manually over-filled CP3 at its normal 48 hour scheduled interval and then let the system settle down for 10 minutes or so before repeating the "bag" experiment.  This time we got the following results:

220L/115 sec = 115 L/min.

CONCLUSION:

This result is surprising and not as expected.  We may instead need to have Dave B. setup the exhaust PRESSURE signal (the not-blocked sensing line) so that we can trend it (I don't think we can currently for some reason).  We already know that the exhaust pressure does vary >50% with slow over-filling so we might make a course control loop that fills CP3 based upon a preset time interval and then shuts off based upon when an exhaust pressure threshold is exceeded.

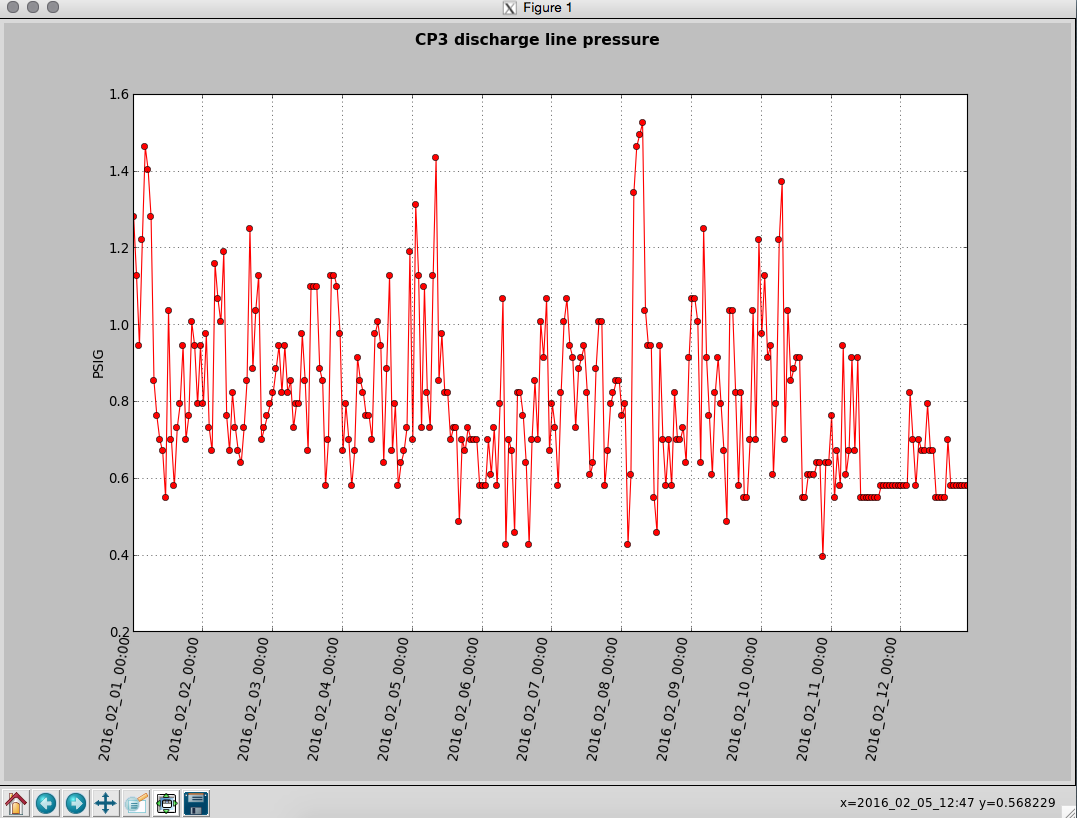
The discharge line pressure EPICS channel is HVE-MY:CP3_PT201 and it is indeed not in the DAQ at the moment, we'll add it during Tuesday maintenance.
In the mean time it is recorded every hour by the hourly autoburt backup system. Here are the commands to grep for this channel from yesterday for example (the space after the name is important)
david.barker@sysadmin0: cd /ligo/cds/lho/h0/burt/2016/02/12
david.barker@sysadmin0: grep "HVE-MY:CP3_PT201 " */h0vemy.snap
00:00/h0vemy.snap:RO HVE-MY:CP3_PT201 1 5.799755799755799e-01
01:00/h0vemy.snap:RO HVE-MY:CP3_PT201 1 5.799755799755799e-01
02:00/h0vemy.snap:RO HVE-MY:CP3_PT201 1 5.799755799755799e-01
03:00/h0vemy.snap:RO HVE-MY:CP3_PT201 1 8.241758241758241e-01
04:00/h0vemy.snap:RO HVE-MY:CP3_PT201 1 7.020757020757020e-01
05:00/h0vemy.snap:RO HVE-MY:CP3_PT201 1 5.799755799755799e-01
06:00/h0vemy.snap:RO HVE-MY:CP3_PT201 1 7.020757020757020e-01
07:00/h0vemy.snap:RO HVE-MY:CP3_PT201 1 6.715506715506715e-01
08:00/h0vemy.snap:RO HVE-MY:CP3_PT201 1 6.715506715506715e-01
09:00/h0vemy.snap:RO HVE-MY:CP3_PT201 1 7.936507936507936e-01
10:00/h0vemy.snap:RO HVE-MY:CP3_PT201 1 6.715506715506715e-01
11:00/h0vemy.snap:RO HVE-MY:CP3_PT201 1 6.715506715506715e-01
12:00/h0vemy.snap:RO HVE-MY:CP3_PT201 1 5.494505494505494e-01
13:00/h0vemy.snap:RO HVE-MY:CP3_PT201 1 5.494505494505494e-01
14:00/h0vemy.snap:RO HVE-MY:CP3_PT201 1 5.494505494505494e-01
15:00/h0vemy.snap:RO HVE-MY:CP3_PT201 1 5.494505494505494e-01
16:00/h0vemy.snap:RO HVE-MY:CP3_PT201 1 7.020757020757020e-01
17:00/h0vemy.snap:RO HVE-MY:CP3_PT201 1 5.799755799755799e-01
18:00/h0vemy.snap:RO HVE-MY:CP3_PT201 1 5.799755799755799e-01
19:00/h0vemy.snap:RO HVE-MY:CP3_PT201 1 5.799755799755799e-01
20:00/h0vemy.snap:RO HVE-MY:CP3_PT201 1 5.799755799755799e-01
21:00/h0vemy.snap:RO HVE-MY:CP3_PT201 1 5.799755799755799e-01
22:00/h0vemy.snap:RO HVE-MY:CP3_PT201 1 5.799755799755799e-01
23:00/h0vemy.snap:RO HVE-MY:CP3_PT201 1 5.799755799755799e-01