I have extended the cross spectrum analysis (see 25009 and its comments) to the entire O1 run.
Preliminary conclusions are that:
- Noise in 80 -160 Hz seem to have fluctuated by about +/- 20%.
- Noise in 80 -160 Hz seem to have kept the same spectral color.
I will dig into some interesting days or periods and study how different things were.
[Setting up band limited rms]
To analyze the cross spectrum as a function of time, I decide not to do spectrogram type analysis which may contain too much information. Rather I wanted to study the time evolution of the band limited rms. This approach is very similar to what Gabriele does (e.g. 22514).
I selected eight interesting bands in which I avoided tall peaks in the spectrum because I am not interested in their amplitudes in this study. The attached below shows the eight selected frequency bands.
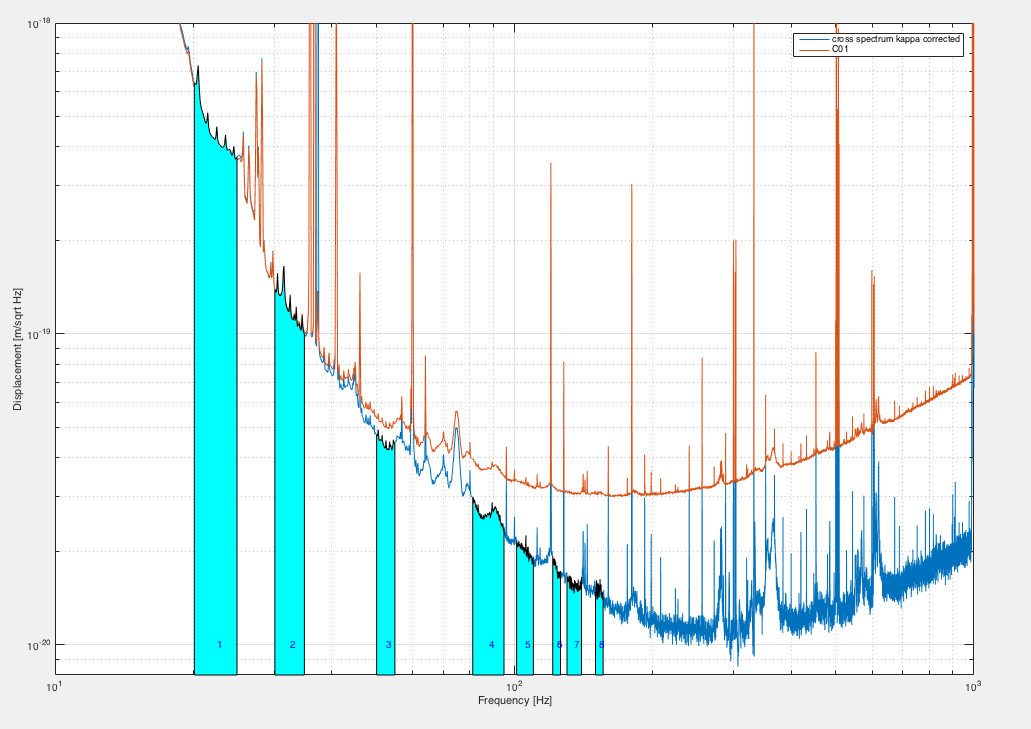
The frequency bands are chosen as follows, Band 1 = [20 25], Band 2 = [30 35], Band 3 = [50 55], Band 4 = [81 95], Band 5 = [101 110], Band 6 = [121 126], Band 7 = [130 140] and Band 8 =[150 156].
[Time-varying calibration parameters are corrected]
I have corrected for all kappas, the time varying calibration parameters, by applying them to the H1 DARM model of the calibration group. Since one cross spectrum is produced from a twelve minutes integration, kappas are also averaged for twelve minutes. Therefore, the data sets that I analyzed here must be less sensitive to calibration errors due to the time varying parameters which can deviate roughly by 10% from the reference values.
[Glitches and transients are removed]
I have removed data segments that were contaminated by some glitches or transients because I am not interested in their characteristics. This was done by computing an average Rayleigh static over the frequency range from 60 to 100 Hz and rejecting the segment which had a Rayleigh statistic deviating from unity by more than 10%. So the data set I analyze here has more or less good Gaussianity.
[Result 1: time evolution]
The attached plot below shows the band limited rms of the selected eight frequency bands as a function of time in days starting from Sep-01 00:00:00 UTC.
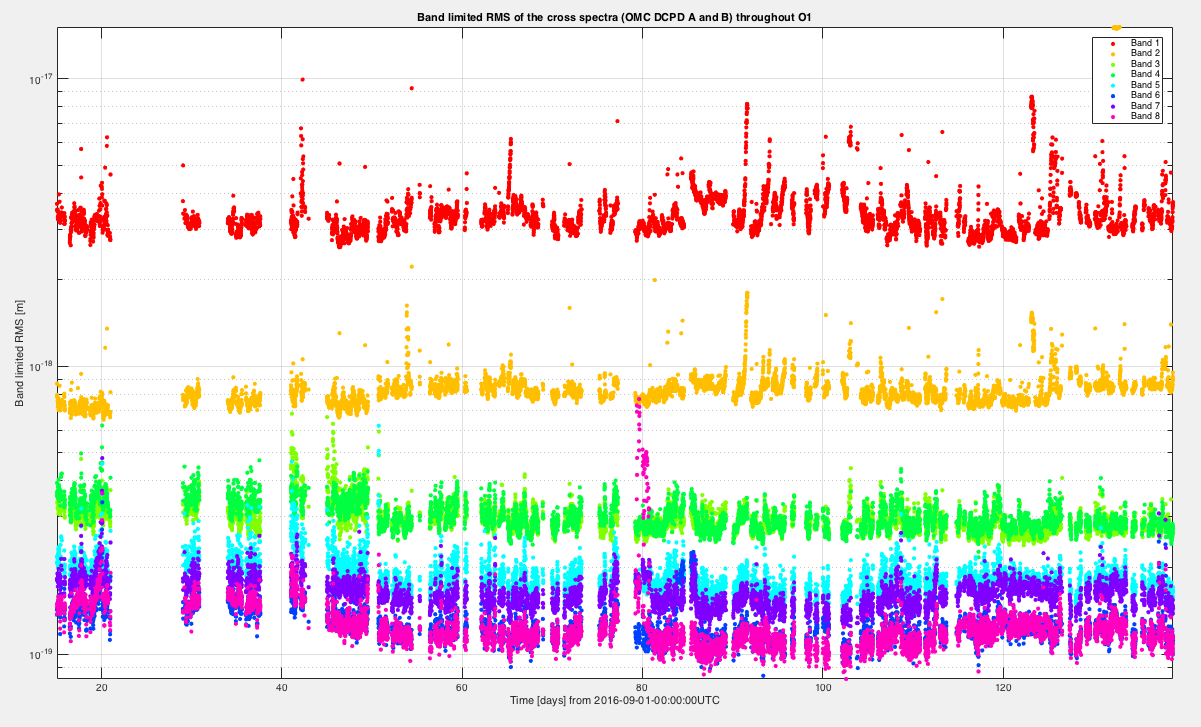
Typically, the two lowest bands (band 1 and band 2) vary more than the others presumably due to the fact that they can be easily degraded by seismic activities, alignment loop and LSC feedforward. In contrast, the rest of high frequency bands (bands 3 -8) are more stable but still do fluctuate. Notice that the high frequency bands decreased their rms at t = 50 days or so. I believe that this is due to Robert's improvement of reducing the PSL jitter coupling (22497). Also, one can find many interesting periods where one of the bands increased the displacement while the rest stayed unchanged and so on. I will try to check those interesting days later.
The fluctuation of the four highest bands (bands 5 -8) are at 15-20 % level (or 30-40 % in peak to peak) with high sigma data points excluded.
By they way, I forgot to multiply sqrt(df) with df being the frequency resolution to all the band limited rms  . The frequency resolution df is currently 0.1 and therefore all the data shown in the above plot should be lowered by a factor of sqrt(0.1) = 0.3. This does not change the main conlusions.
[Result 2: behavior of the high frequency bands]
Now, the plot below shows a primitive correlation plot.
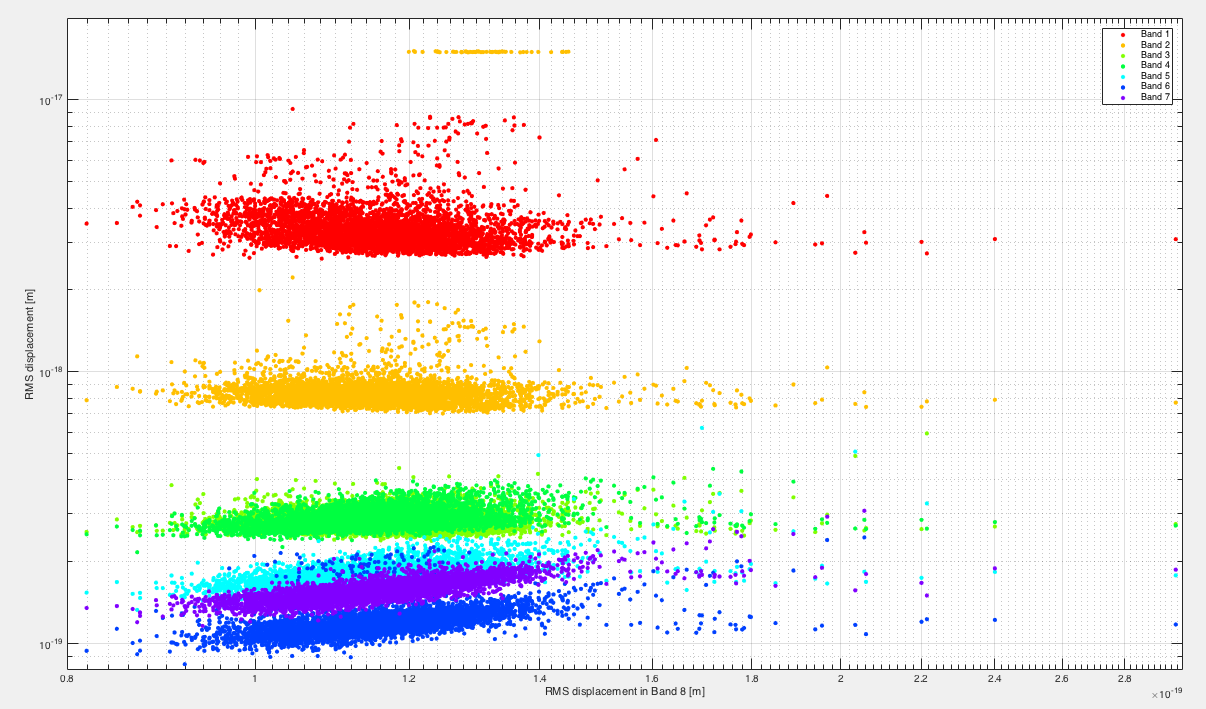
where the horizontal axis represents the displacement of band 8 and the vertical axis is for the rest of the bands in order to show correlation with band 8. I have excluded the first 50 days in which the high frequency noise was higher due to the PSL jitter coupling. By the way, the x-axis is in log scale although it may look linear to some people. As seen in the plot, bands 4-7 show a positive correlation with band 8. Also their slopes seem to be identical. These indicate that noise level above 80 Hz fluctuate in such a way that it keeps the same spectral color. As mentioned above, the size of fluctuation is about 15-20% for bands 4-8.
All the data in the above plot should be lowered by a factor of 0.3 for the same reason as the time series plot . This does not change the main conlusions.
A follow up: I have looked into the difference between the data before and after t = 44 days (Oct-13-2015). I still think that it is due to Robert's improvement of reducing PSL periscope jitter coupling.
[DARM and DCPD cross spectra]
Here is what the data says. See the attached below.
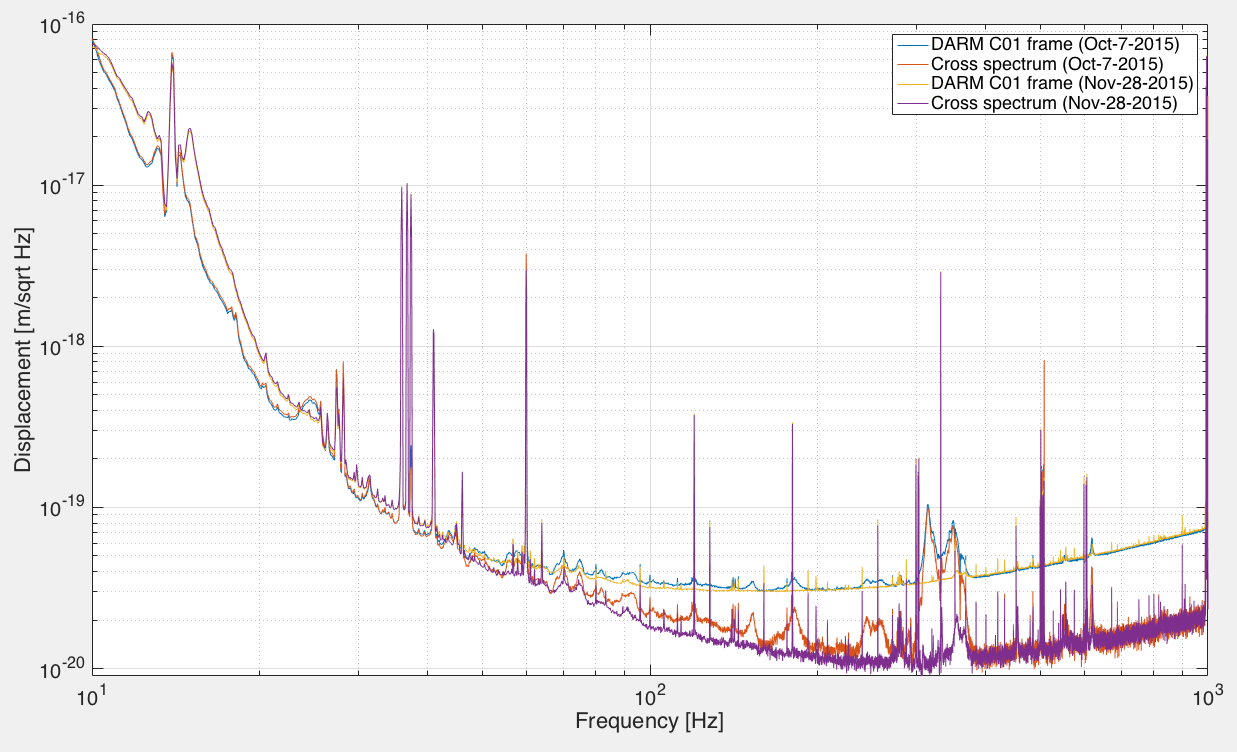
Here I plot two different spectra from two different days: a DARM spectrum generated by using the C01 recalibrated frame data and cross spectrum of DCPD A and B calibrated into the displacement for each day.
First of all, the DARM spectrum shows an improvements in the range from 50 Hz to 400 Hz (see cyan and yellow curves). Noise from the later days shows featureless noise in this frequency range. The same improvement is visible in the cross spectra. The PSL periscope jitter peaks in 300-400 Hz had almost gone below some other smooth noise floor and structures in 60 -300 Hz disappeared and left a smooth noise floor. Noise above 400 Hz seems unchanged between two days.
By the way, DARM of Oct-7-2015 showed a wandering peak (?) in 166-176 Hz band which are not visible in the above plot because they are averaged out by the 24 hours integration. Also, the discrepancy below 30 Hz between two days could be due to seismic and alignment, but I have not paid attention to this frequency region. I attach the actual fig file as well.
[Qalitatively same improvement seen in detechar summary page]
Somewhat consistent improvement can been seen in the detchar summary page. I attach a gif animation comparing the spectra from the two days -- one can see the improvements not only at the 300-400Hz peak but also in 50 - 300 Hz.
Note that despite the different GWINC curves and title location, the x and y axes seem to be identical.

Later, it turned out that the optical gain was not compensated in all the above data. See the correction at alog 25918