brynley.pearlstone@LIGO.ORG - posted 19:13, Sunday 28 February 2016 - last comment - 11:07, Monday 29 February 2016(25772)
0.5Hz Comb Investigation Update
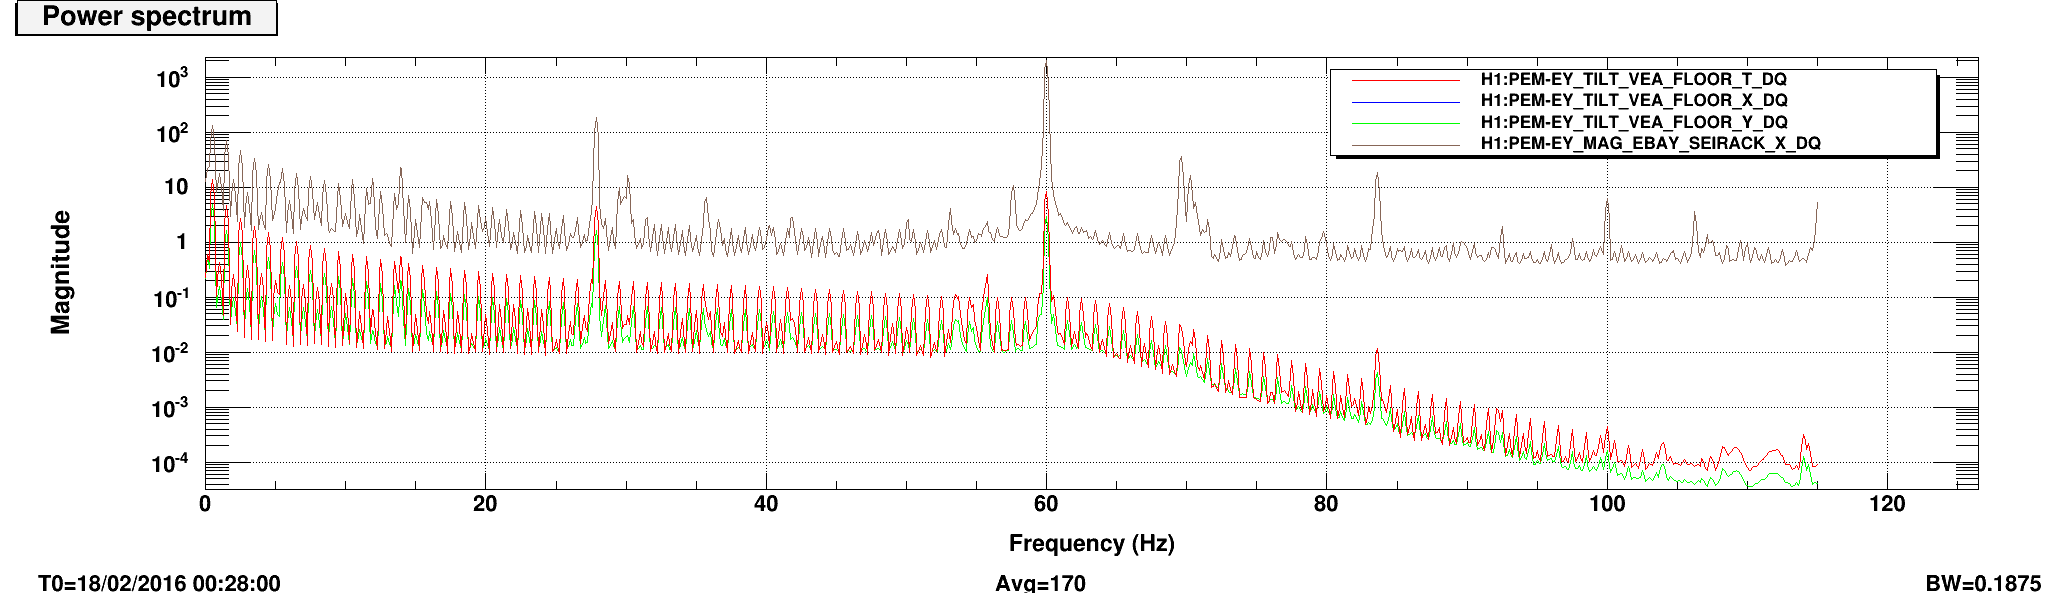
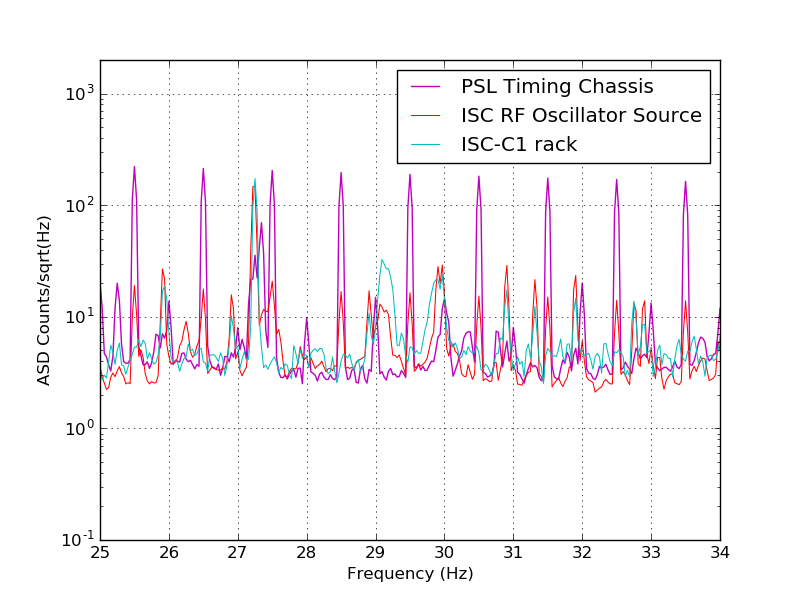
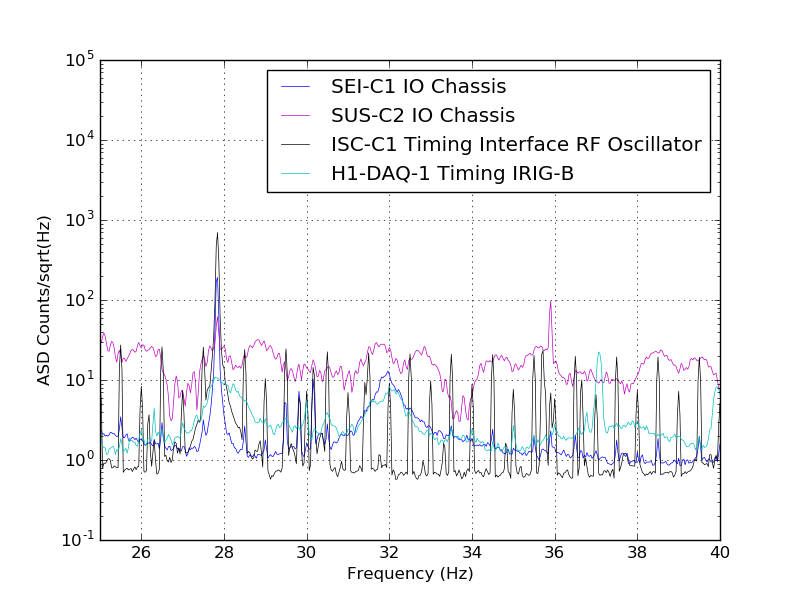
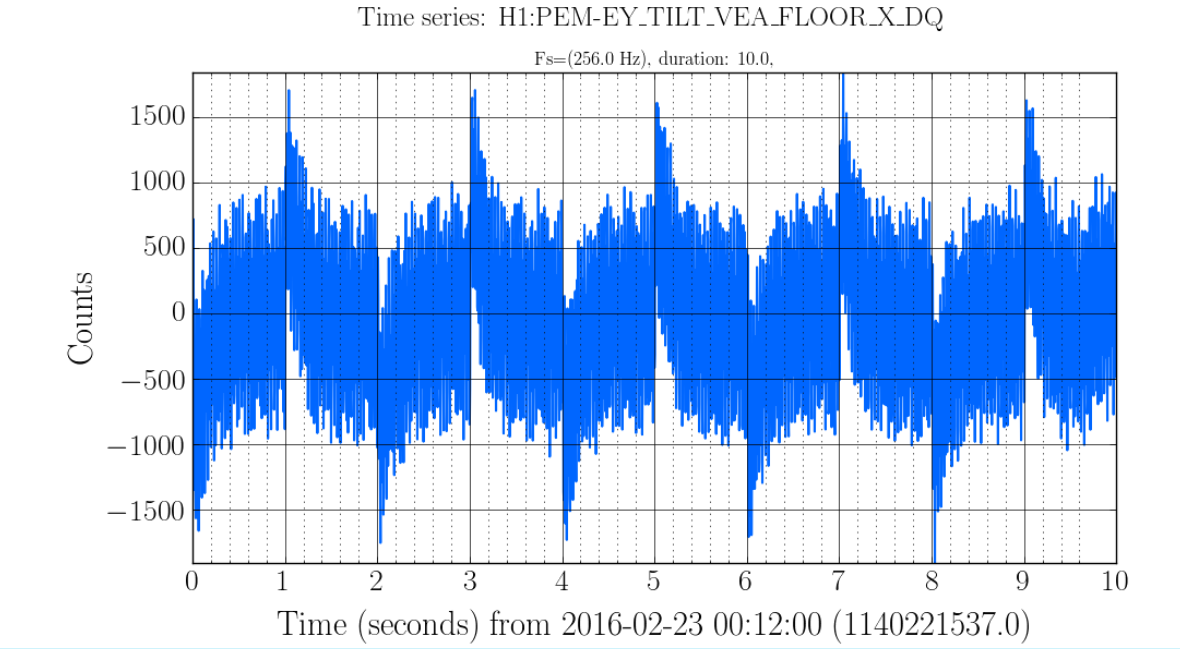
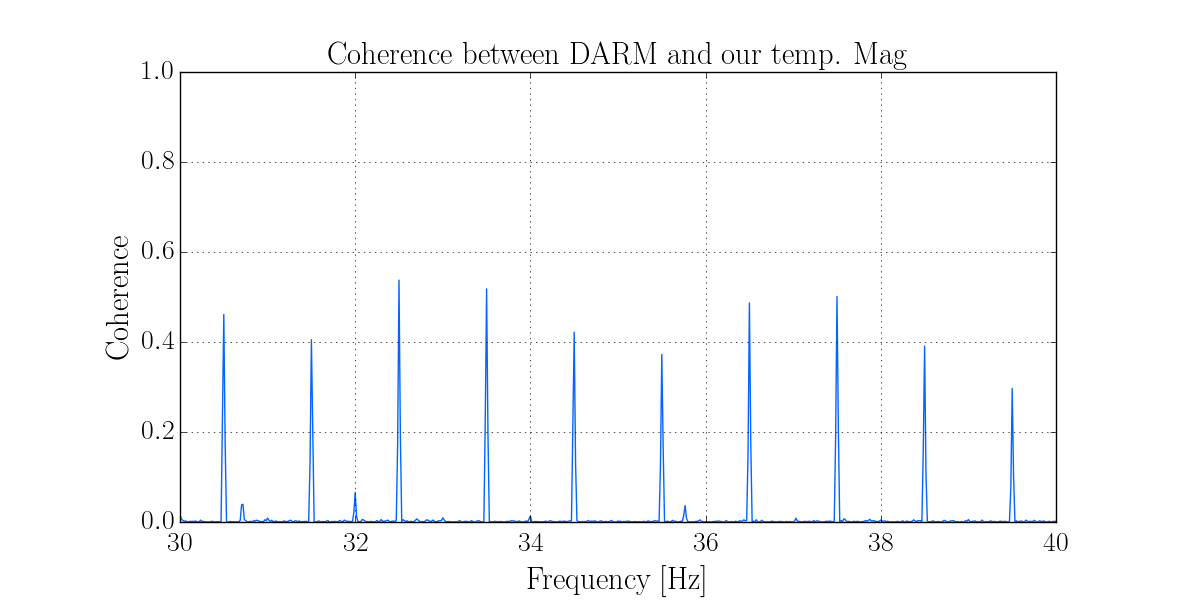
Vinny, Brynley

Over the past 2 weeks, we used a temporary magnetometer in the CS CER and the EY CER and computer racks. We placed the magnetometer in a range of locations, and created spectra from the magnetometer at each. It had been mentioned that the timing slave card in various chassis might be the cause - as an LED with a 2 second period is fitted on each. To that end, after a first study, our follow up was aimed at those chassis with timing slave cards.

The first spectral plot attached shows spectra from the EY CER.  All of the traces are near the noise floor because we were not using the typical magnetometer filter box, which applies a gain of 100 above 1 Hz.  Despite this the combs are easily and increasingly visible as the magnetometer gets closer to the timing racks.  Each trace is made with 170 averages of .1875 Hz resolution FFTs.

The second plot shows spectra from the corner station CER.  This time we used an SR560 pre-amplifier to get our gain of 100 above 1 Hz.  Once again the comb was stronger as the magnetometer got closer to the timing racks.  Once again each trace is made from 170 averages of .1875 Hz resolution FFTs.

The third figure shows the spectra taken from the CER at EY. We used the SR560 to apply gain of 100 above 1Hz. For this plot, the magnetometer was placed near to a number of instruments, some with timing slave cards, and some without.  EY's TCS-1 rack RF oscillator source. The 0.5Hz combs are very strongly visible throughout the signal. The trace is made from 15 minutes of data, with 0.03125Hz resolution

The fourth plot is a short segment of the magnetometer's time series associated with the spectrum in the third plot. The magnetometer was placed near to the  Timing Slave card on EY's TSC-TRF Oscillator source. The time series shows that on second boundaries, the magnetometer sees a large field, quickly dieing away. No post-processing or filtering has been performed on this time series.

There has been no "Observing" data during these investigations, but the detector had "DC Lock" from Feb. 20 04:00 - Feb 20 12:00 .  The last image is a oherence plot (between H1:LSC-DARM_IN1_DQ and H1:PEM-CS_ADC_4_28_OUT_DQ) made from those 8 hours of data.  64 second FFTs, 899 averages.  The comb is clearly visible, confirming that this is the comb appearing in DARM.
Images attached to this report
Comments related to this report
NOTE: To clarify, at EY, we temporarily usurped on the PEM TILT X channel for our magnetometer. The plots which show the TILT are in fact our temporary magnetometer. BP 02/29/2016