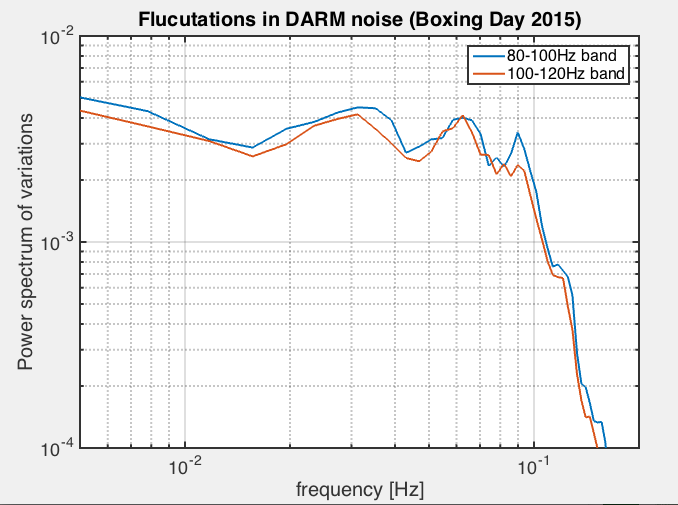
Along the same lines of earlier investigations into DARM noise fluctuations, I checked the "high frequency" (1-100mHz) spectrum of the DARM RMS in 2 bands between 80 and 100Hz. The fluctuations in these BLRMSs are fairly featureless, though there appear to be small peaks at 30 and 70mHz (see plot).
The code used to generate these plots is:
gwd = GWData;

	data7 = gwd.fetch('26 Dec 2015 8:00:00', 3*60*60, 'H1:SUS-ETMX_L2_DAMP_MODE7_RMSLP_OUT16', 'mDV');

	dd7 = GWFilt.detrend(data7.data);

	fs = data7.rate; tfft = 256;

	[p7, ff] = pwelch(dd7, hann(fs * tfft), [], fs * tfft, fs);


	data8 = gwd.fetch('26 Dec 2015 8:00:00', 3*60*60, 'H1:SUS-ETMX_L2_DAMP_MODE8_RMSLP_OUT16', 'mDV');

	dd8 = GWFilt.detrend(data7.data);

	[p8, ff] = pwelch(dd8, hann(fs * tfft), [], fs * tfft, fs);


	loglog(ff, [p7, p8]); axis([0.005, 0.2, 1e-4 1e-2]); grid on

	title('Flucutations in DARM noise (Boxing Day 2015)')

	legend('80-100Hz band', '100-120Hz band')

	xlabel('frequency [Hz]')

	ylabel('Power spectrum of variations')