During O1 run we have monitored slow variations in the DARM actuation and sensing functions with several ~35 Hz and a ~350 Hz line at both observatories.
Systematics in the actuation function mostly affect systematic errors at frequencies below UGF, while systematics in the sensing mostly show up at higher frequencies.
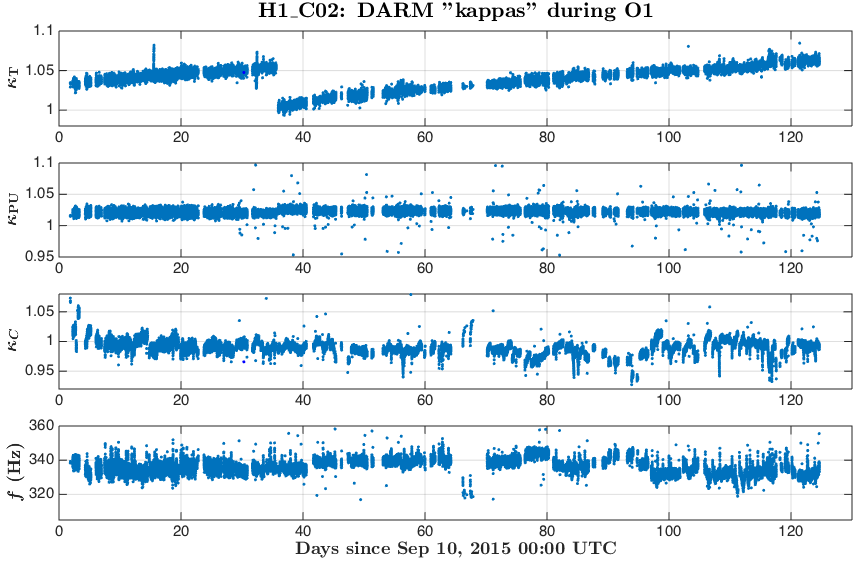
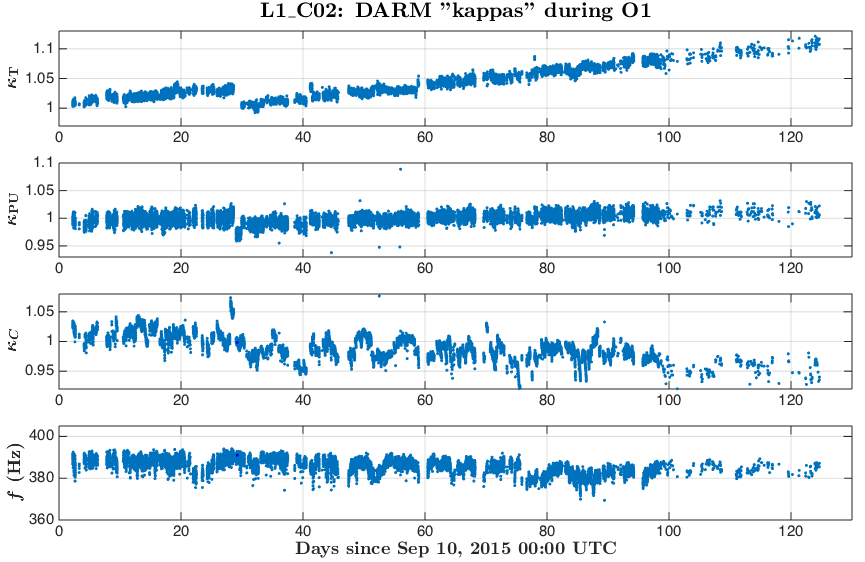
Variation in the DARM sensing is parametrized with an overall sensing gain κC and a cavity pole frequency fC. Most dramatic changes in both of these parameters appear in the beginning of locks, which could be a result of changing of cavity modes due to thermal heating of test masses and possibly some other effects.
Variation in the DARM actuation is parametrized with κTST and κPU. The κTST is a scalar gain factor of the ESD driver actuation which drives only the TST stage. We believe that it changes mostly due to charge accumulation on the surface of an ETM. The κPU is a scalar gain factor of the actuation functions of the upper stages PUM and UIM. The coil-drivers as used to for actuation of these stages. We do not believe that κPU should change over time, but monitoring it helps to make sure that we do not miss any slow variations that we did not account for.
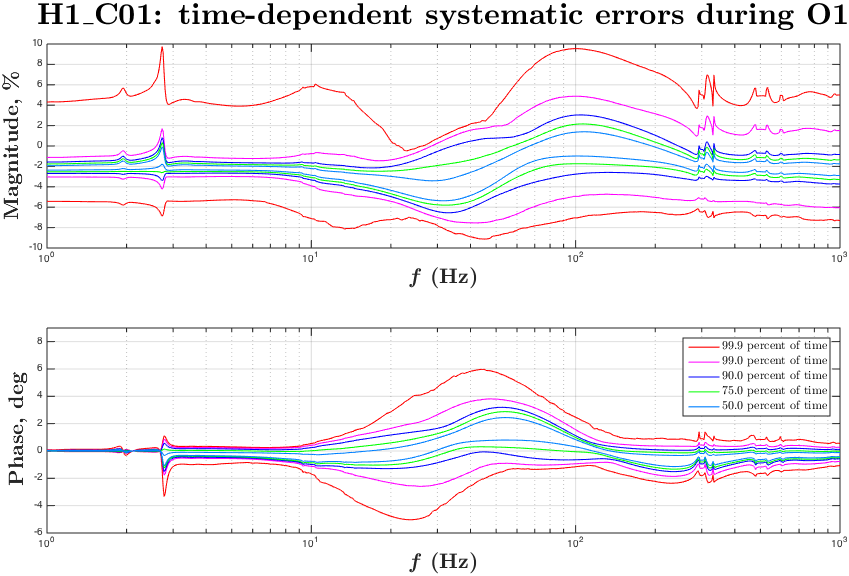
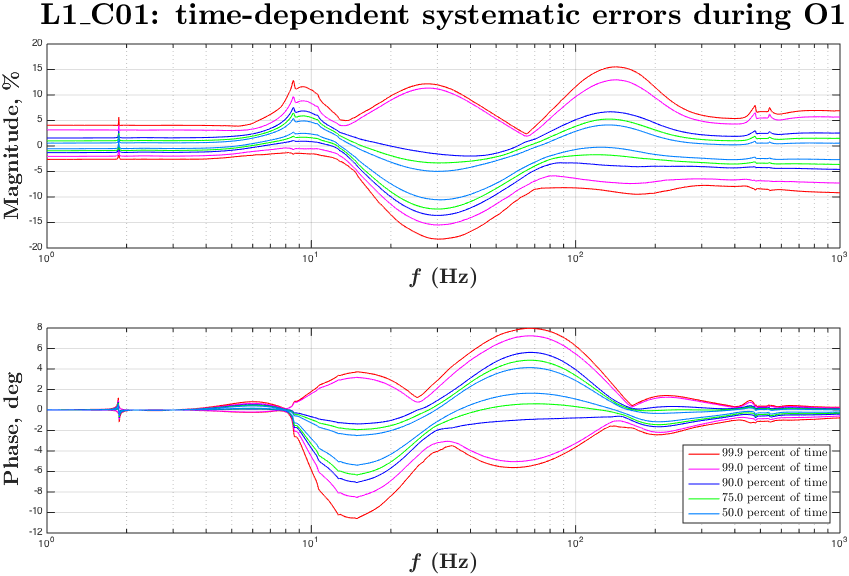
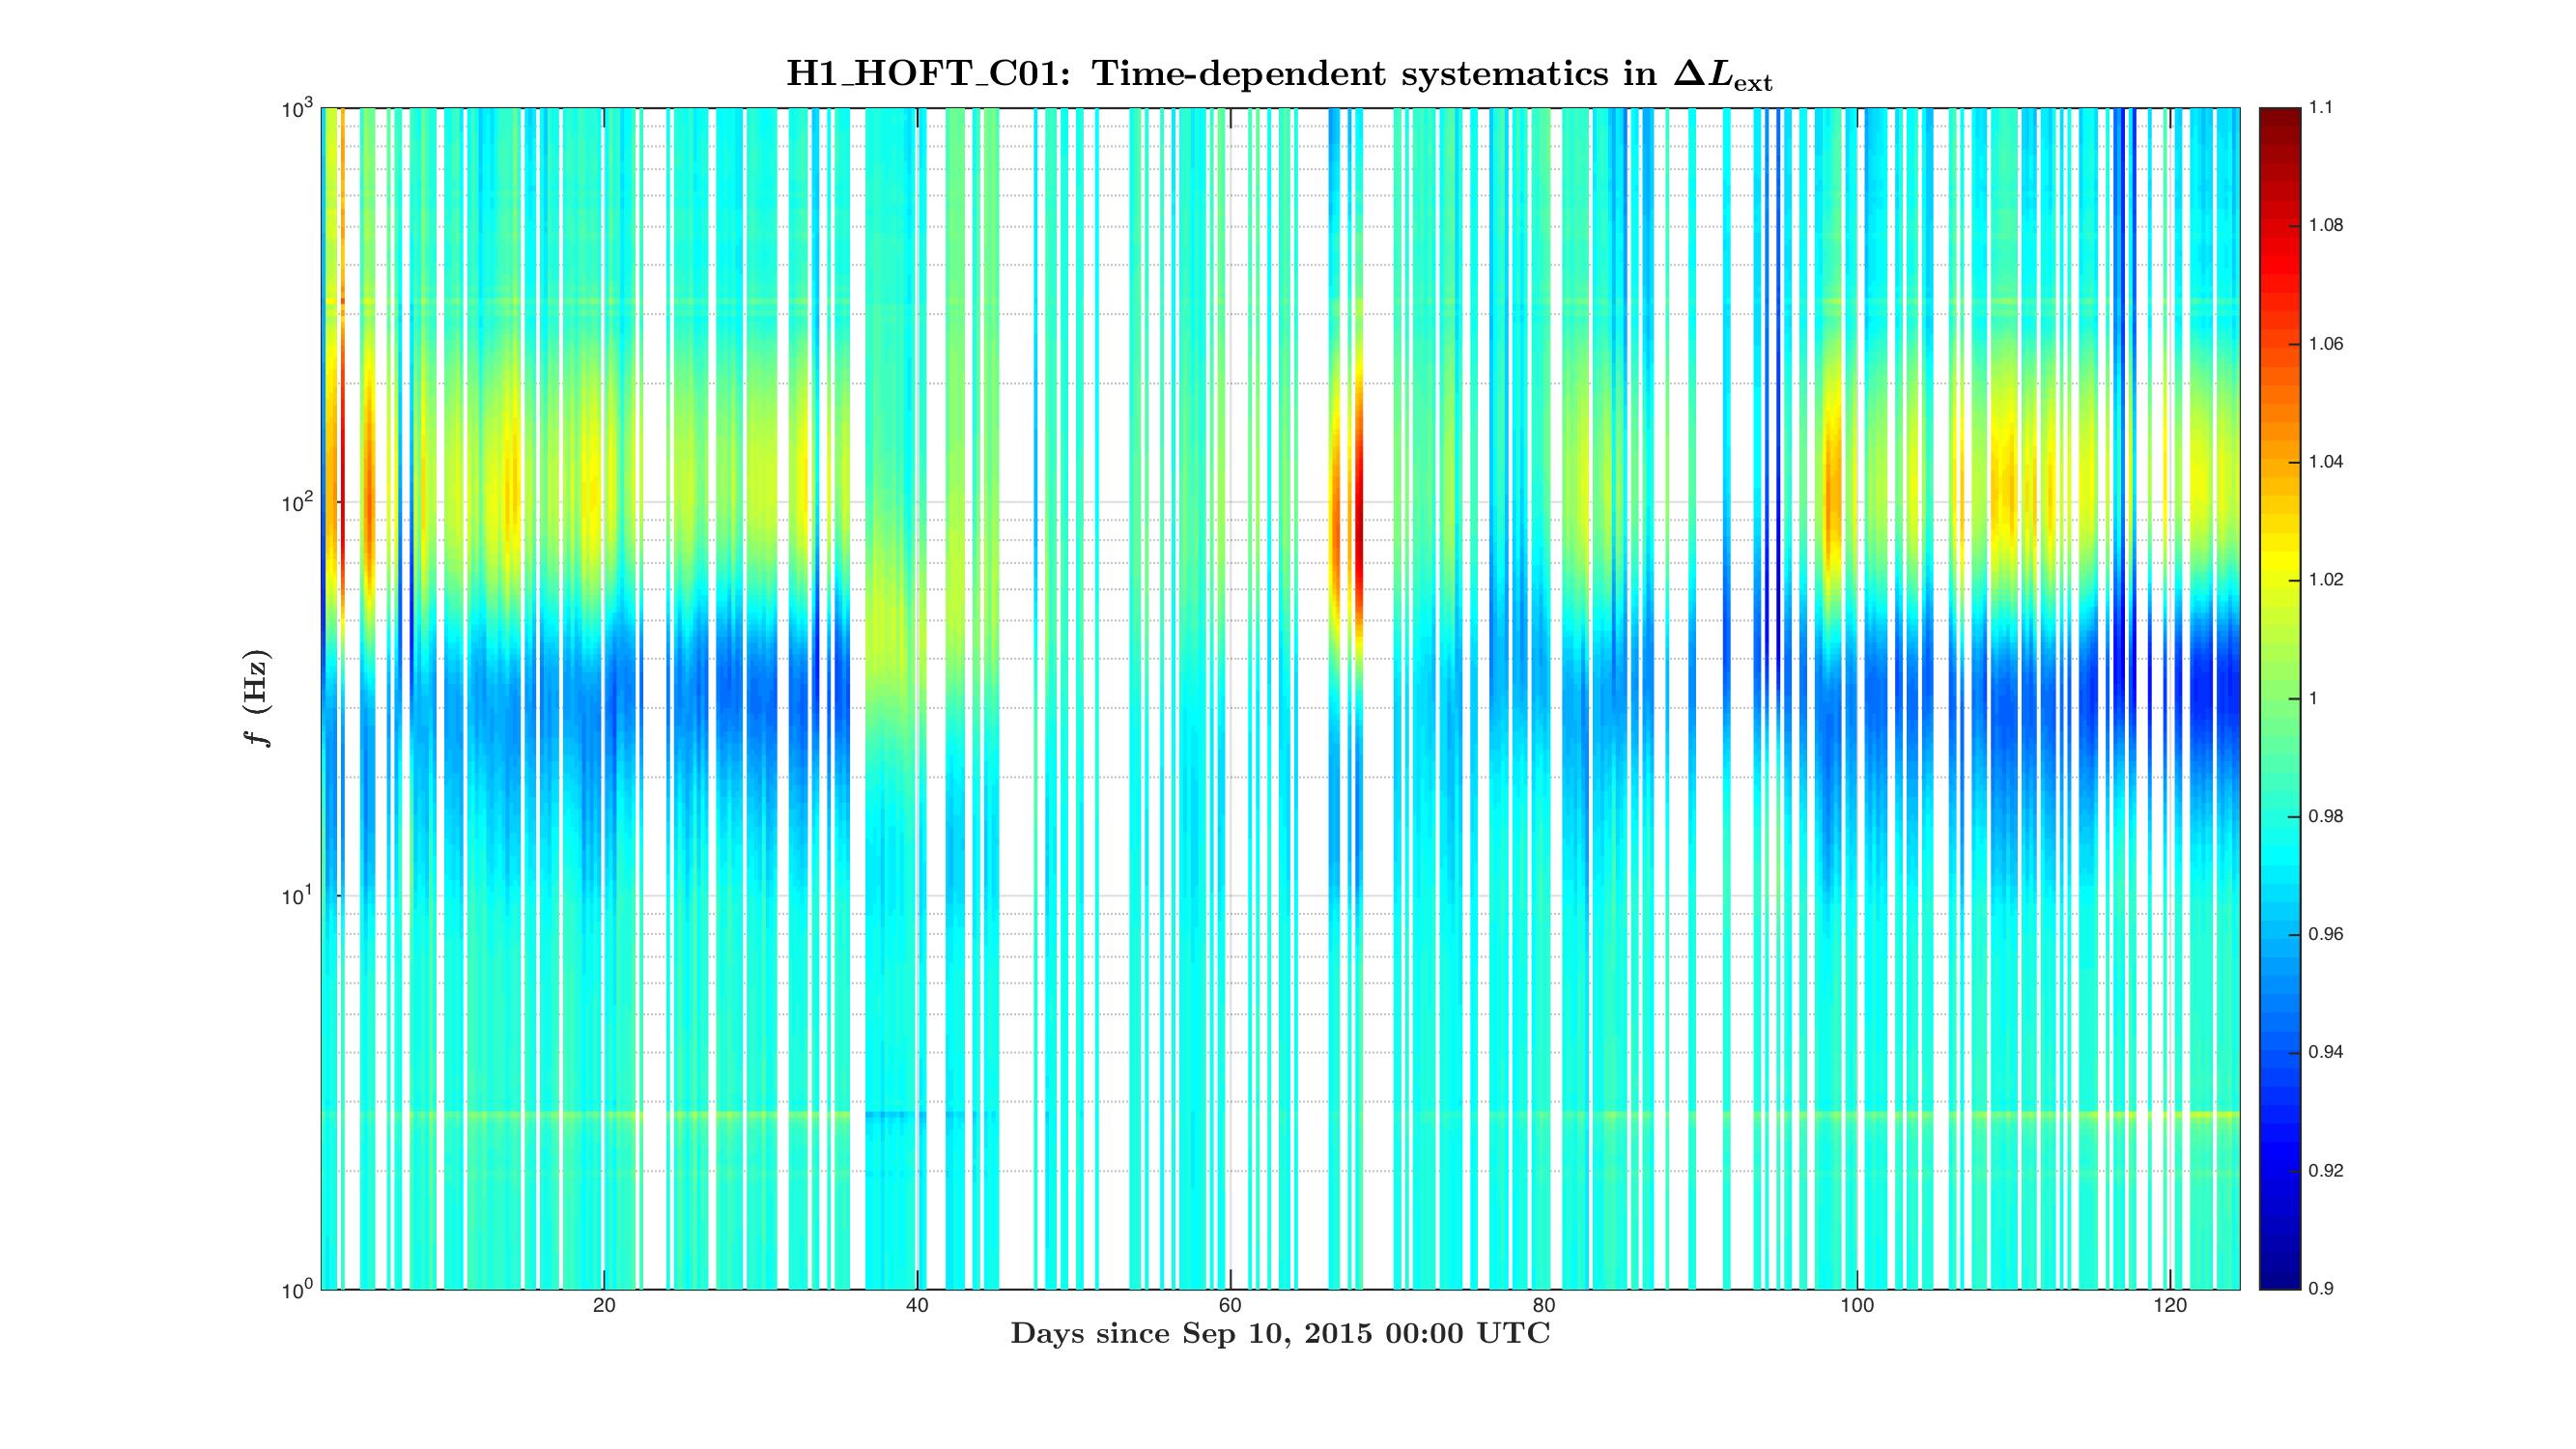
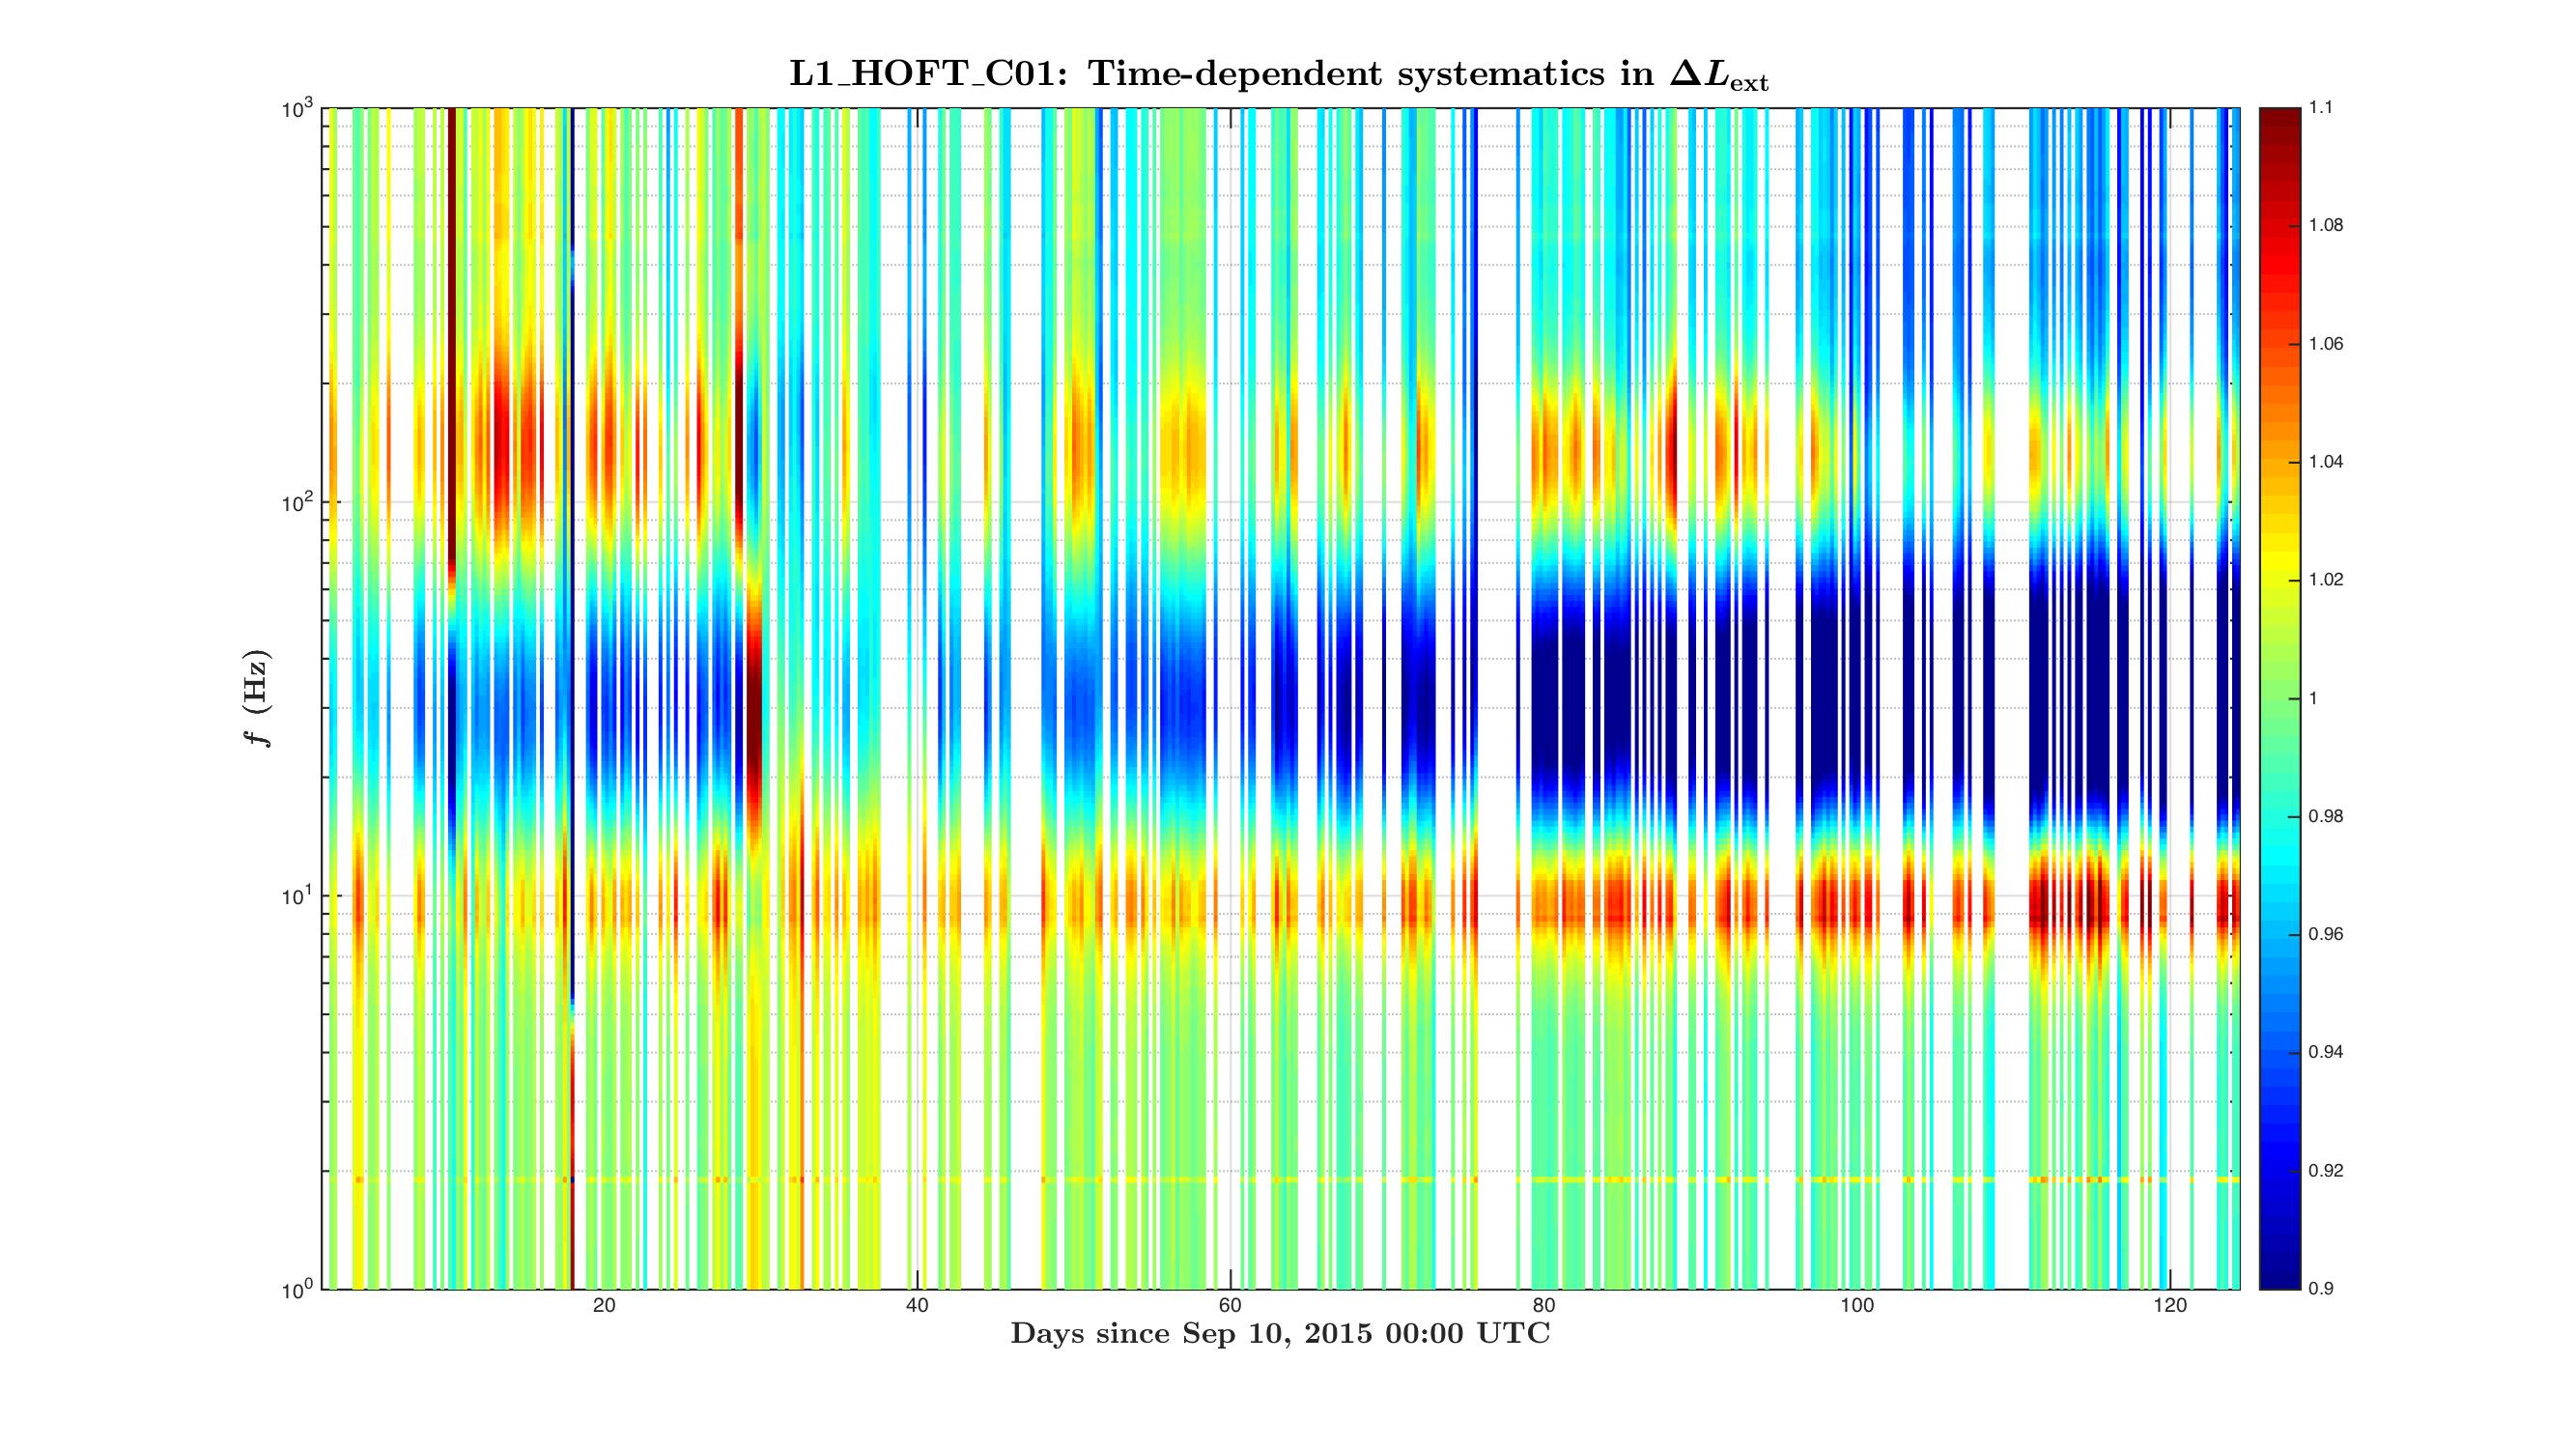
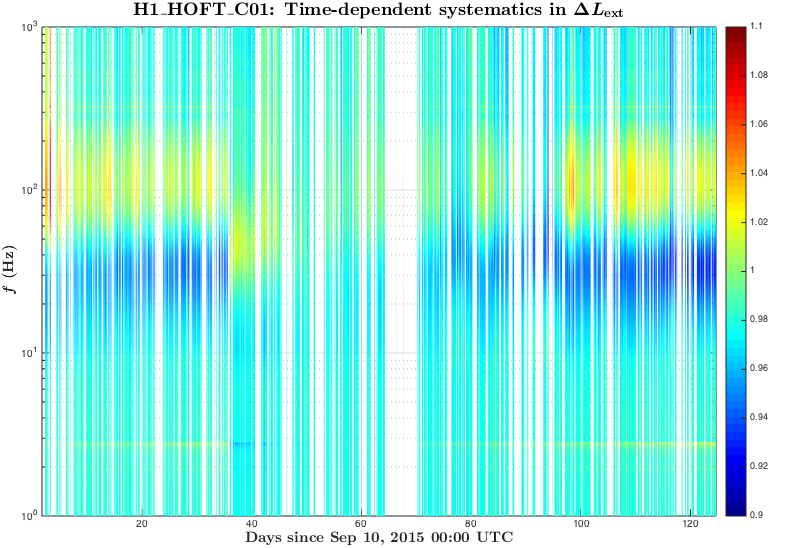
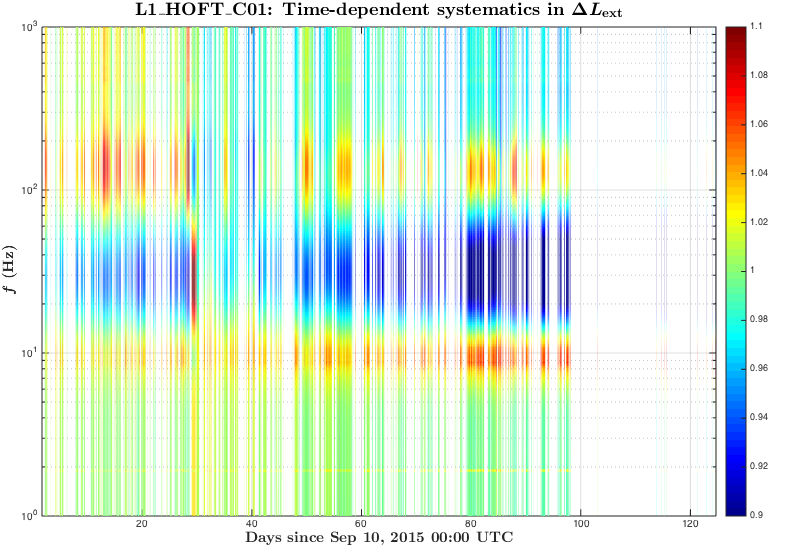
Time-frequency plots of the known time-depedent systematics in the overall DARM response function calculated from κTST, κPU, κC and fC in O1 run are attached.
Update: replaced figures (portrait -> landscape orientation) for convenience.
Summary
- By eye balling it looks like the state vector from C02 filters out most of the outliers that appear in C01 kappas, but there still remain some amount of outliers;
- Most of the extreme time-dependent systematic errors are coming from variations in actuation function in L1; and it's not so clear in H1 (without removing the outliers);
-
Overall systematic errors at both observatories seem to stay mostly (apart from outliers) close to the limits stated in the early O1 calibration paper;
(although the systematic errors in L1 increased steadily by about 10% by the end of O1 due to drift in the ESD actuation strength) - The κtst shows a steady drift of the ESD actuation strength at both observatories, to avoid loosing range of the ESD drivers at L1 we might want to do an ESD bias sign flip at a more regular rate.
Details
The time-frequency plots of the time-dependent systematic errors in the reconstructed ΔLext and plots of "kappa" values during O1 are attached to this report.
The state vector in C01 seemed to give a noisier set of values, to filter out "good data points" for these plots we have used the state vector from C02 frames, and 128 second median values from C01 frames for kappas.
The median kappa values are taken from the values extracted from C01 are saved to CalSVN:
Runs/O1/$(IFO)/Measurements/TimeDependence/20160301_C01_kappas_AllOfO1/kappa_C01_$(IFO)_all_wStateVector.txt
From C02 we took a single value every 128 seconds (without taking any average or median), these values are saved to
Runs/O1/$(IFO)/Measurements/TimeDependence/20160301_C02_kappas_AllOfO1/kappa_C02_$(IFO)_all_wStateVector.txt
We have produced a plot of systematic uncertainty boundaries for 50%, 75%, 90%, 99%, ~100% of the cases in O1 when HOFT_OK was 1.
This information or similar analysis can be used to set a 1-sigma uncertainty bars on the time-dependent systematics in C01 due to uncorrected kappas (the values were taken only for times when all of the KAPPA*_OK and HOFT_OK were 1).
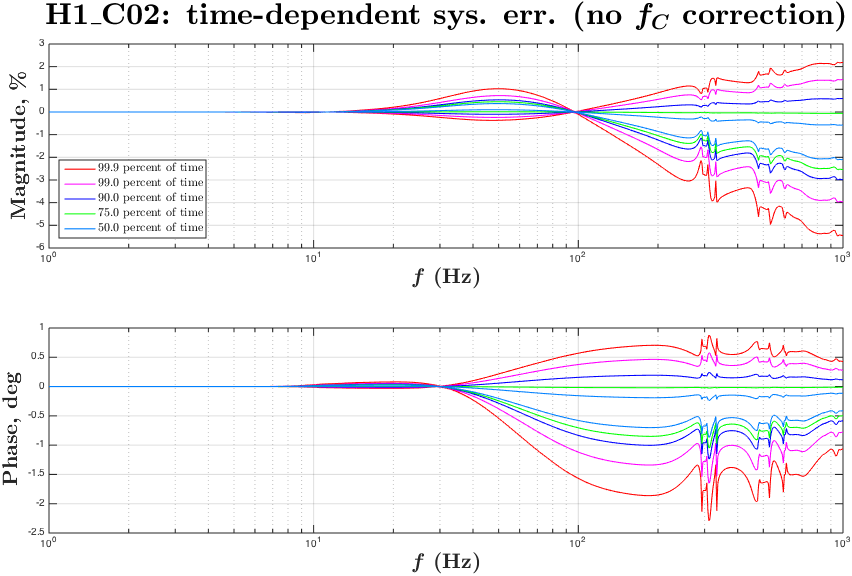
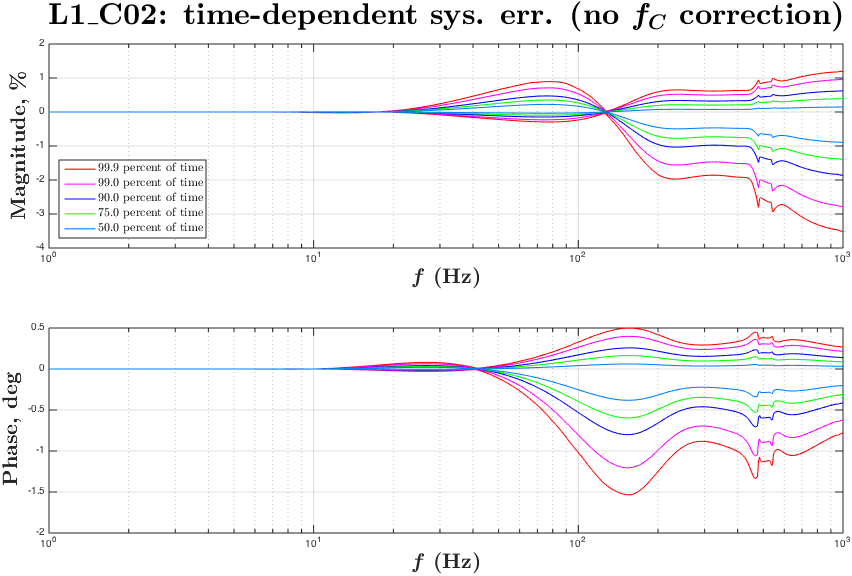
The plots for C02 give an estimation of time-dependent systematic errors caused by not correcting fC.