[Aidan, Kiwamu, Elli, Cao]
SUMMARY:
We prformed a definitive test to confirm the HWSY beam reflected off the HR surface of ITMY. The test arrived at the same conclusion as a previous test reported in alog25617.
The beam reflected from HR surface is the one observed at :
SR3 PITCH: 1458 urad
SR3 YAW : -216.9 urad
(The nominal value of SR3 PITCH and YAW at the moment are 563 and -153.9)
METHOD:
1. We turned of SR3 CAGE SERVO, and initiate excitations of PITCH and YAW of SR3. These excitations ran for about 5 hours yesterday, between 1141238996 and 1141254773 (gps time)
| Excitation | Amplitude (urad) | Frequency (mHz) |
| PITCH | 1500 | 10.3 |
| YAW | 2000 | 3.7 |
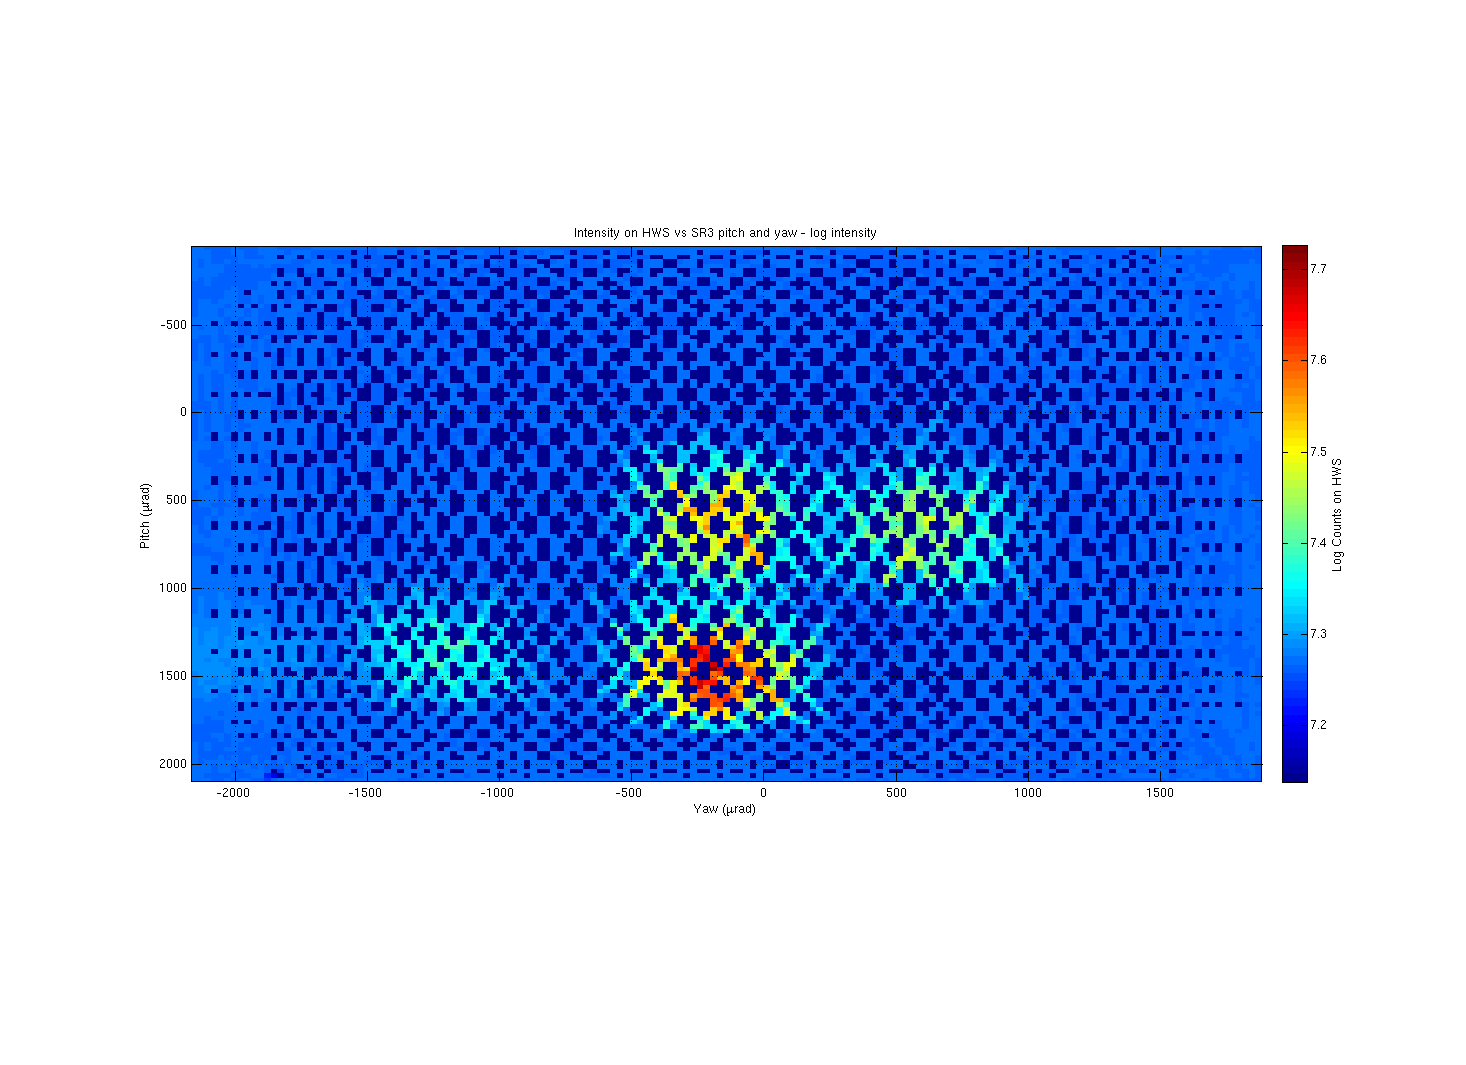
This allowed us to scan SR3 and map out all the possible reflected beams onto the HWSY from the TOTAL_PIXEL_VALUE recorded by the HWSY.

| Spot | PITCH (urad) | YAW (urad) |
| 1 | 563.4 | -153.9 |
| 2 | 1458 | -216.9 |
| 3 | 1332 | -1220 |
| 4 | 626.3 | 613.3 |
We will use the numbers to refer to each spot in the rest of this report. We are currently centered on beamspot 1
2. We modify the HWS magnification H1:TCS-ITMY_HWS_MAGNIFICATION from 17.5 to 7.5 according to T1400686
3. This morning, we moved SR3 alignment to the PITCH and YAW values corresponding to the four spots. At each spot:
- Stream the HWS images to make sure the spot was centered
-Create a new folder that does not contain reference *.mat file so the HWSY take new reference each time a new spot was centered.
-Start HWS and steam data
-Initiate 50 mHz, 2urad amplitude excitation on ITMY YAW (H1:SUS-ITMY_M0_OPTICALIGN_Y_EXC)
-Observe the changes in the three signals:
1. H1:SUS-ITMY_L3_OPLEV_YAW_OUTPUT (OPLEV Yaw)
2. H1:SUS-ITMY_M0_OPTICALIGN_Y_OUTPUT
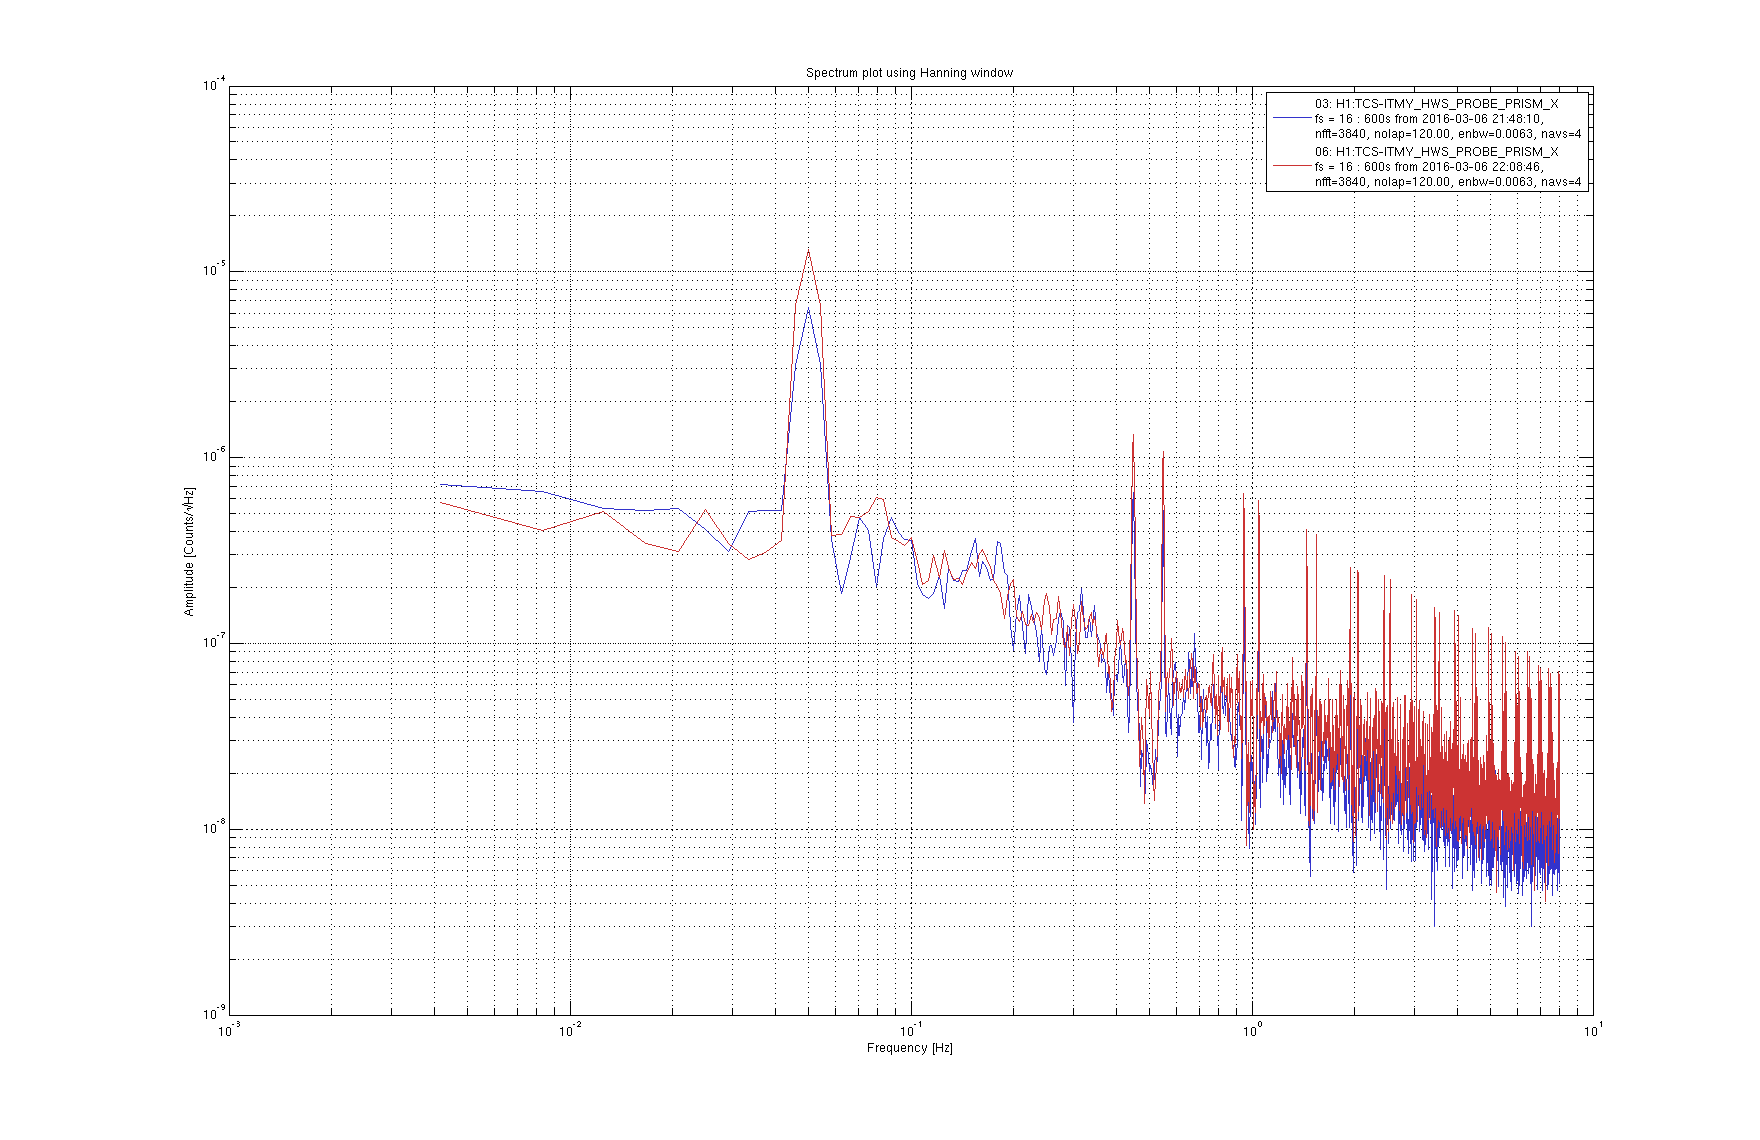
3. H1:TCS-ITMY_HWS_PROBE_PRISM_X (Prism X)
- Let the excitation run for 5-10 mins, turn off the excitation, let the OPLEV Yaw and Prism X signals to stabilize and epeat the procedure for all the spots.
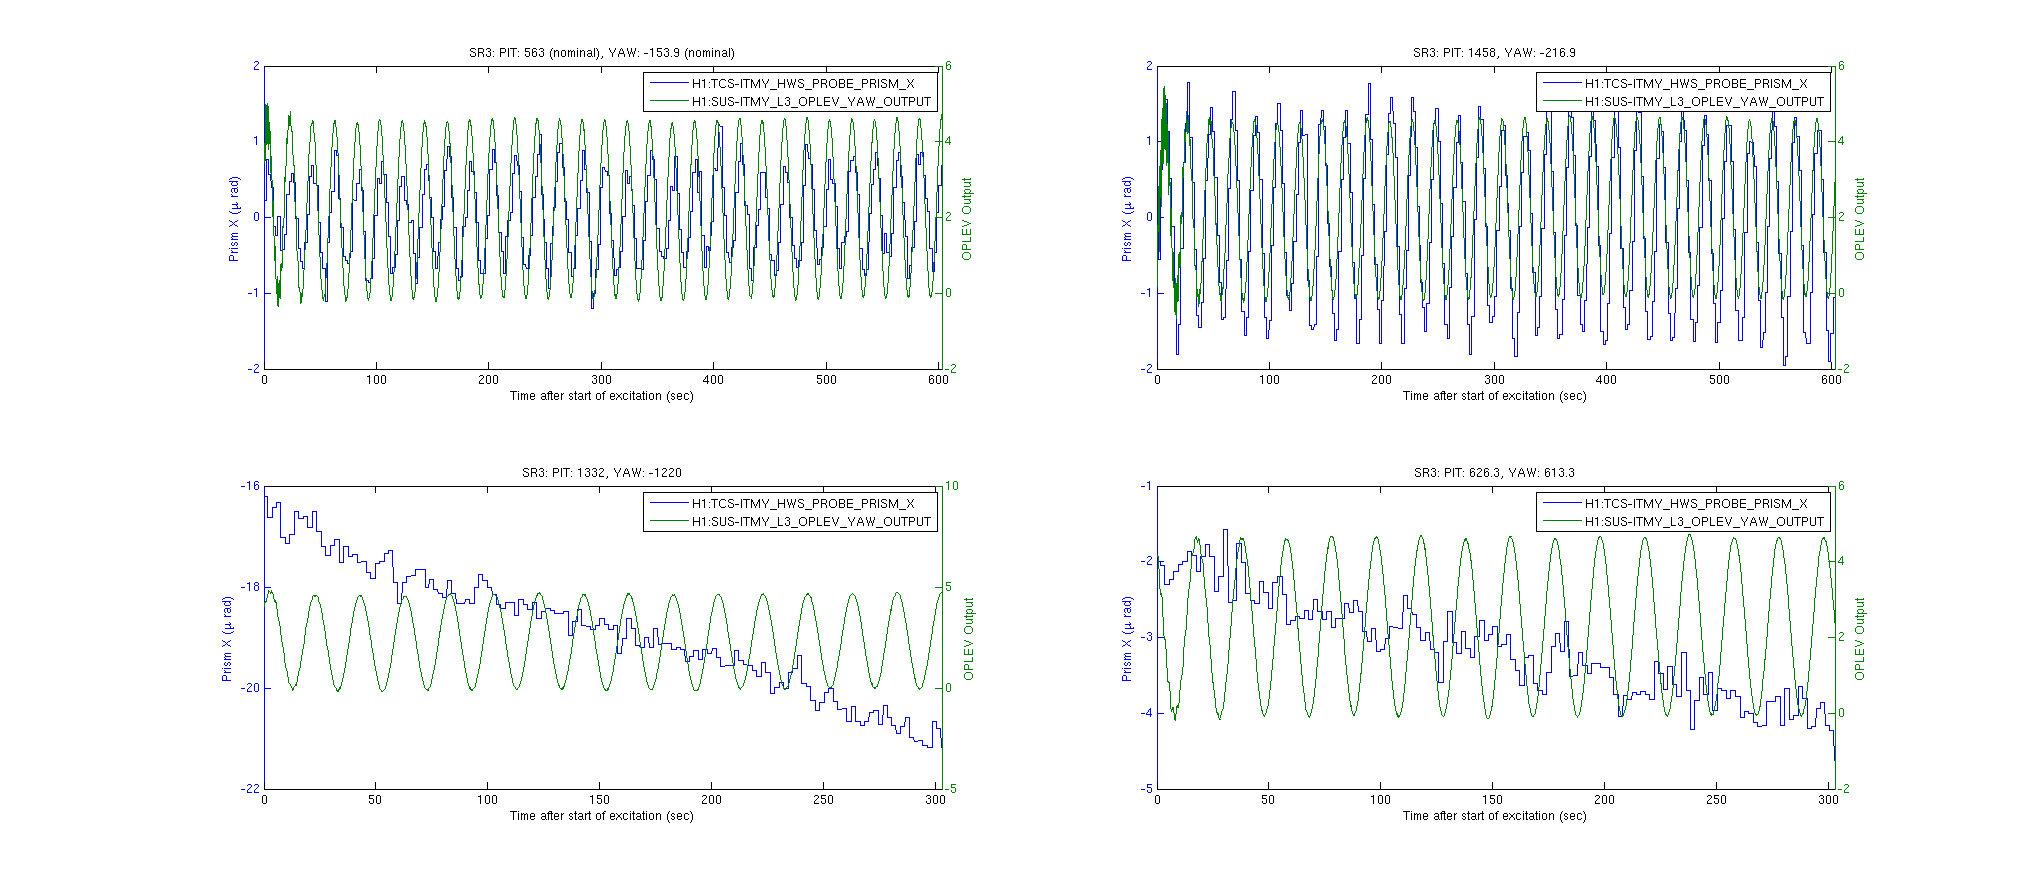
4. We then plot the signals H1:TCS-ITMY_HWS_PROBE_PRISM_X and H1:SUS-ITMY_L3_OPLEV_YAW_OUTPUT and compared the magnitude of oscillation in Prism X measured (if any). The one that has the largest 50 MHz signal is the one reflected off the HR surface of ITMY.
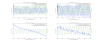
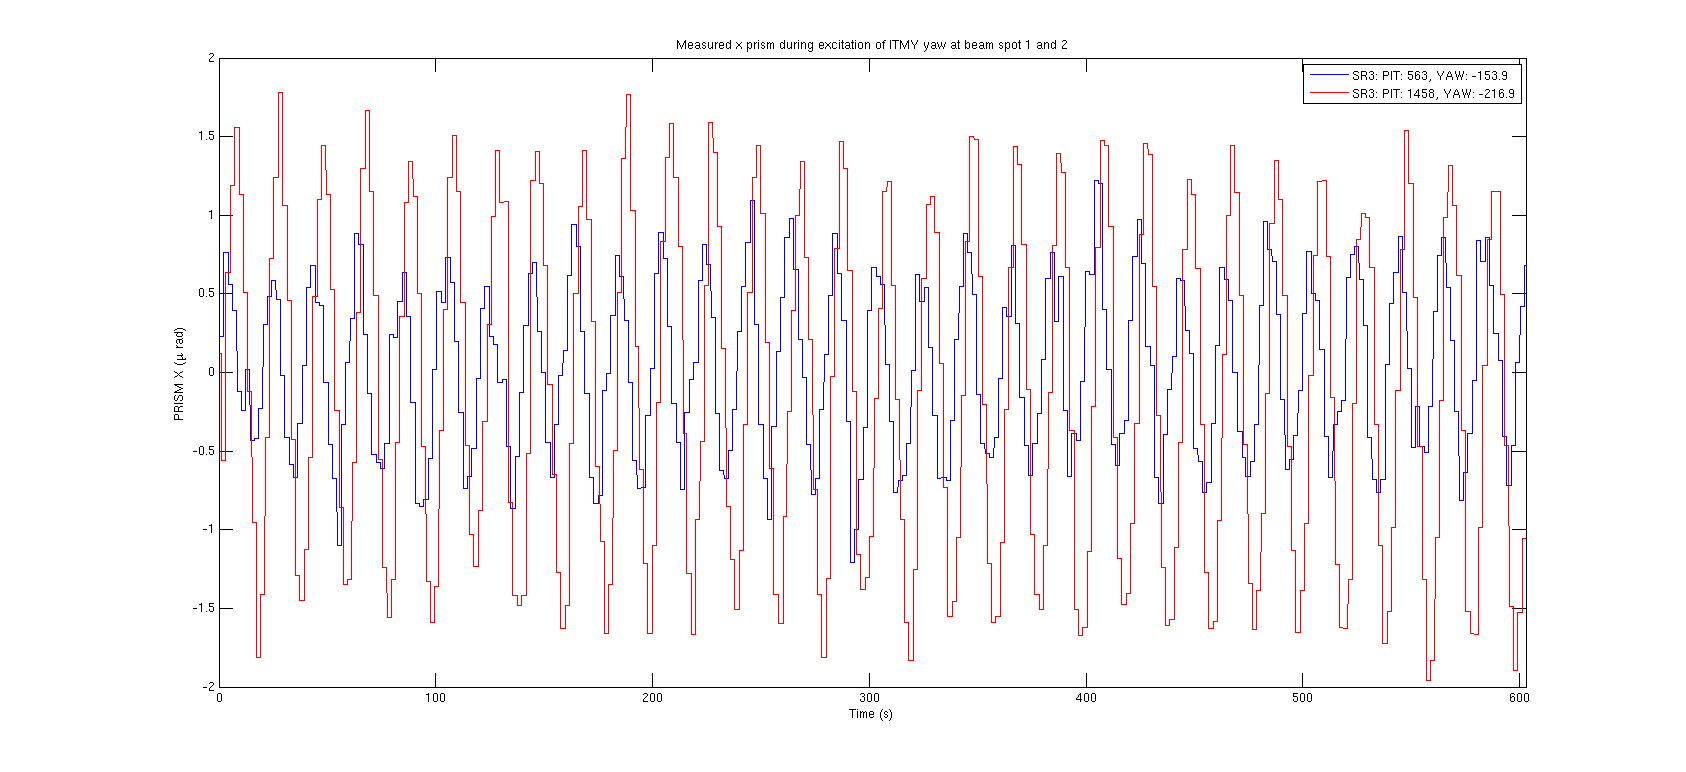
shows the four plots of time series of H1:TCS-ITMY_HWS_PROBE_PRISM_X signal compared to H1:SUS-ITMY_L3_OPLEV_YAW_OUTPUT. From these plots:
Beam spots 3 and 4: definitely do not reflected from any surface of ITMY since there is no evidence of 50 mHz oscilliation. They may come from the CP, which fit with the fact that CP is horizontally wedged. It is also interesting to note that the Prism X values for these two beams decrease contiously during measurement.
Beam spots 1 and 2: these two beams come from the 2 surfaces of ITMY.
The oscillation in X prism measured for beamspot 1 has an amplitude of approximately 0.6±0.2 urad
The oscillation in X prism measured for beamspot 2 has an amplitude of approximately 1.5±0.2 urad
Therefore, the magnitude of oscillation in x prism for beamspot 2 is greater. This can be clearly seen if the two time series are plotted together:

I remember that the clipping we saw was by the first steering mirror in the HAM4 chamber. I could see a bright scattering from the view port with an IR viewer.
We reproduced the clipping today on Mar 9th. We confirmed that the clipping occurred at the first in-vac lens (see HAM4 drawing), not the steering mirrors.