It turned out that all my previous analysis did not correct for the time-varying optical gain when calibrating the cross spectra into displacement even though I thought I have done it. I have recalibrated all the O1 data with the optical gain properly corrected.
Fortunately, the conclusions I have arrived so far qualitatively did not change.
Here are some plots with the newly calibrated cross spectra, mainly to show there is no drastic changes.
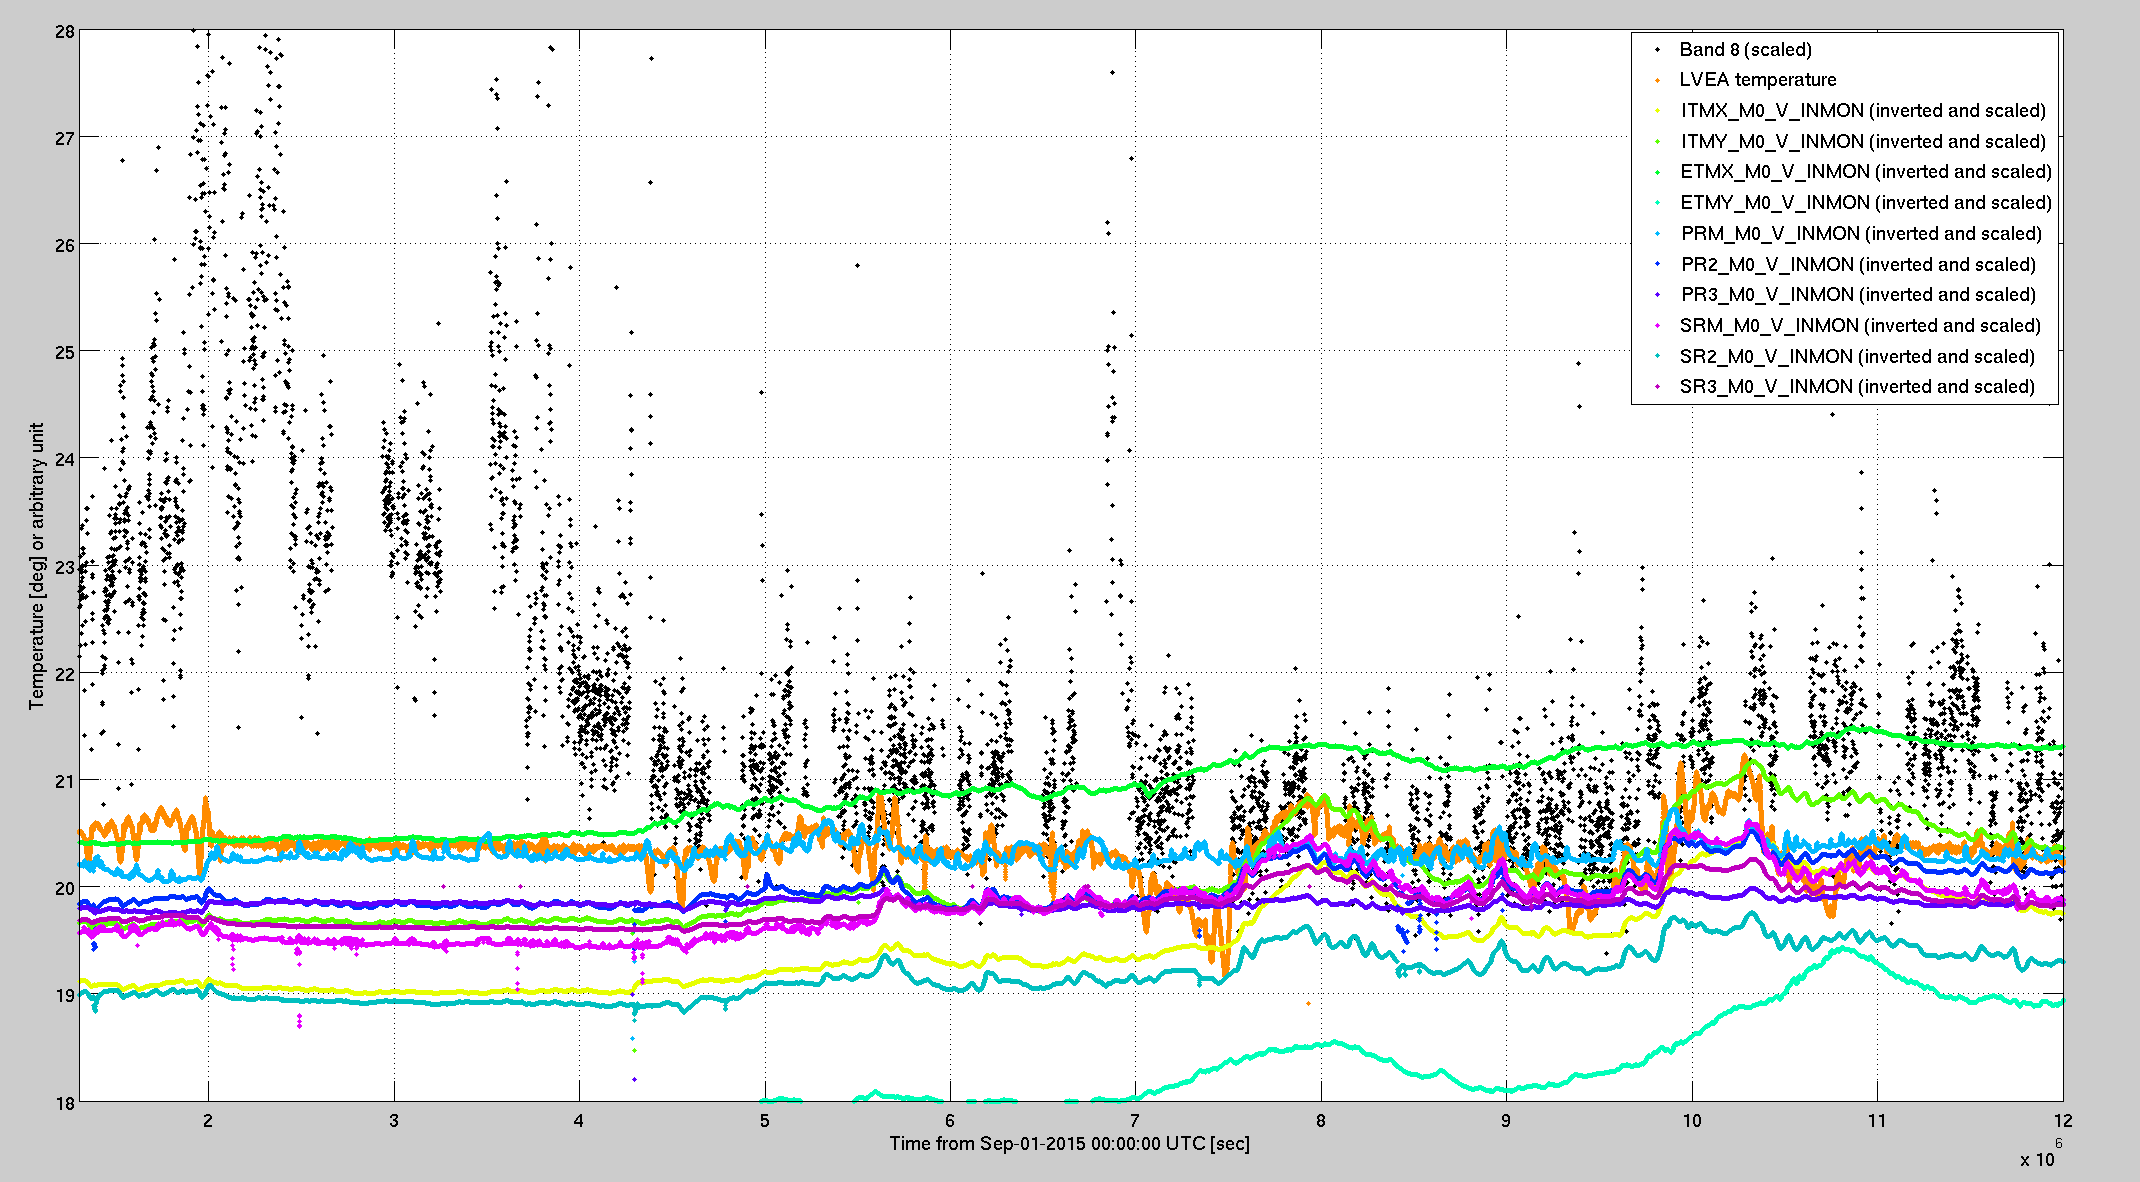
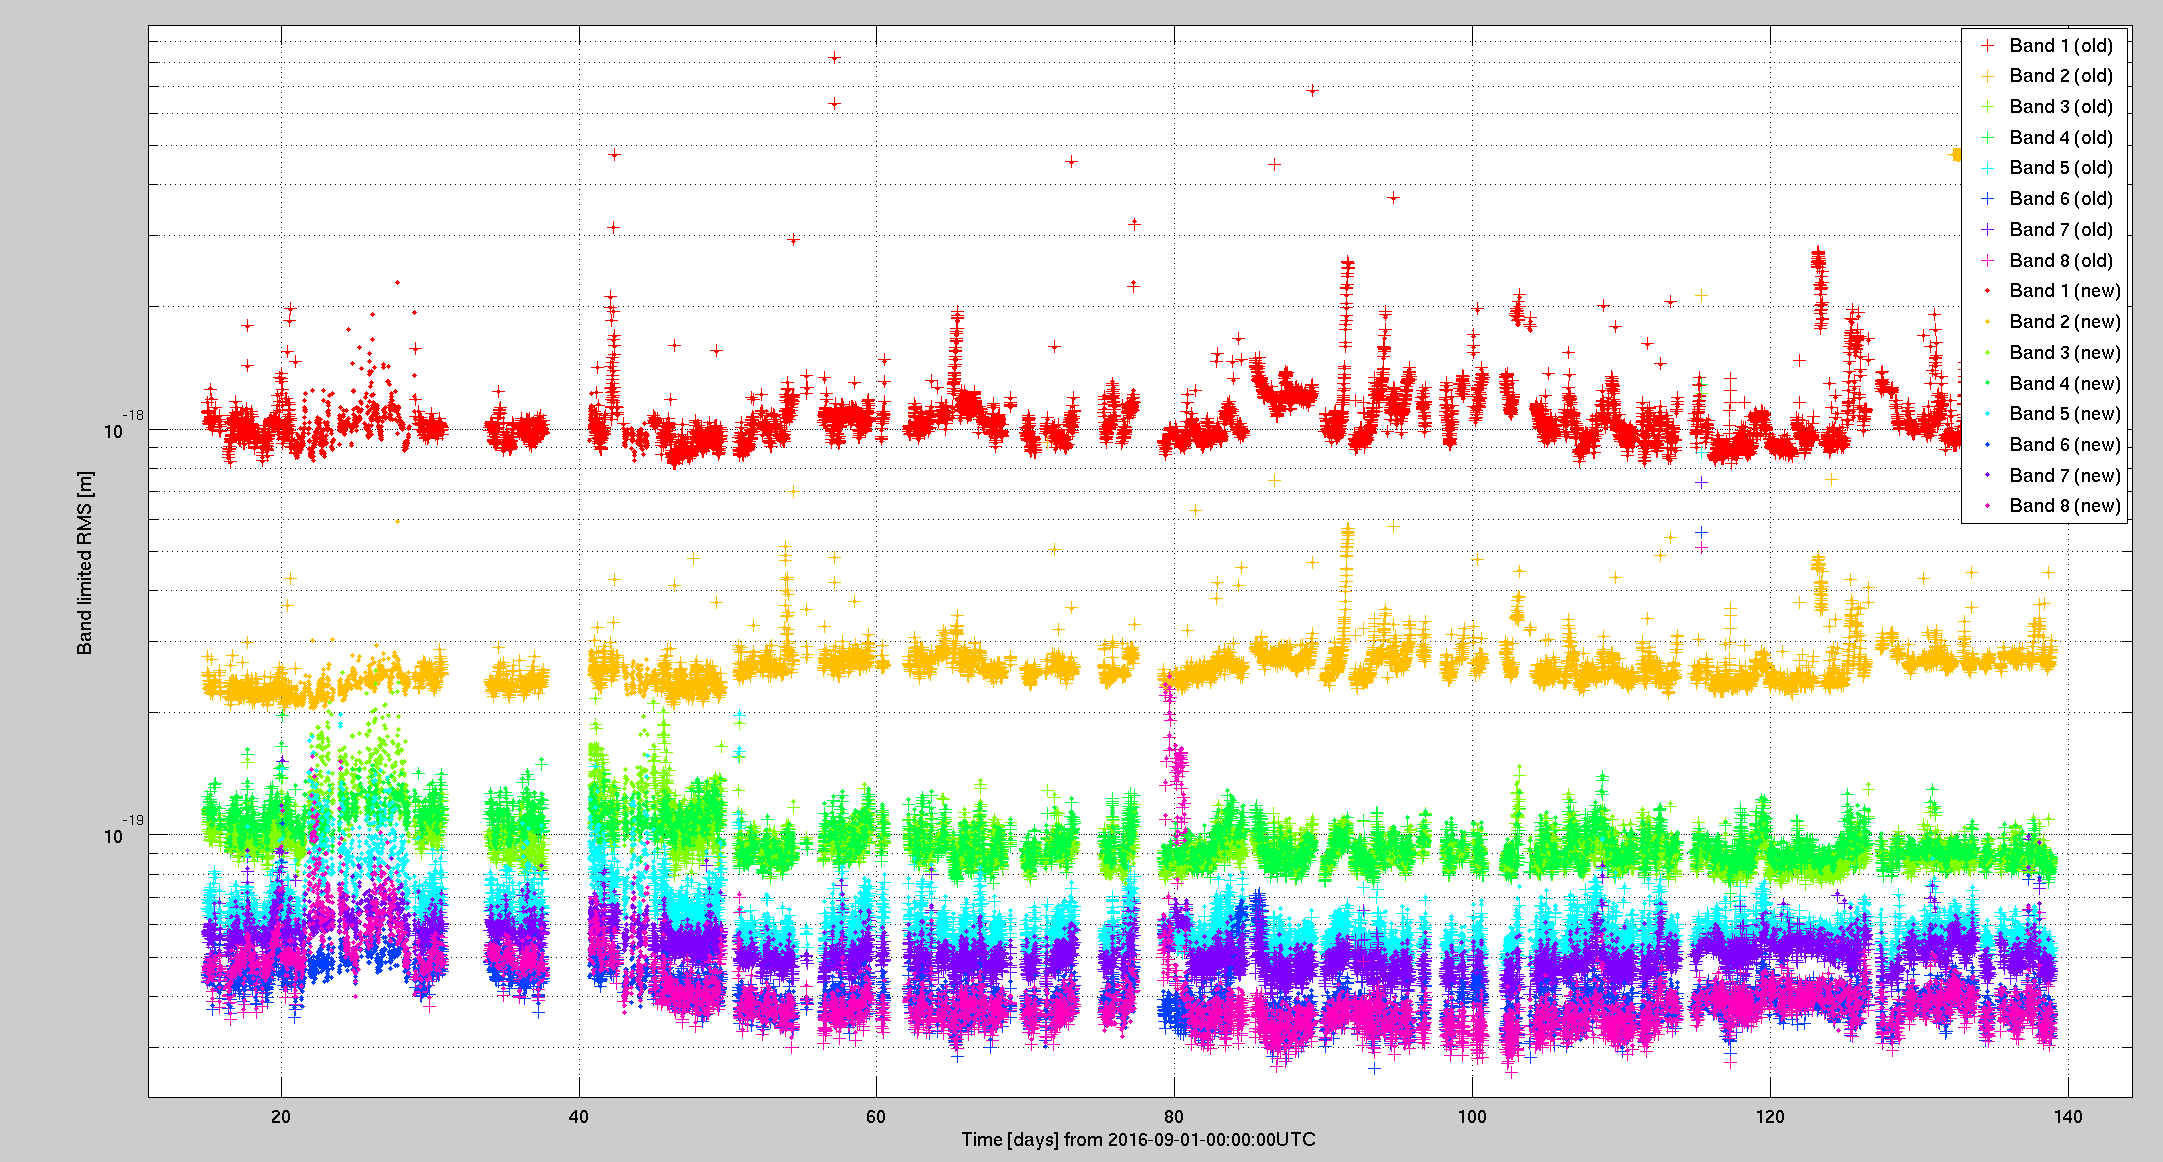
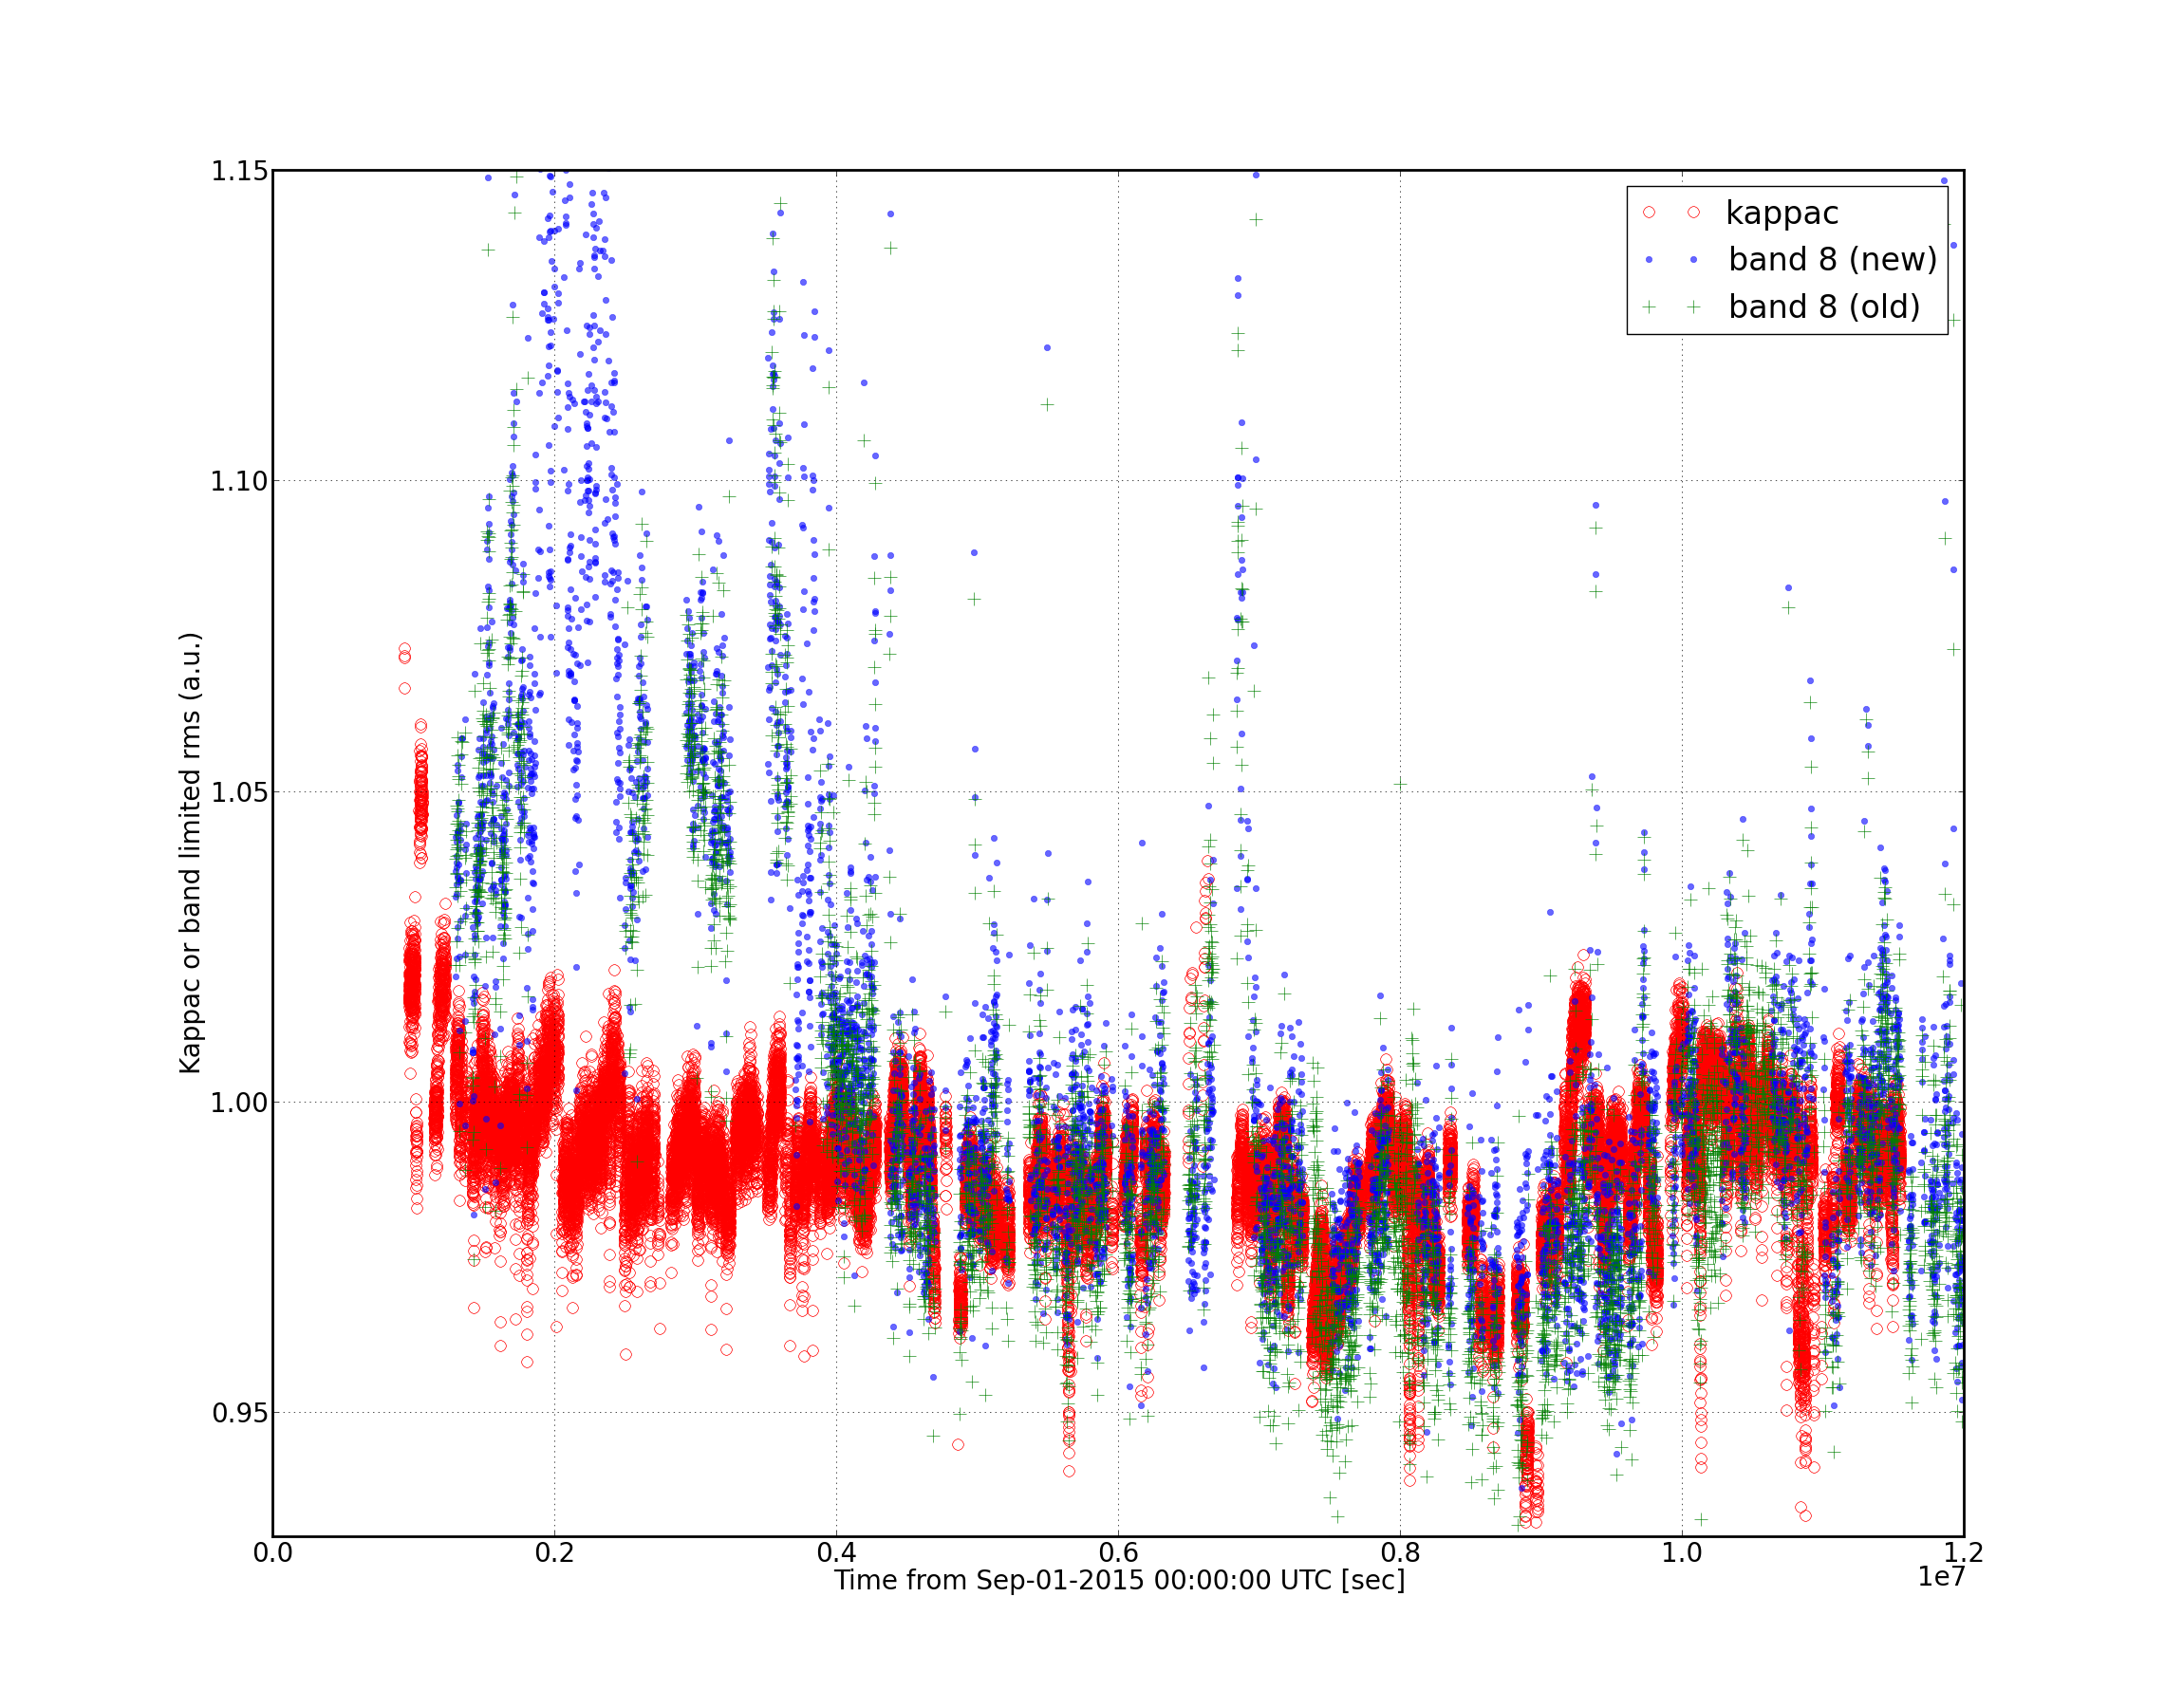
Fig.1 Band limited rms of the cross spectra in time series for the entireO1 run. The old data (without the optical gain correction) are show as "+" symbols while the recalibrated data are shown as dots.
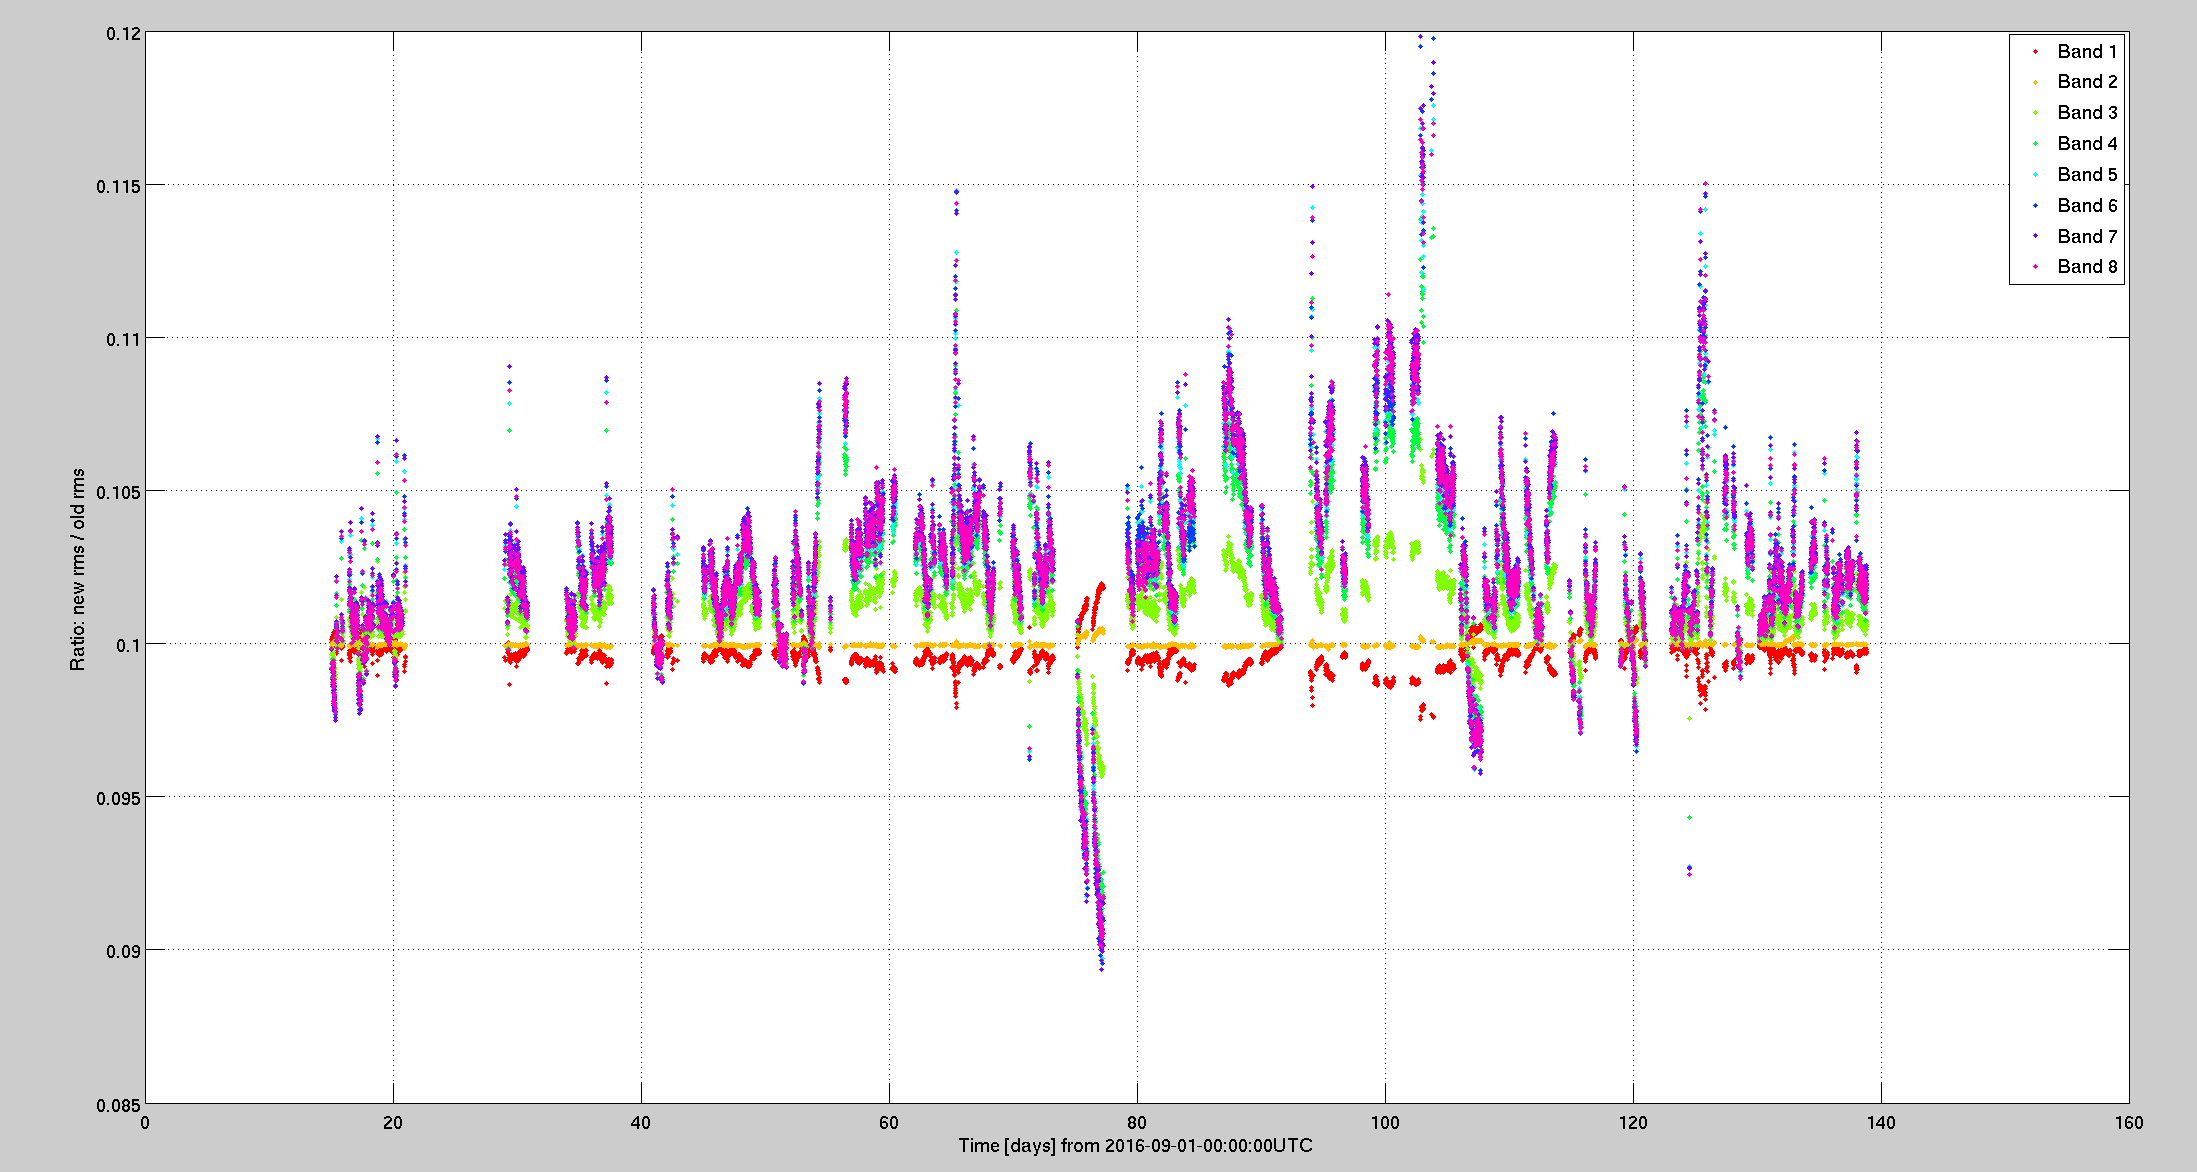
Fig.2 Ratio of the band limited rms, (new data) / (old data). Notice that the high frequency bands (bands 3-8) tend to have larger displacement now. The low frequencies do not fluctuate as big as those for high frequencies as expected.
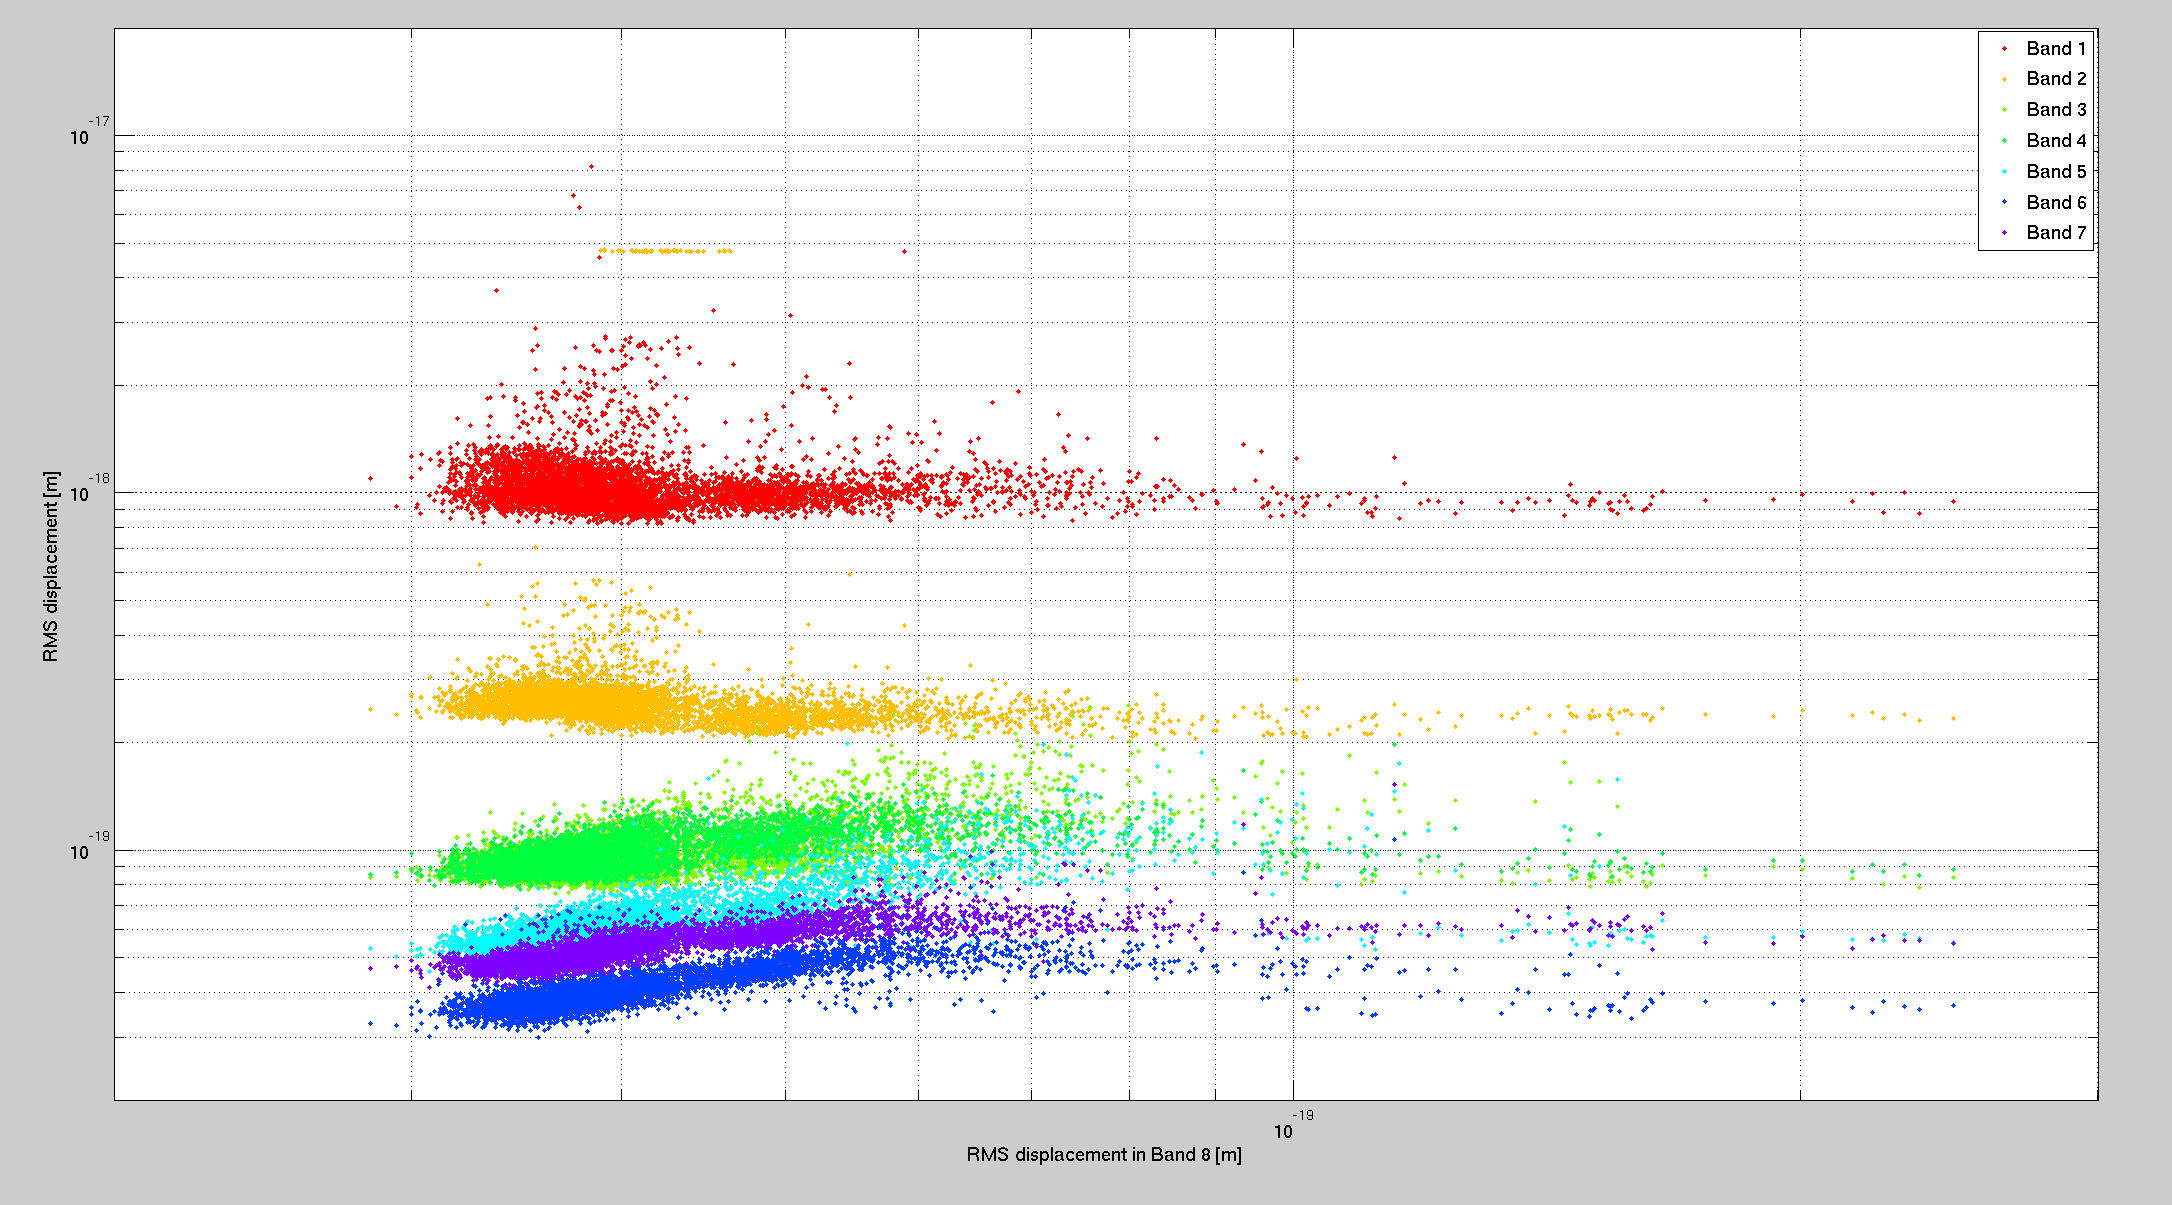
Fig.3 A naive correlation diagram in which the linear dependency between high frequency bands (bands 5-8) is still visible.
Fig.4 Time series plot of scaled band 8 BLRMS, LVEA temperature and scaled vertical sensors of various suspended optics.
A report on correlation with the optical gain.
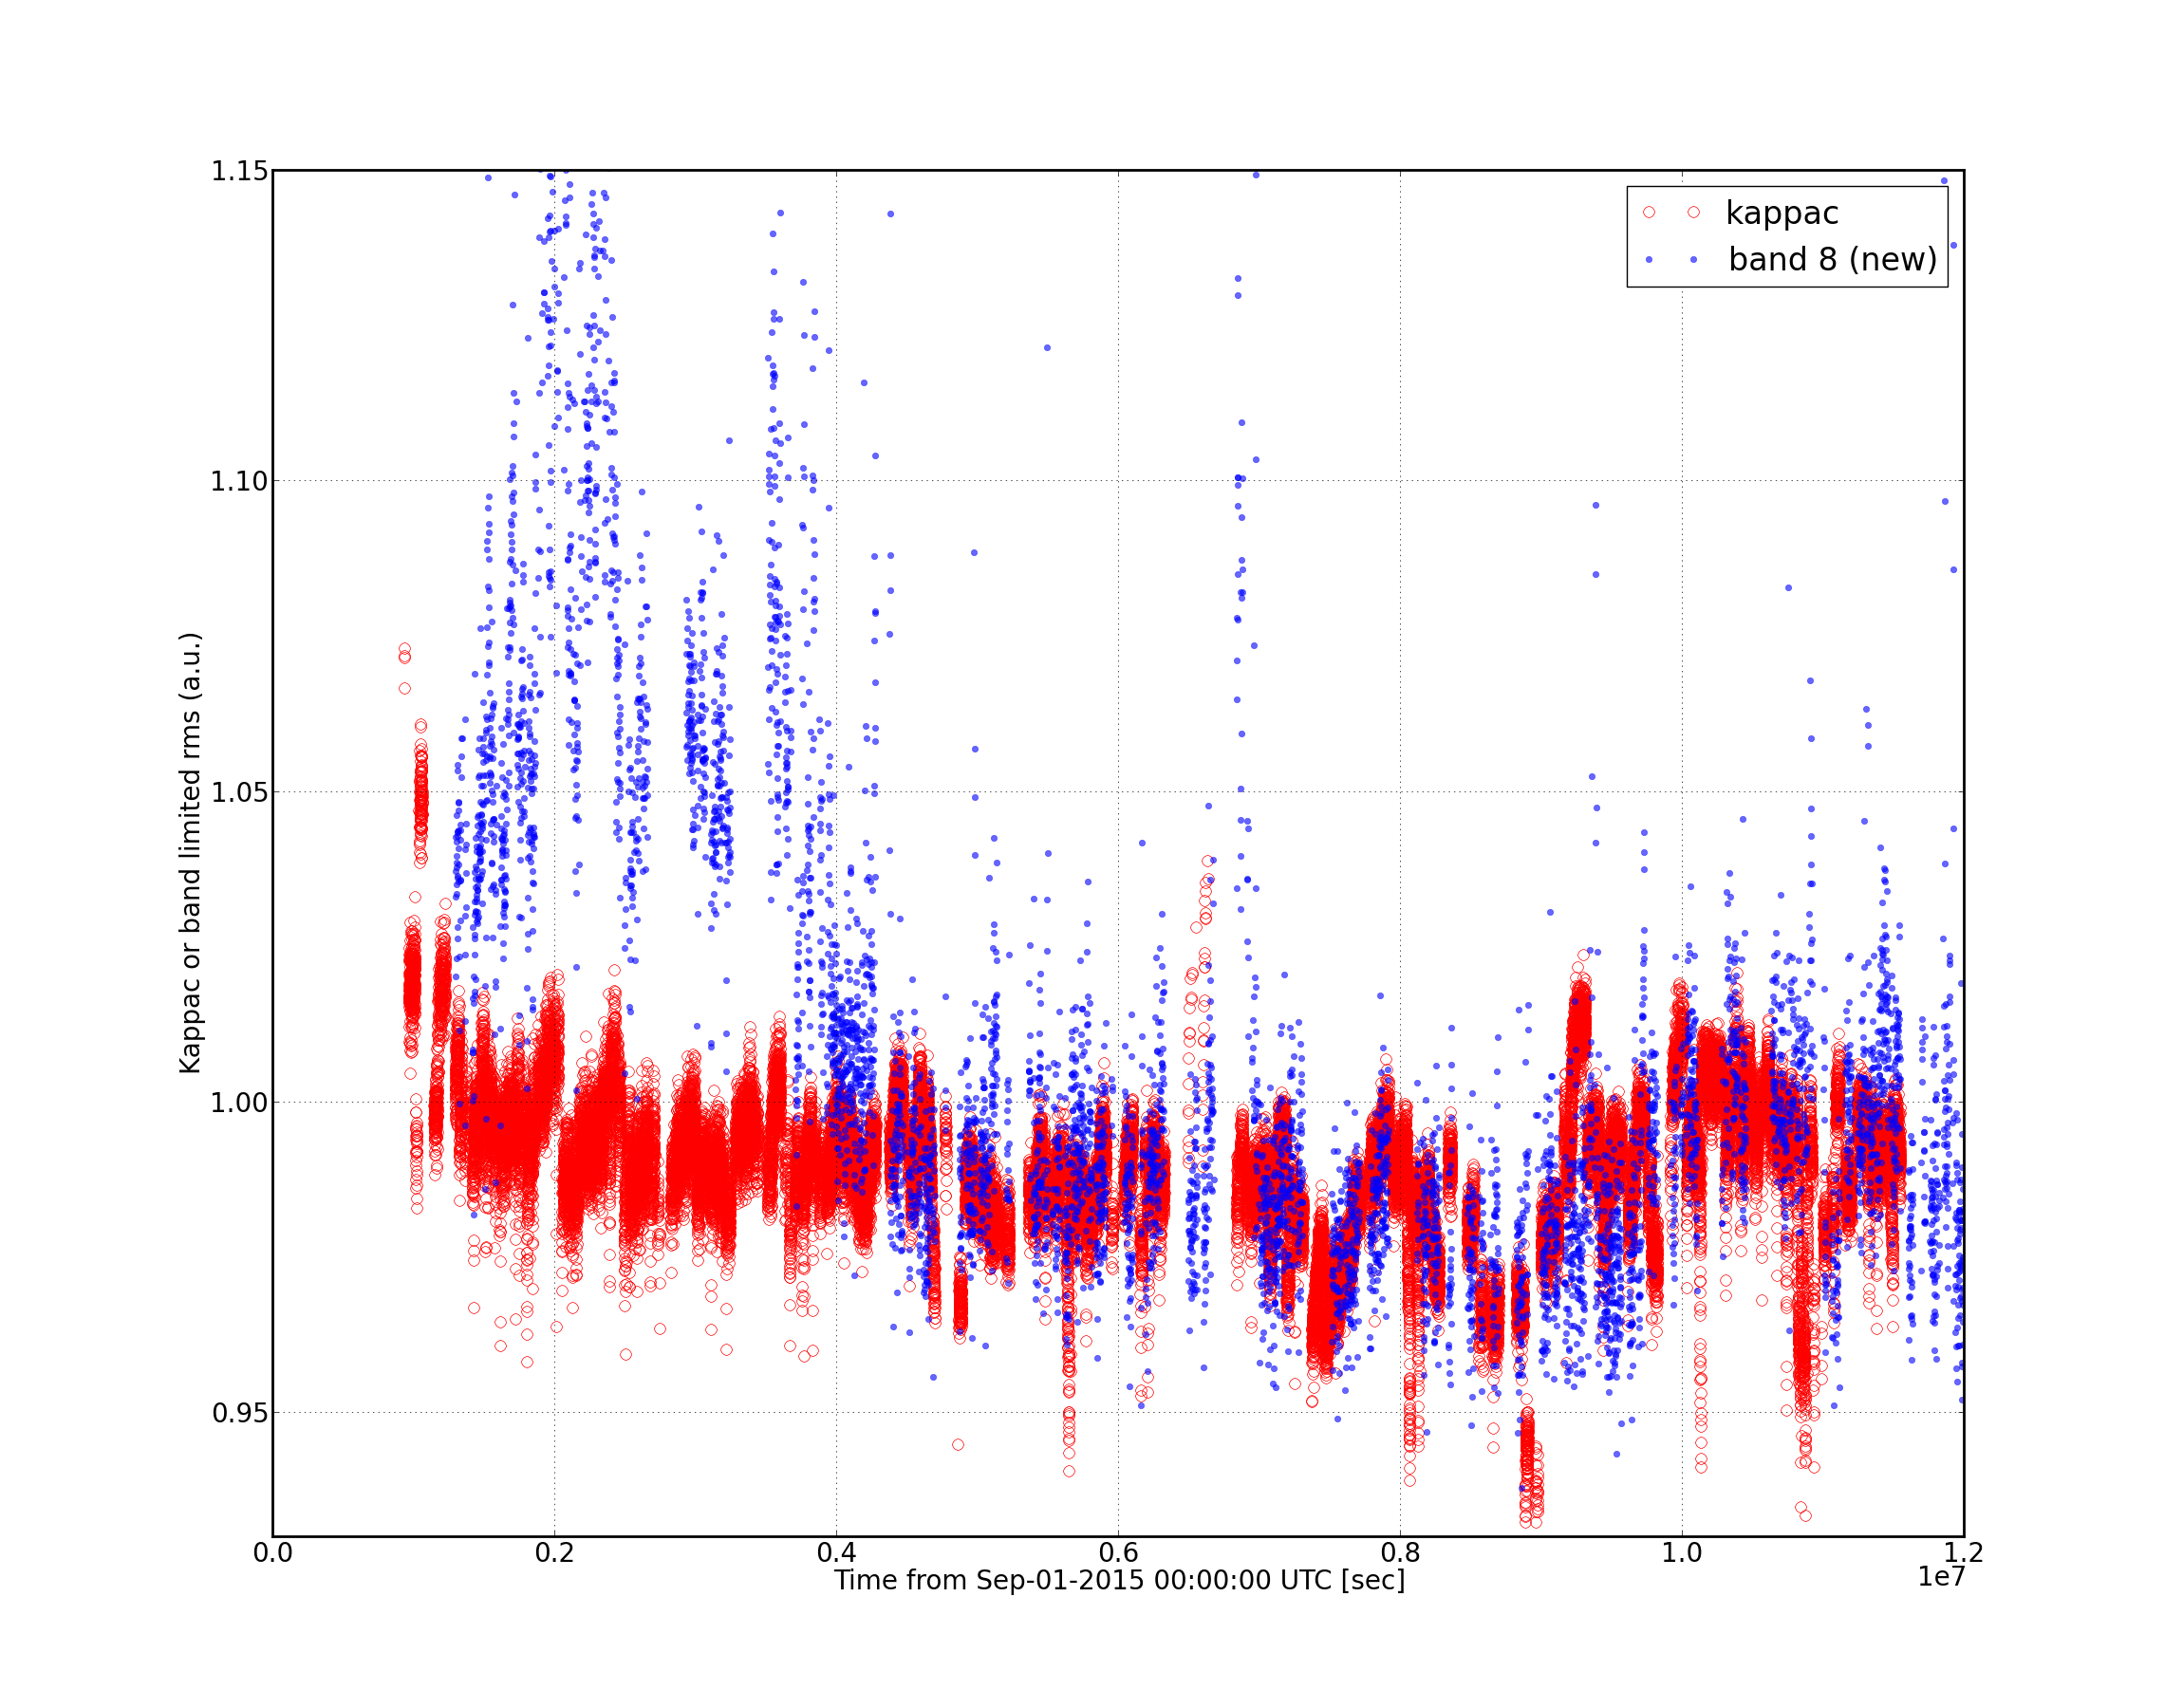
It seems that the overall behavior of the optical gain shows correlation with the band limited rms. Is this calibration artefacts or something real ??
Darkhan provided me with kappa_c which was averaged over every 128 sec. In order for us to become less sensitive to glitches or some discontinuity in the Pcal line, we used kappa_c from the C02 frame that are smoothed by a median filter. In the second figure, I overlaid the old rms data which I did not correct for kappa_c by accident (as described in the above entry). Both corrected and uncorrected rms show somewhat good correlation with the rms.

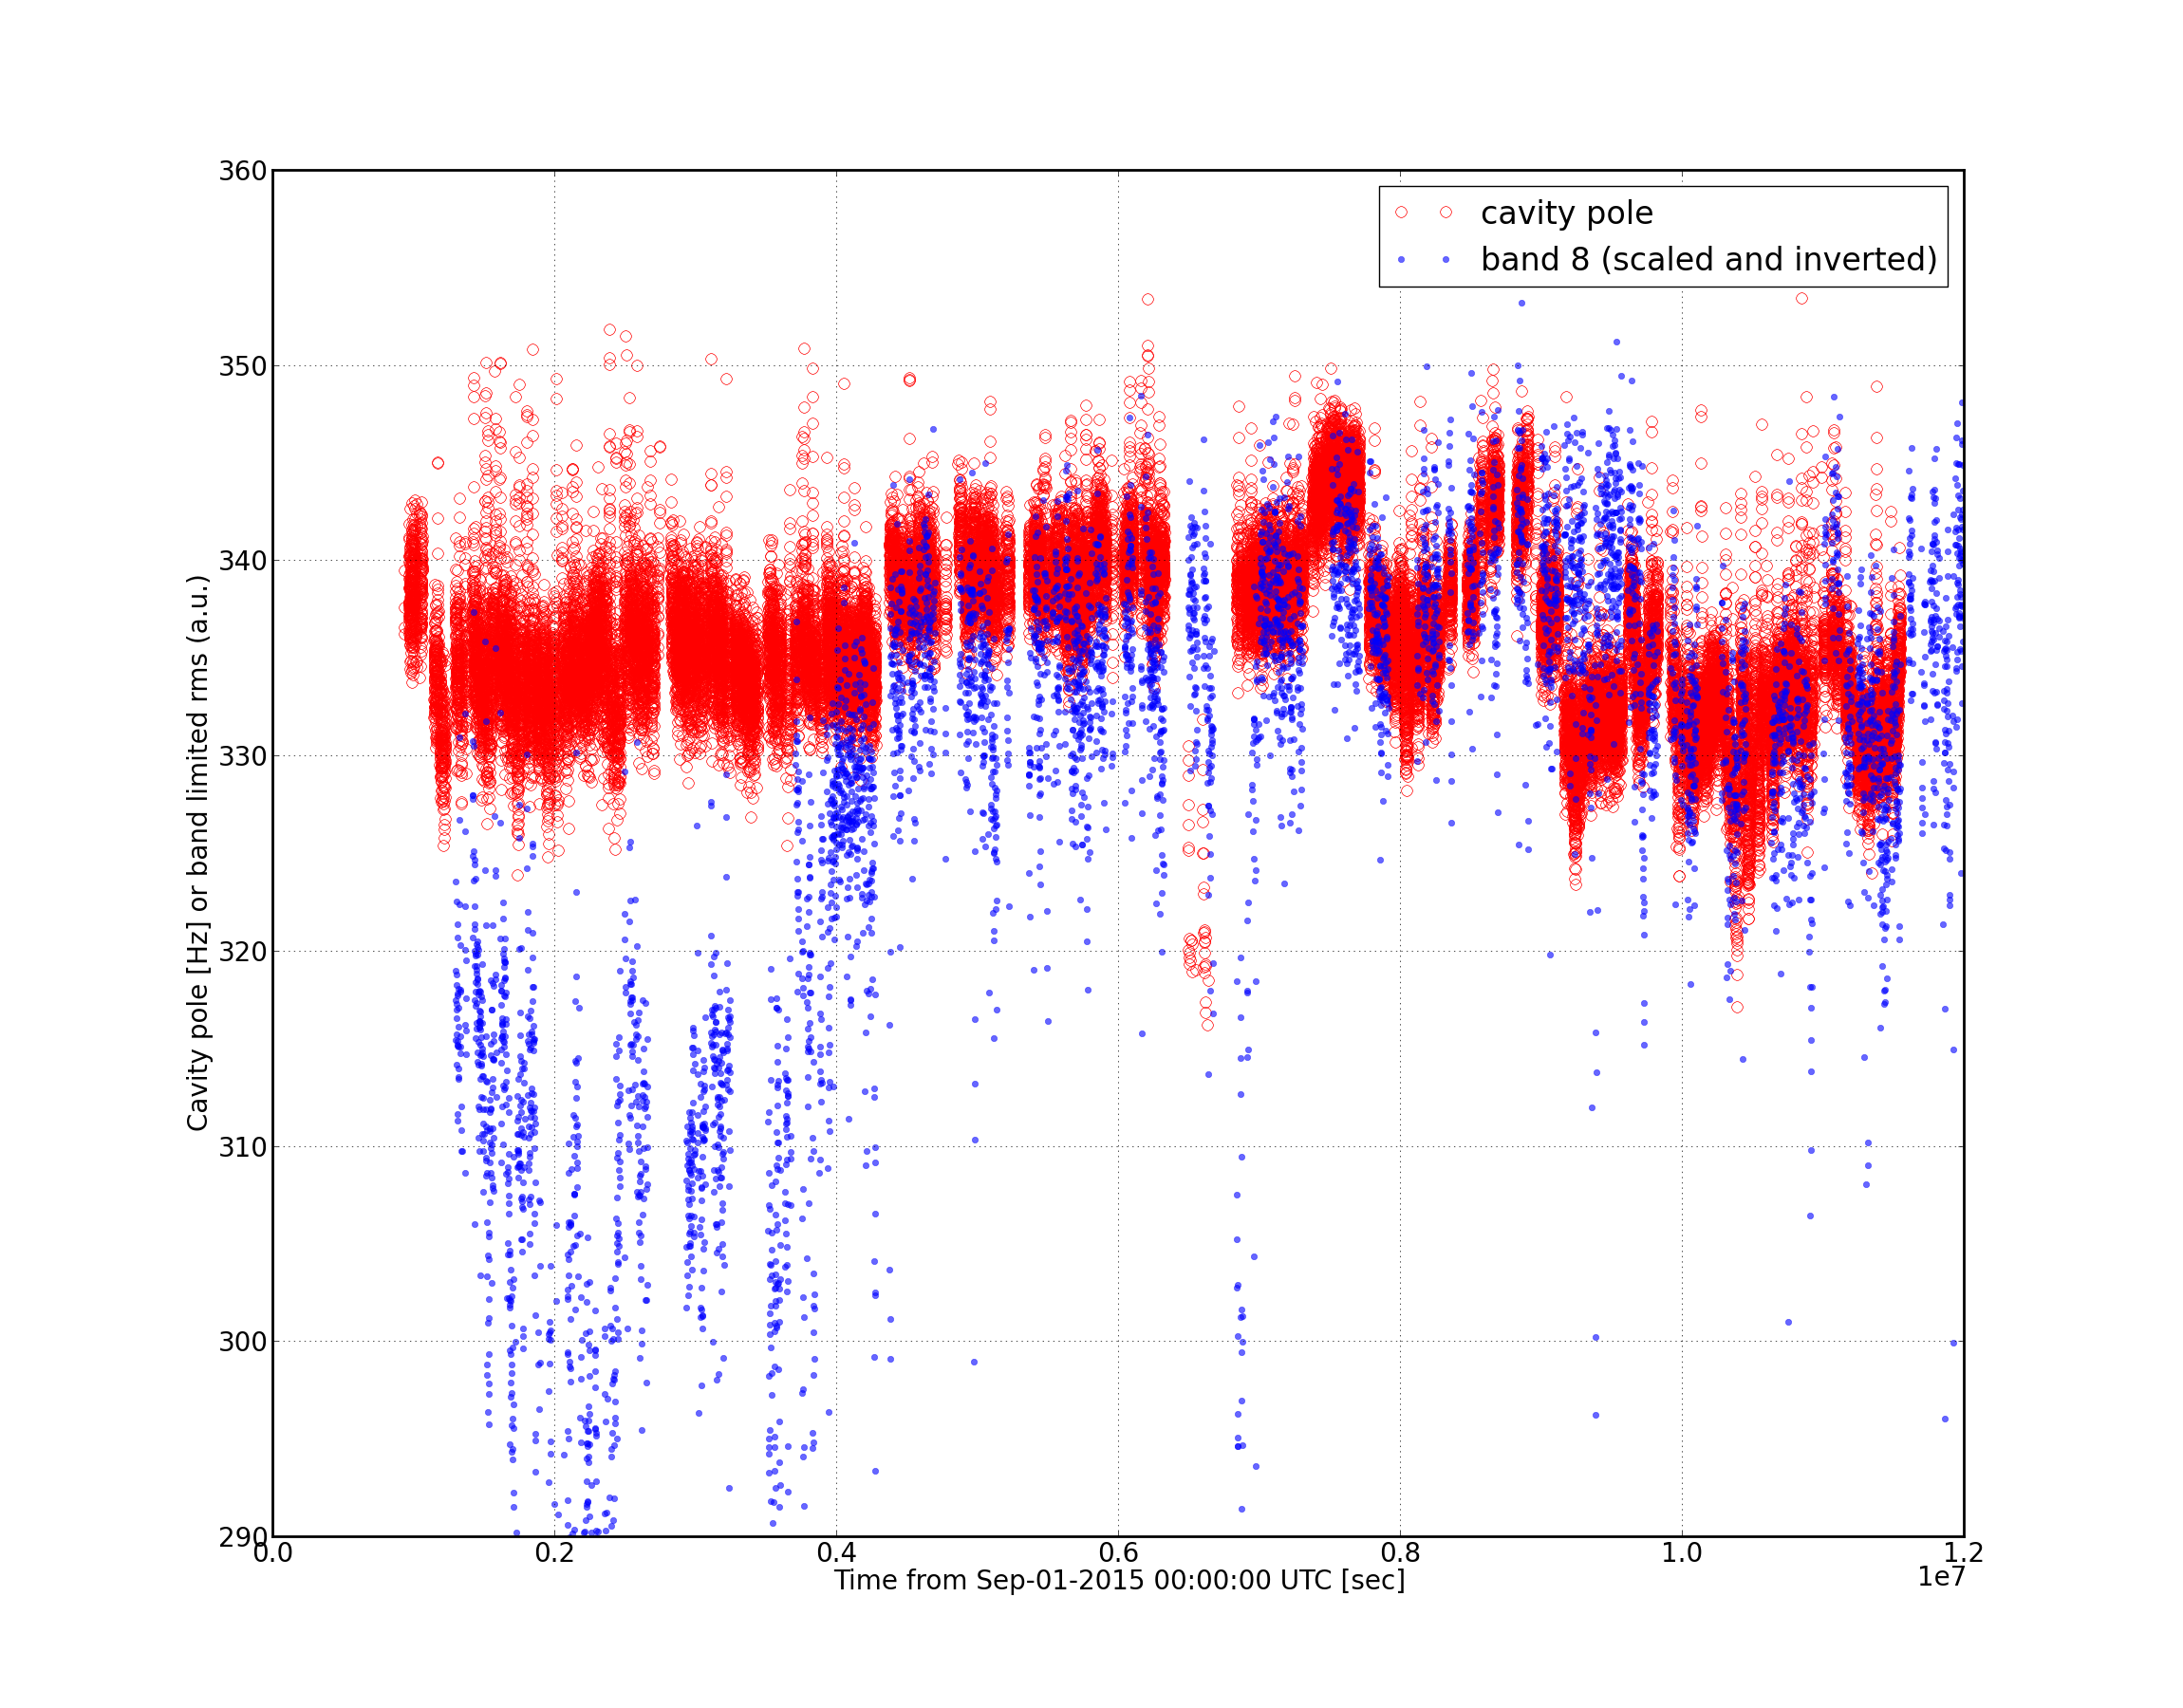
The same analysis for the DARM cavity pole. Maybe correlated as well ?
The attached is the DARM model that I have used for calibrating the cross spectra. OLGTF = sensing * (atst + apum ) * userd.
