Kiwamu, Stefan
Looking at the cross-power plot in alog 25768, we see a coherent noise floor following the shot noise a factor 3.3 below.
Looking at alog 21167, this seems cosistent with our old firend the excess 45.5 MHz noise in DARM.
Shot noise of 20mA: 8e-8mA/rtHz: a factor of 3.3 below that: 2.4e-8mA/rtHz. This is roughly consistent with the residual coherence seen in alog 21167.
Kiwamu will make an all-O1 plot to nicely resolve that noise. We need to add this noise to the mystery noise projection in alog 25106 (this plot).
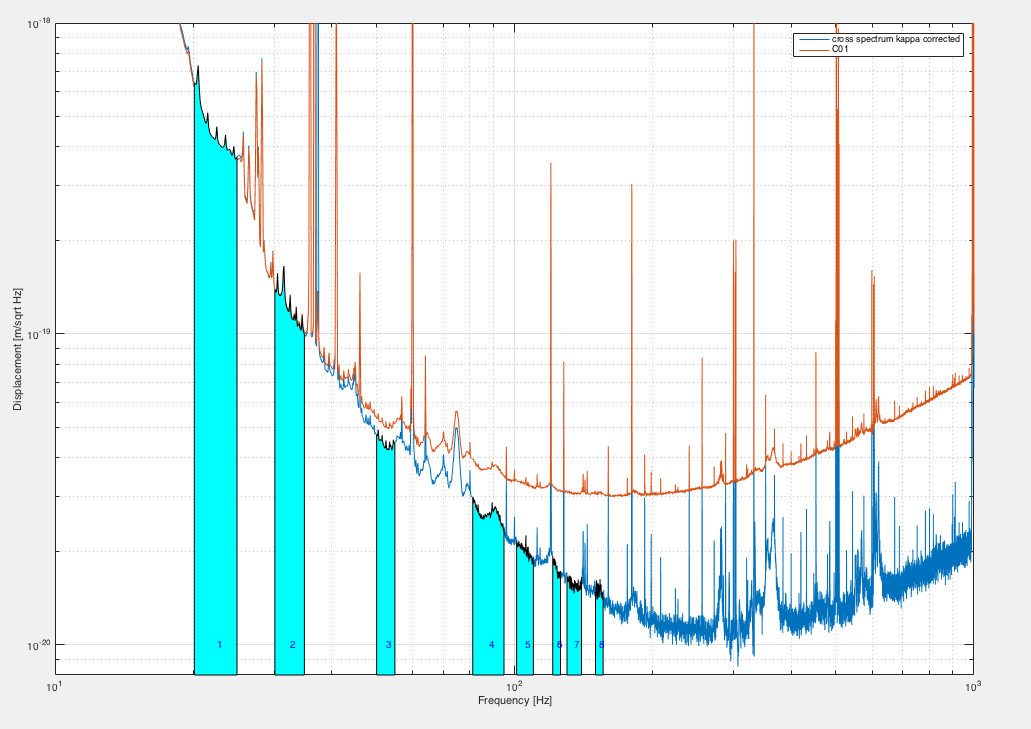
Here is a cross-spectrum with more number of averaging (over 867 hours using the data between Oct-21-2015 to Jan-17-2016 with some glitchy durations excluded).
I looked at some few-hour stretches of O1 data and took the coherence between the DCPDs.
Above 1 kHz (where the DARM OLTF is −55 dB or less), the coherence goes as low as 1×10⁻⁴. See attachment for an example; FFT BW is 2 Hz and number of averages is >50,000. That would imply a correlated DCPD sum noise that is a factor of 7 below the shot noise [since the correlated noise ASD in each PD should be (1×10⁻⁴)1/4 = 0.1 relative to the uncorrelated (shot) noise ASD].
I suppose it is possible that the secular fluctuations in the nonlinear 45 MHz noise are enough to push the overall O1 coherence up to 2×10⁻³, which is what is required to achieve a correlated noise that is a factor of 3.3 below the shot noise in the DCPD sum.
To test this, I propose we look at the variation over O1 of some kind of BLRMS of the 45 MHz EOM driver control signal (or perhaps just the dc level of the control signal), similar to what Kiwamu has already done for some of the suspension channels.
During this same time period, the excess of sum over null above 1 kHz is about 0.1×10⁻⁸ mA/Hz1/2. Assuming 8×10⁻⁸ mA/Hz1/2 of null current therefore implies the correlated excess is a factor of 6 to 7 below shot noise.
(The slope in the data is probably from the uncompensated AA filtering).
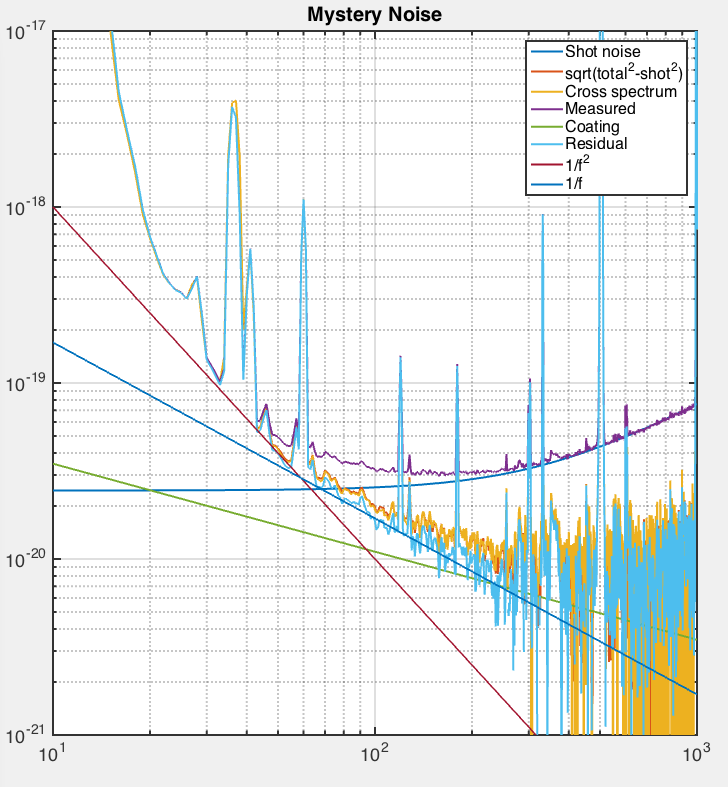
The second attachment shows the conversion of the sum and null into equivalent freerunning DARM. From the residual alone, the limit on the coating Brownian noise seems to be a factor of 1.6 above nominal. (I quickly threw in a 5 kHz zero when undoing the loop in order to compensate for the AA filtering).
Finally, I add some mystery noise traces to this residual, where the slopes and amplitudes have been arrived at by careful numerology. The addition of a 1/f2 noise and a mystery white sensing noise (similar to 26004, but tuned to the residual during this time period) reduces the possible coating Brownian excess factor to 1.45 or so.
Here is an updated version of the cross spectrum using the O1 data. I have fixed a bug which previously overestimated the cross specctrum and have extended the analysis to high frequencies above 1 kHz.
As pointed out by Evan, my previous analysis overestimated the correlated noise. This turned out to be due to a bug in my code where I summed the absolute value of the segmented cross spcetra when averaging them. This is apparently wrong because the cross spectra by nature can have negative value (and imaginary number). I fixed the analysis code and reran the analysis again. The result looks consistent with Evan's targeted cross spectrum -- the kink point of the cross correlation happenes at around 1 kHz with the noise floor touching 1e-20 m/sqrtHz.