Related to alogs 25918, 25975, 25768
I have confirmed that the calibration of my cross spectra is accurate and deviation is as small as 1% at 36 Hz and smaller at higher frequencies.
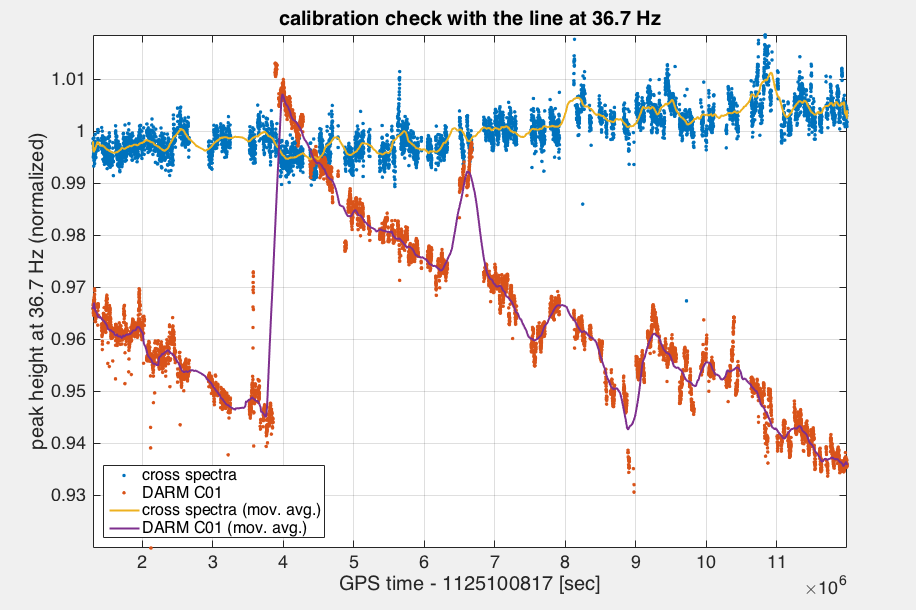
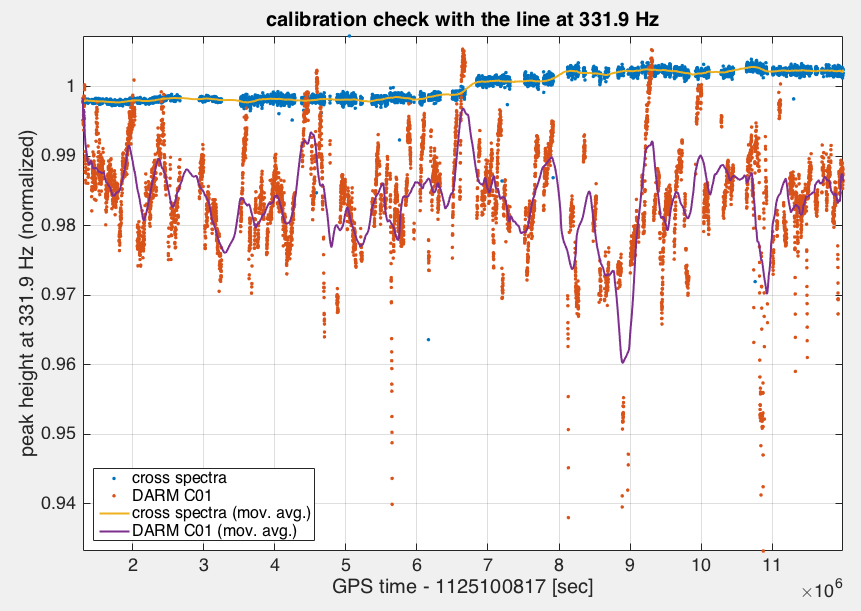
The plots above show the time evolution of the peak height at 36.7 and 331.9 Hz. Because they are driven by Pcal, they should stay unchanged throughout the run if the calibration has been properly done. The line at 36.7 Hz showed a good stable calibration most of the time and had a upward trend. Overall, I would say it is as good as 1%. For comparison, I plot the peak height from the C01 frame. As expected the line height changed by ~ 7% which is presumably due to the test mass charge.
The other line at 331.9 Hz showed a very good stability throughout the run. The deviation is much smaller than 1% as seen in the plot. In contrast, the C01 data showed more active variation throughout the run by roughly 6% peak-to-peak.