keith.riles@LIGO.ORG - posted 13:07, Monday 28 March 2016 (26177)
More data-folding studies - CS magnetometer channels
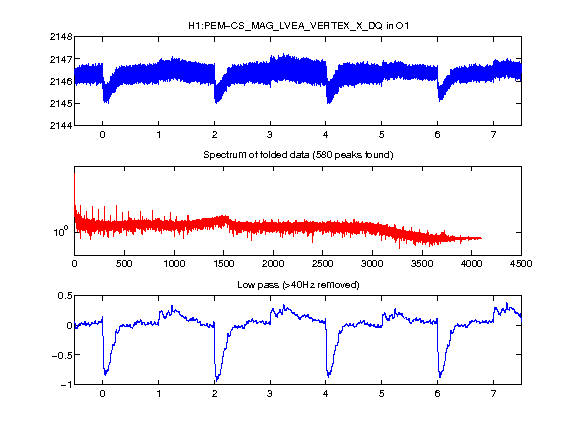
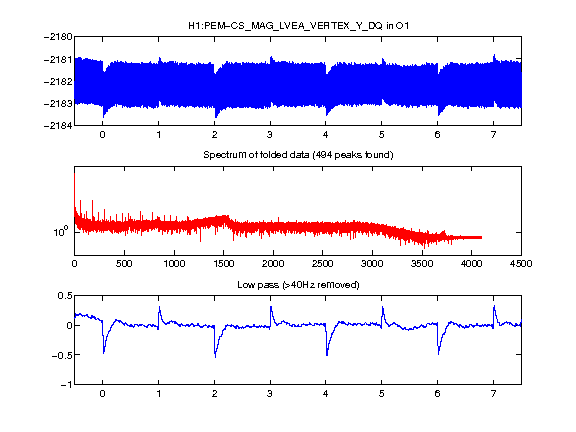
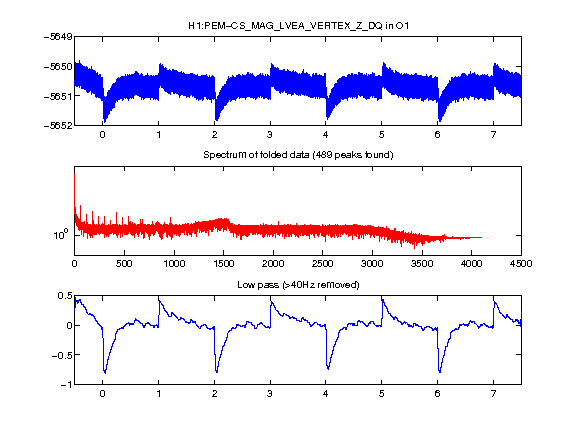
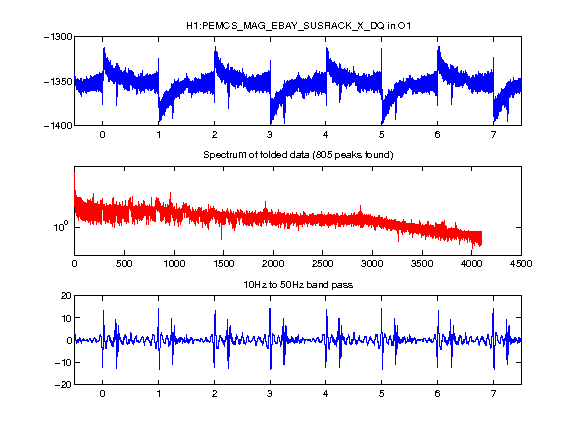
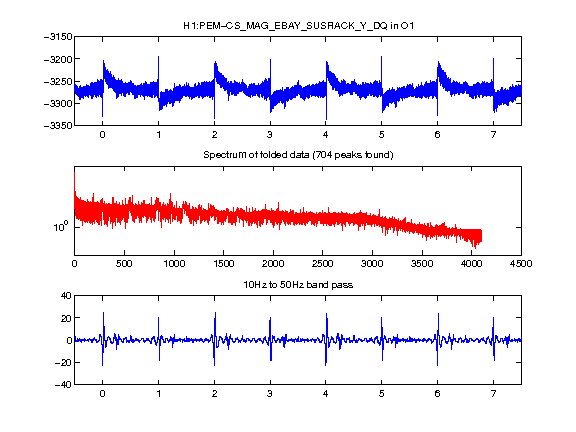
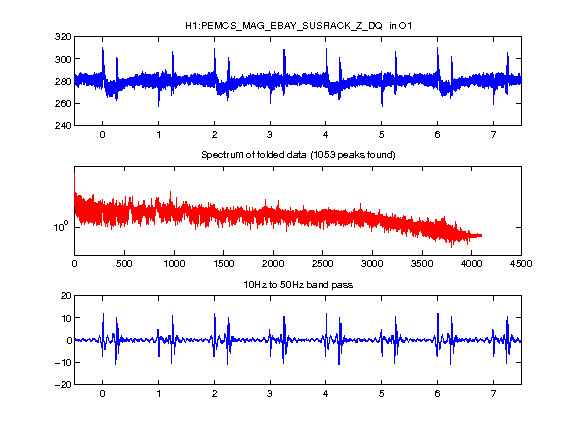
Following up on this earlier study, Weigang Liu has tried folding some of the
corner-station magnetometer data in 8-second intervals, day-by-day, month-by-month and over nearly the full O1 run
(excluding January because of commissioning work and October 20 for some channels because of anomalous data).

Attached are the summary plots, while links to the daily & monthly plots are here:

H1:PEM-CS_MAG_LVEA_VERTEX_X_DQ
H1:PEM-CS_MAG_LVEA_VERTEX_Y_DQ
H1:PEM-CS_MAG_LVEA_VERTEX_Z_DQ
H1:PEM-CS_MAG_EBAY_SUSRACK_X_DQ
H1:PEM-CS_MAG_EBAY_SUSRACK_Y_DQ
H1:PEM-CS_MAG_EBAY_SUSRACK_Z_DQ

As before, each figure has a top graph with the raw folded (averaged) data,
a middle graph with the spectrum of the folded data, and a bottom graph
which is the inverse FFT of the lowest 40 Hz.

Remarks:
- These graphs are qualitatively similar to those seen before for some EY magnetometer channels in that there is a 2-second periodicity with a positive excursion at a 1-second boundary, followed by a negative excursion at the next 1-second boundary.
- There is additional fine structure more visible in these channels, most notably an extra transient seen at the 0.25-second mark in successive 1-second intervals of the CS_MAG_EBAY_SUSRACK_(X/Y/Z) channels. The fine structure is seen throughout O1.
Images attached to this report