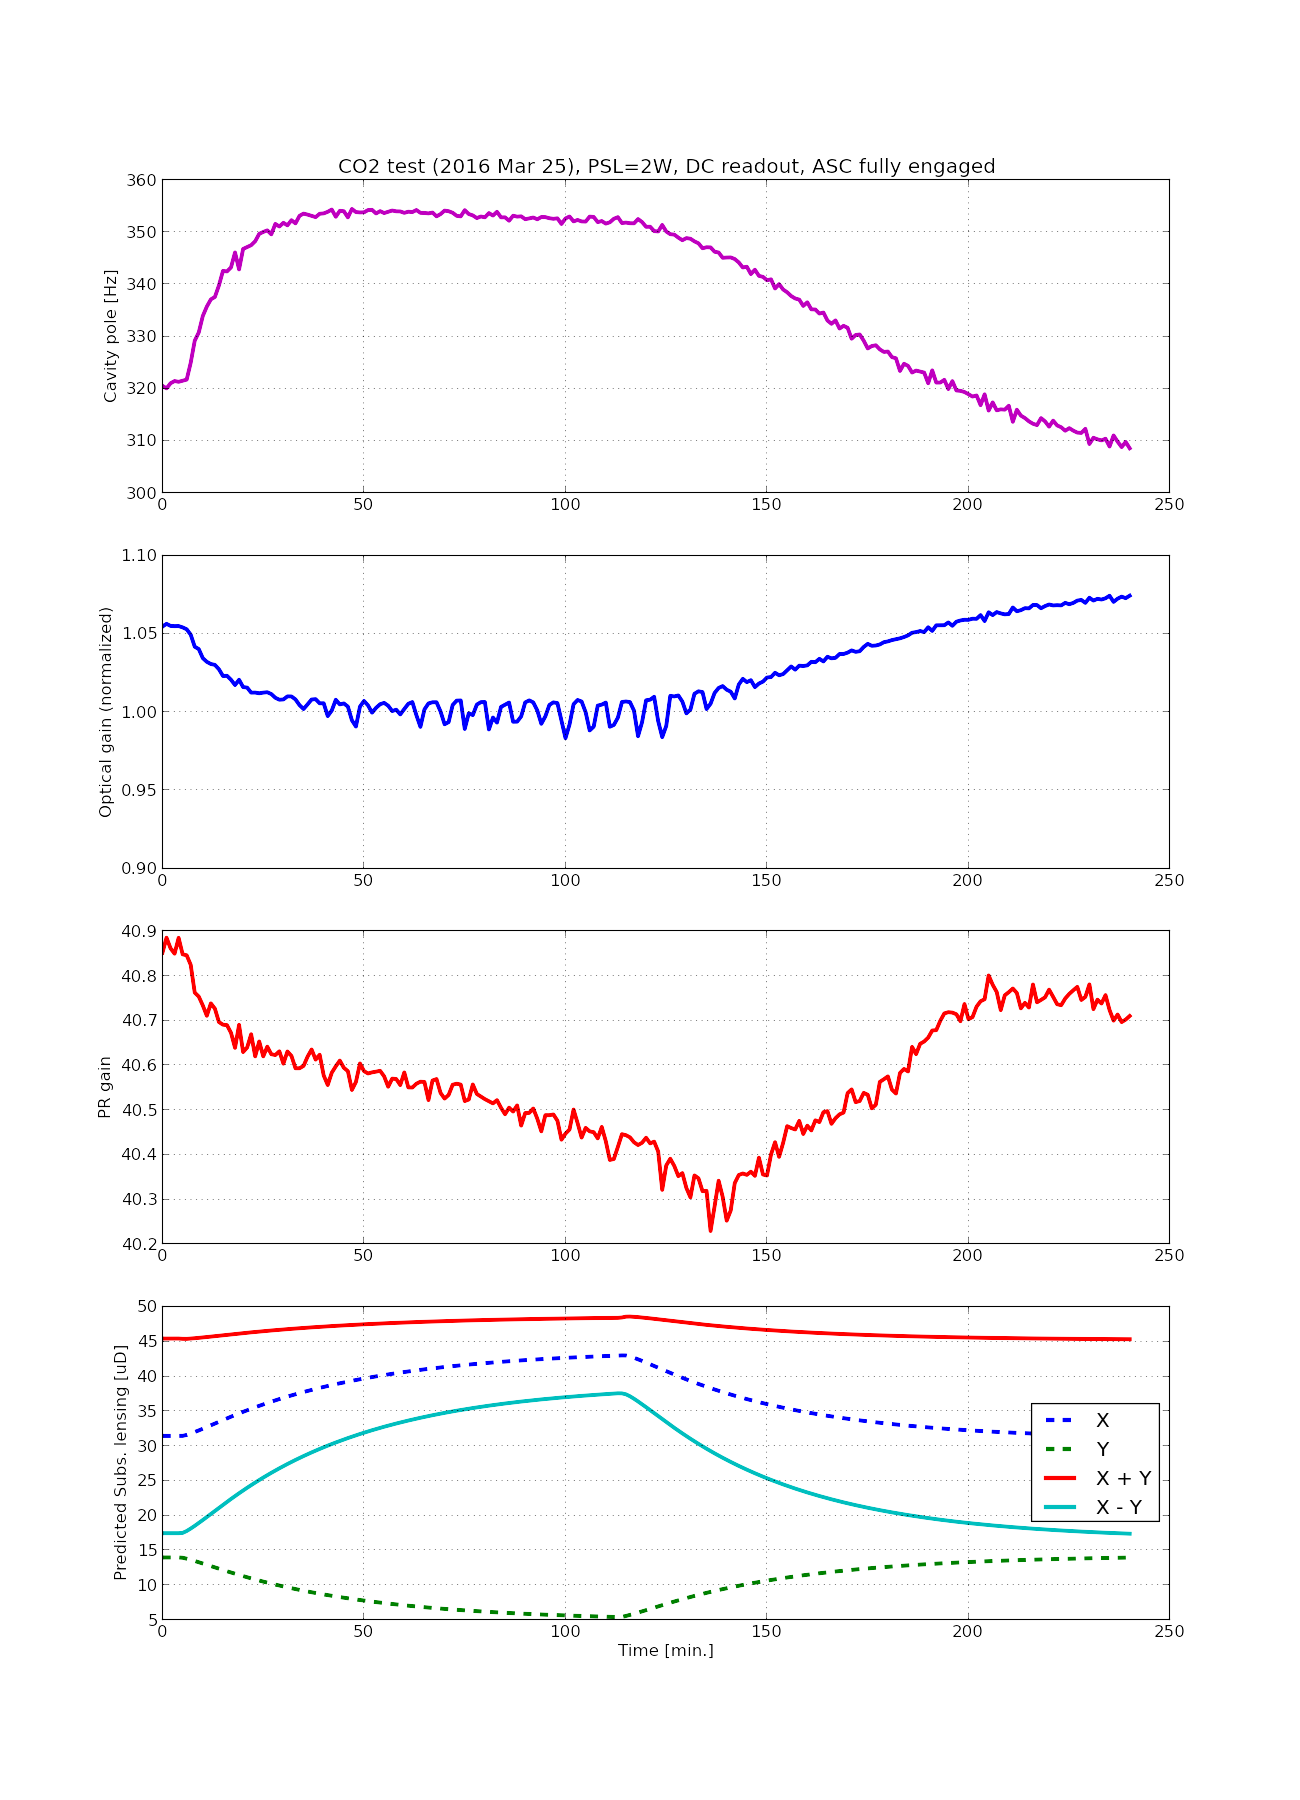
This is a quick summary of today's TCS joy. I ran another differential lensing test today. I went to the other side of the differential lensing (CO2X goes higher power).
The highest cavity pole was 352 Hz in this test.
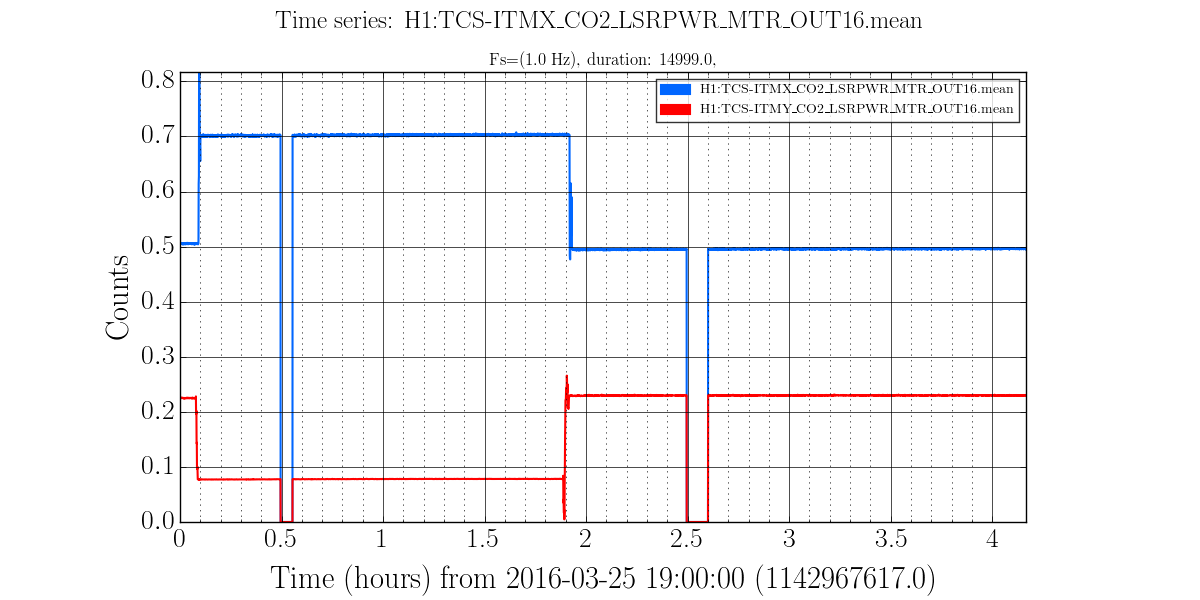
- CO2 X 500 mW --> 700 mW --> 500 mW
- CO2 Y 230 mW --> 80 mW --> 230 mW
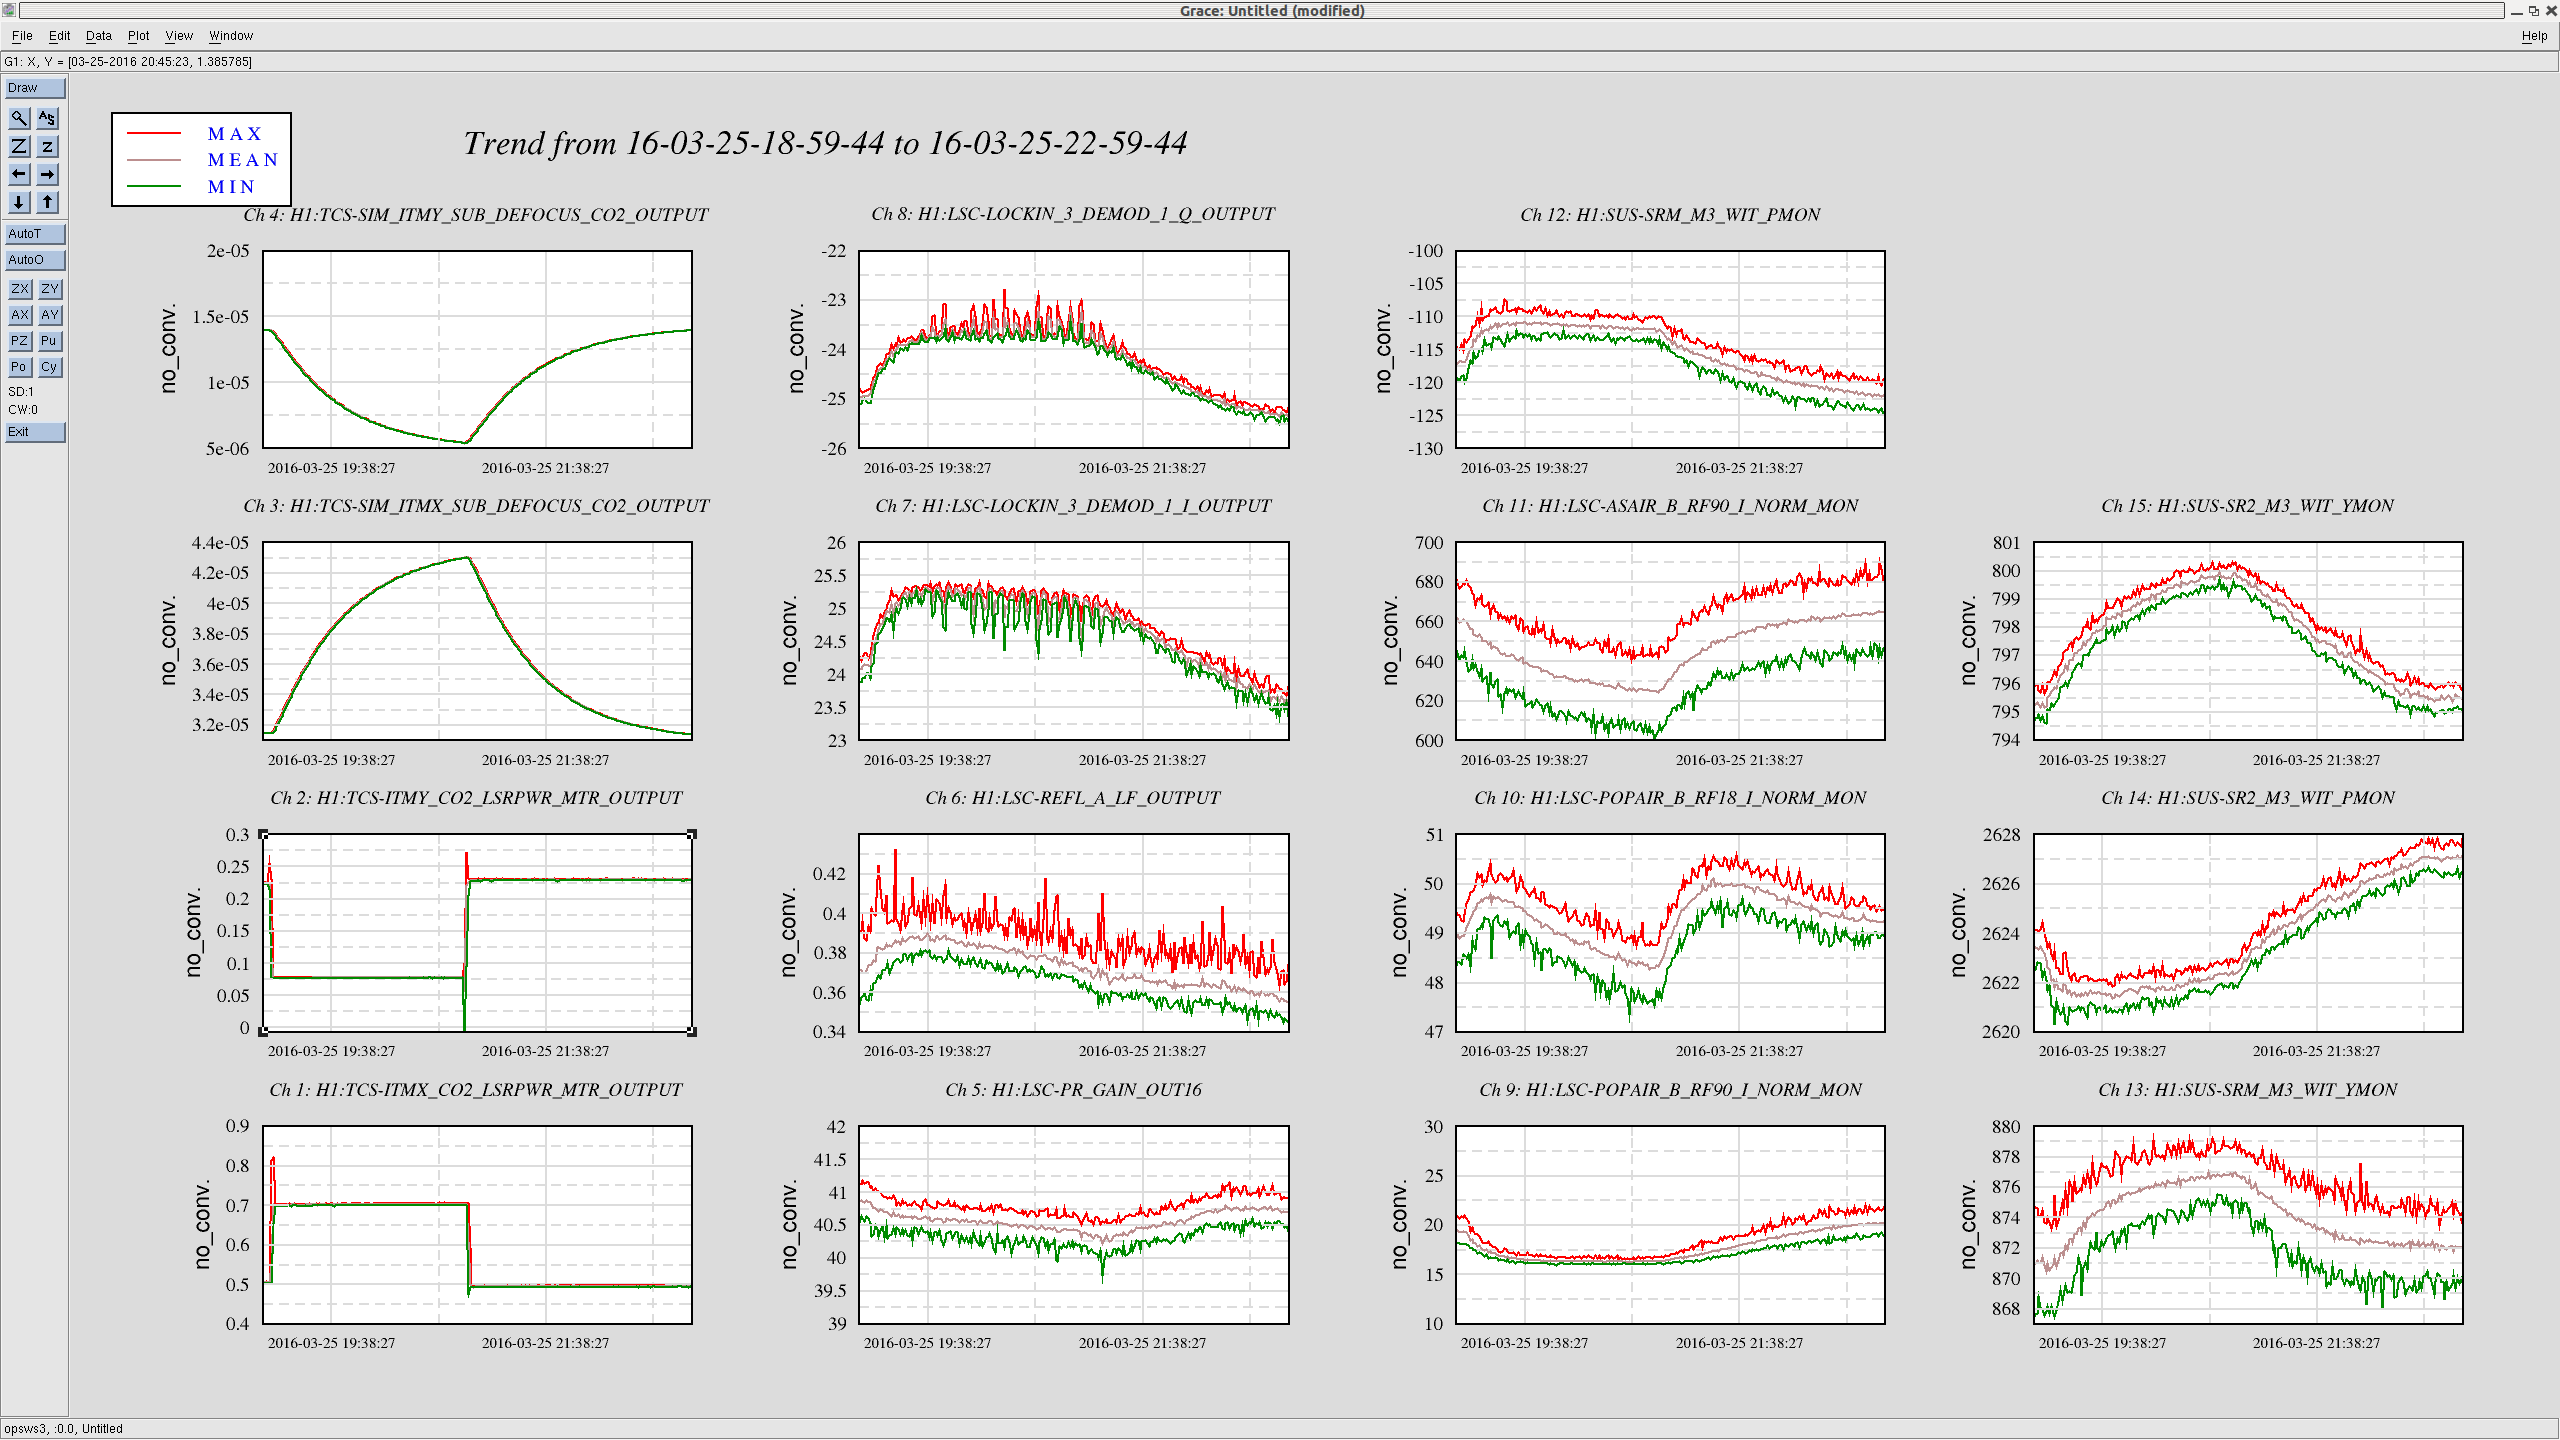
This time, I also took many measurements of the intensity and frequency noise couplings periodically throughout the test using Evan's automated measurement script (20470). I will analyze and post them later. The second attachment is trend of some relevant channels.
This is a report on the intensity noise coupling measurement to DARM during the same TCS testing period.
The below is an animated plot showing how the intensity noise coupling evolved as a function of time during the test. The transfer function was measured from ISS-SECONDLOOP_SUM14_REL to CAL-DELTAL_EXTERNAL. DELTAL_EXTERNAL is unwhitened.
As shown in the above animated plot, the intensity noise increased at the beginning and then went back down to where it was. The overall spectral shape almost did not change, but the scaling factor has changed roughly by a factor of two comparing the minimum and maximum. The magnitude of the coupling rises in proportion to frequency -- if I plotted them for a coupling to DCPDs, they would be almost flat due to the cavity pole correction taken out.
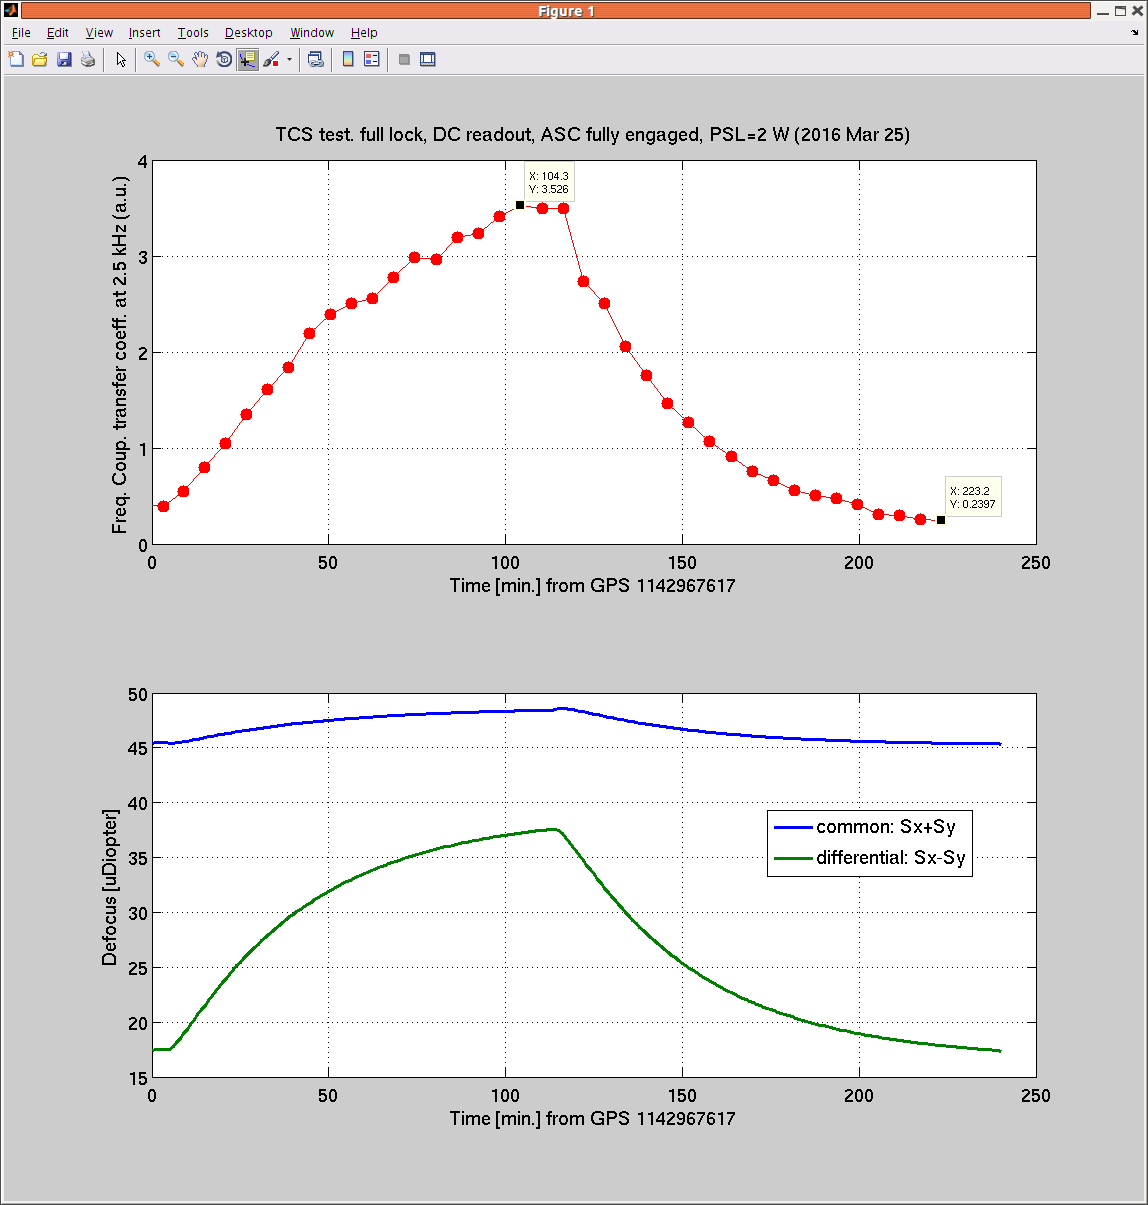
Here is another plot showing the evolution of coupling as a function of time.
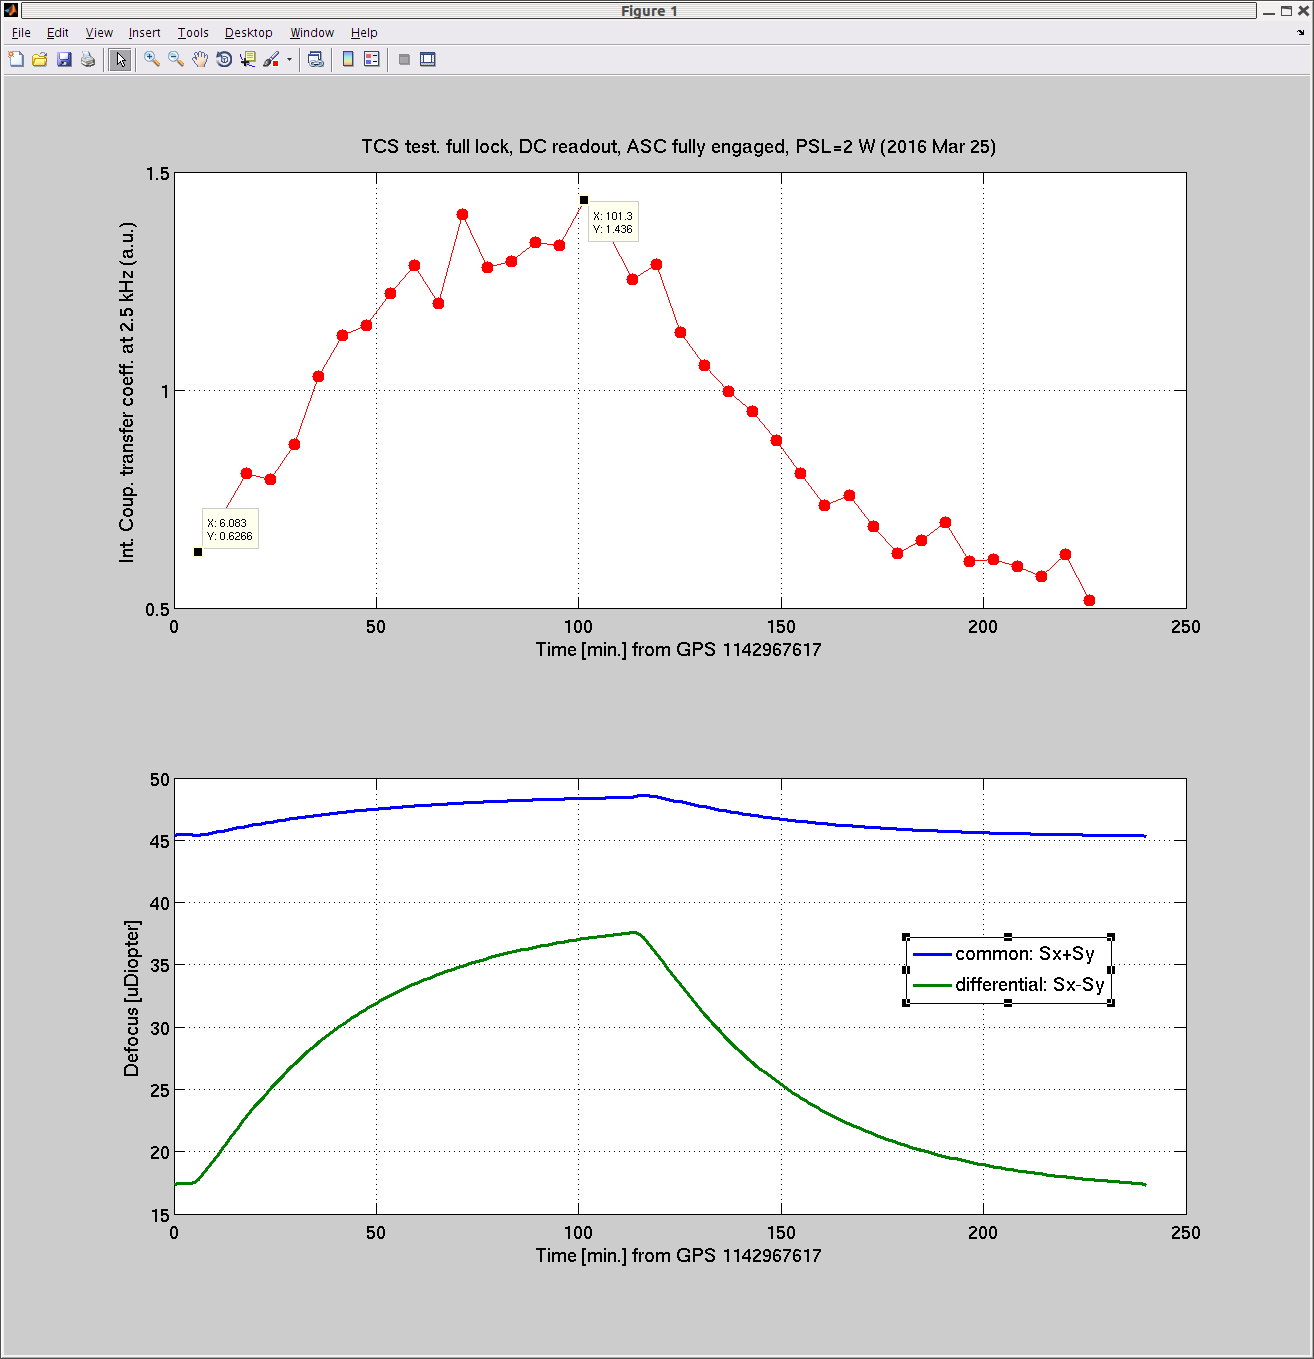
The upper plot shows the transfer coefficient at 2500 Hz (in arbitrary unit) as a function of time. The bottom plot shows the CO2 lensing from the same period. The transfer coefficient shows a clear correlation with the defocus of ITMs. I can not say for sure if the differential was a dominant cause of this effect because I had a few uD defocus as well in the same fashion.
Here is the same analysis for the frequency noise coupling to DARM. The variation in the coupling is more drastic than that of intensity noise.
The below is a same type of animated plot. The transfer function was measured from REFLA_RF9_I_ERR to CAL-DELTAL_EXTERNAL. Note that DELTAL_EXTERNAL is properly unwhitend.
It seems that the coupling has two different mechanisms, one for the coupling below 300 Hz and the other for the above. As the CO2 setting changed, the high frequency part increased at the beginning and decreased later while keeping the same spectral shape. On the other hand the low frequency part varied in an opposite fashion; it decreased as the high frequency part increased. The slope of the high frequency coupling seems to be almost proportional to f. If we convert it into [OMC DCPDs [A] / laser frequency [Hz]], it will be more like 1/f due to the cavity pole and REFL's transfer functinon against the laser frequency.
Here is another plot showing the evolution of the transfer coefficient at 2500 Hz. The coupling coefficient changed by a factor of 15 at this frequency. This is much more drastic than that of the intensity noise coupling which varied by a factor of two or so.
A preliminary conclusion:
With the 2 W PSL, the DARM cavity pole prefers a high CO2 differential lensing while the laser noise couplings prefer a low differential lensing.
This is a belated analysis on the intensity noise coupling. The punch lines are:
- The intensity noise coupling did not seem to have hit an optimum point where the coupling is minimized.
- The magnitude of the coupling at high frequency is too high by a factor of 10 compared to a simple model.
[Noise coupling v.s. differential lensing]
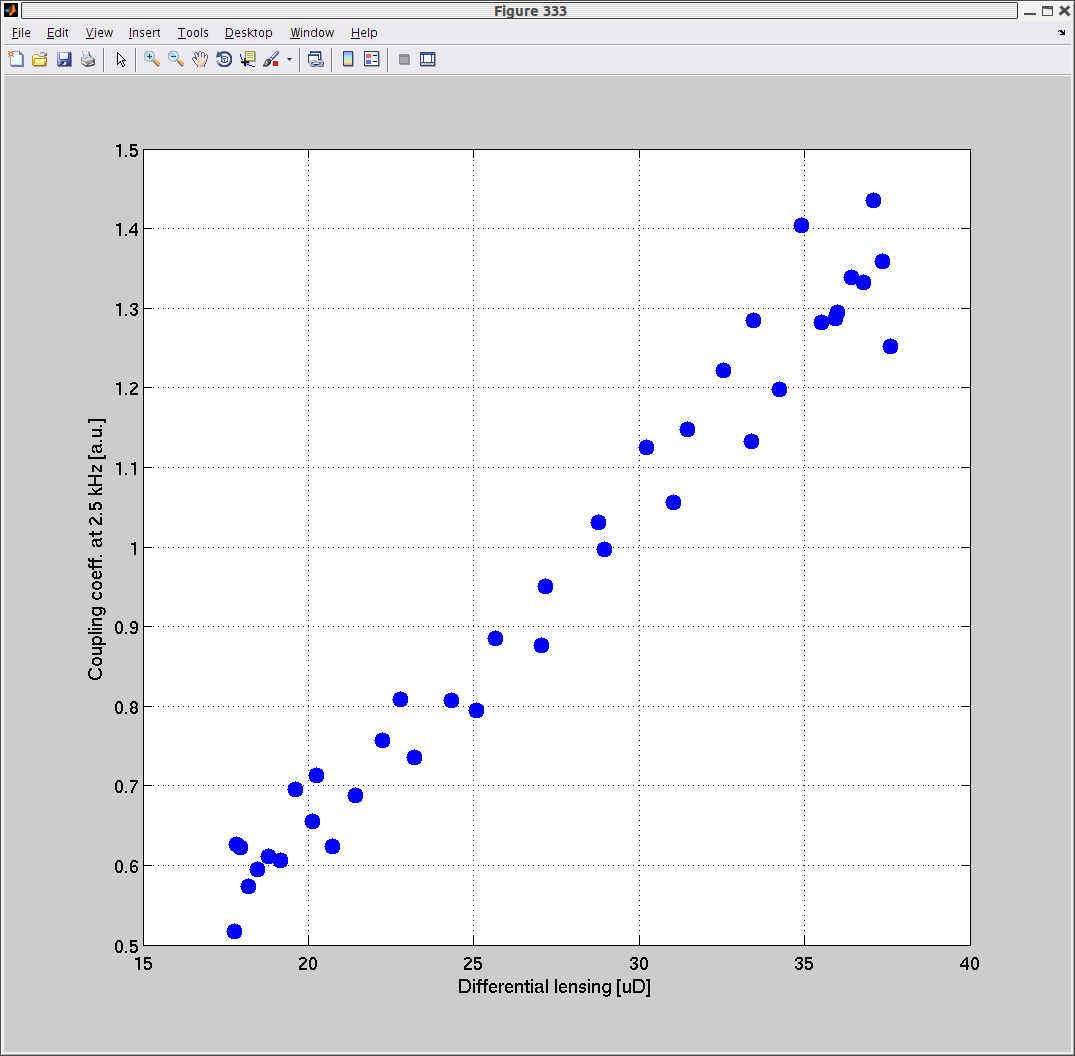
As seen in the plot above, the coupling coefficient shows a linear relation to the differentianl lensing. This likely indicates that the differential lensing is not optimized to minimize the intensity noise coupling. I should note that this measurement had used the badly clipped COY beam (27433) which was later fixed in May 2016; a smaller differential lensing means less power in CO2Y than CO2X.
[Intensity noise coupling]
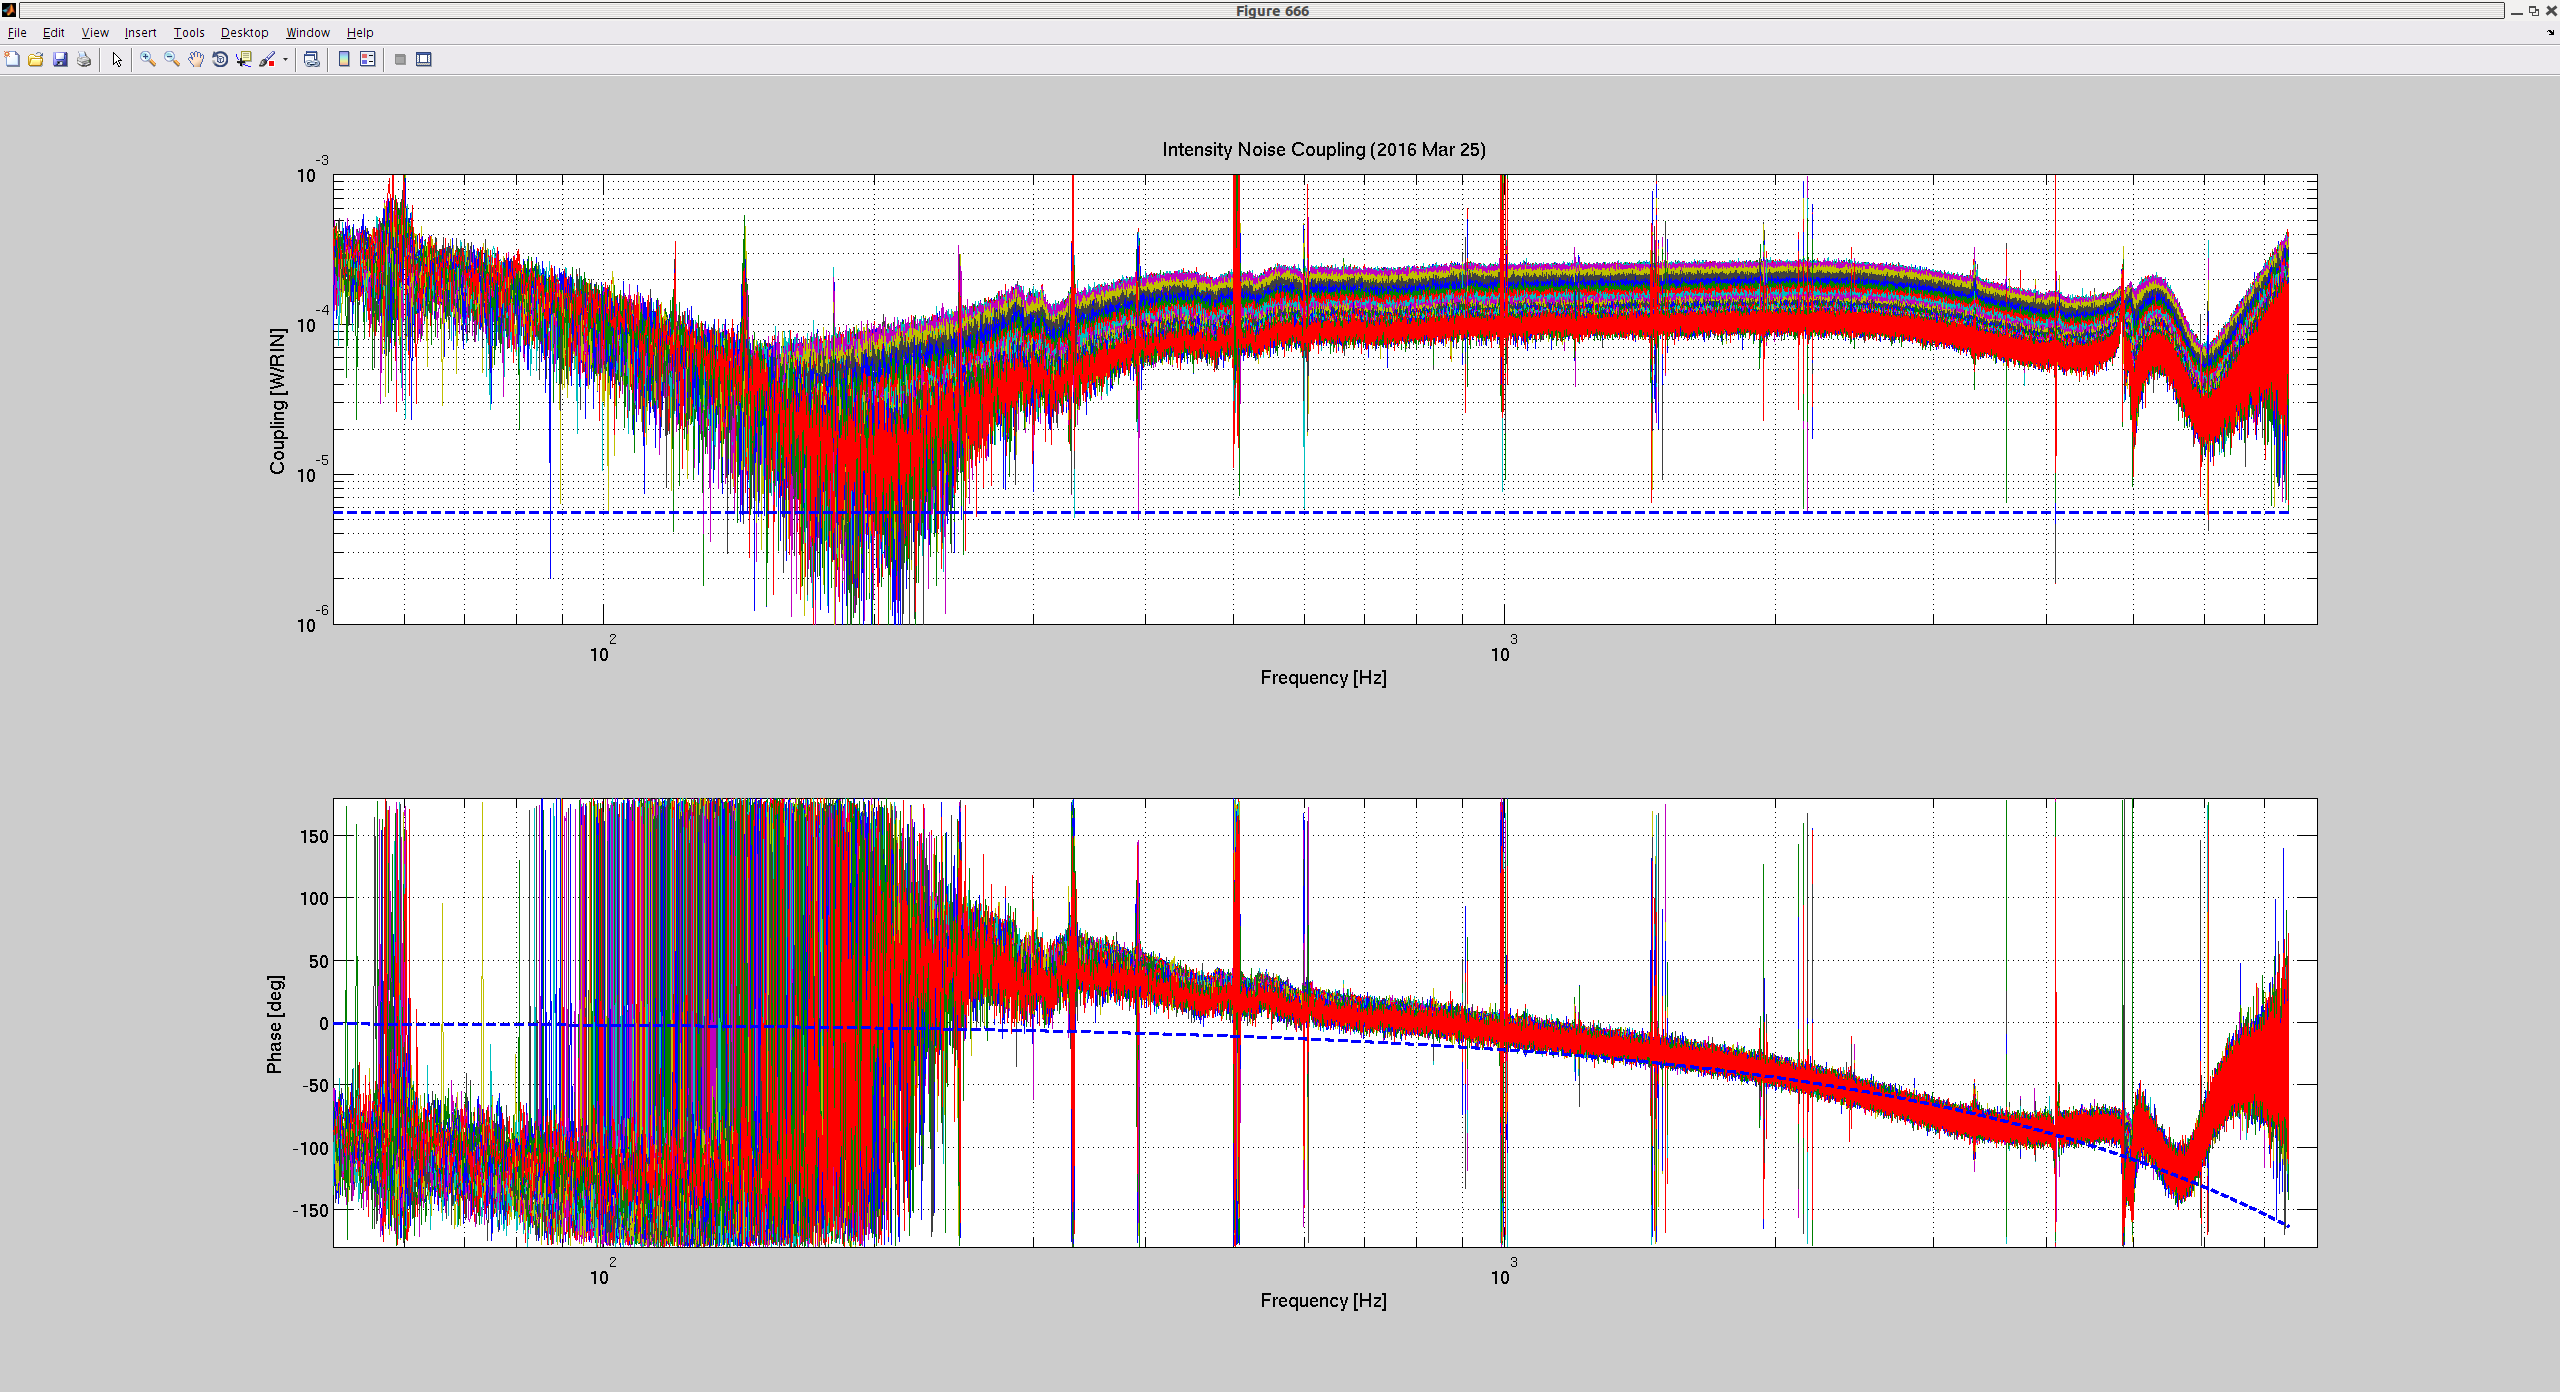
Here is a plot showing the intensity noise coupling of the various TCS settings. This time the coupling coefficient is converted to OMC power [W] / input RIN. The dashed line in the magnitude represents the expected value calculated by
(coupling) = 2 * J1^2 * Pin * Tomc * Tifo [W/RIN] = 5.5e-6 [W/RIN],
where Pin = 2 W is the PSL input power, Tomc = 61.4 ppm is the OMC transmission for the 45 MHz RF sidebands, and Tifo is the transmission of the intereferometer for the 45 MHz RF sidebands which I have assumed to be 1 for quick calculation. As seen in the plot, the expected noise level (limited by the 45 MHz RF sidebands) is lower then the measurement by roughly a factor of 10. These two plots support the hypothesis that we are far from the optimum point.
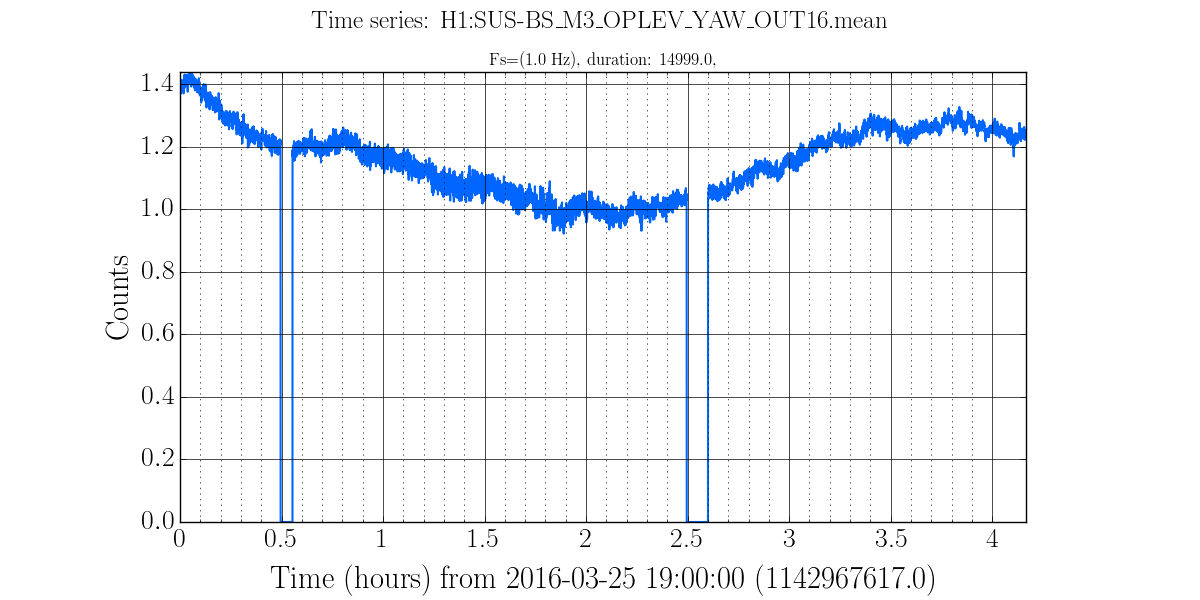
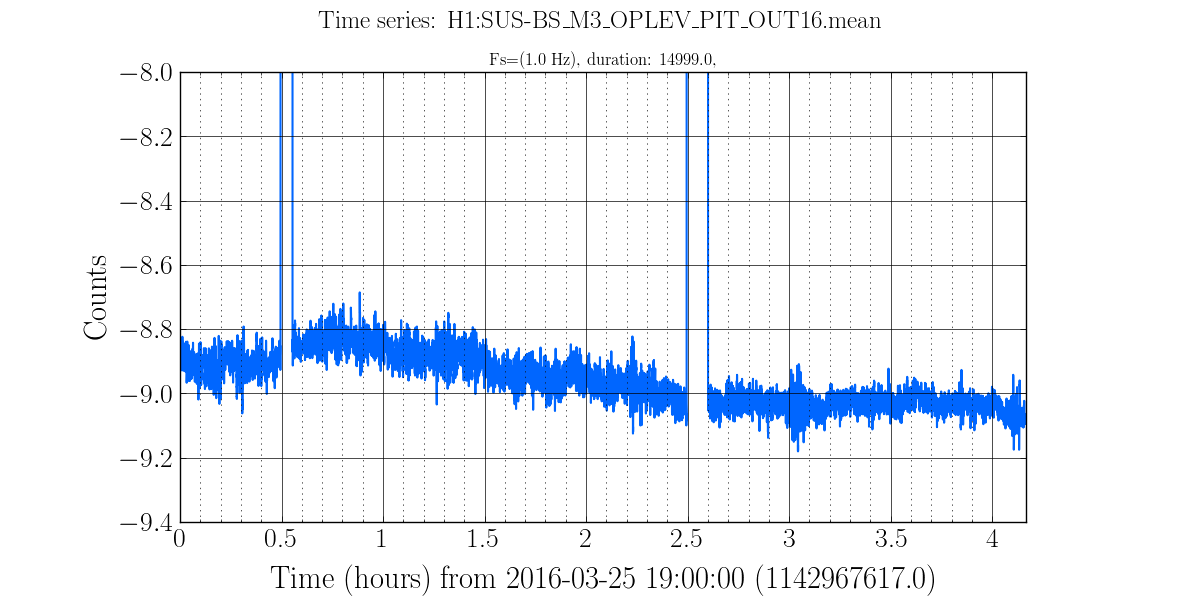
Here are the beamsplitter angles as a function of differential lensing. (There are some data dropouts in the trends).
This seems to indicate that a differential lens change of a few tens of microdiopters causes the beamsplitter yaw to change by a few hundreds of nanoradians, presumably via changes in the 36 MHz angular plant. In pitch it is less clear whether we are seeing angular control effects or simply drift over time.