Summary:
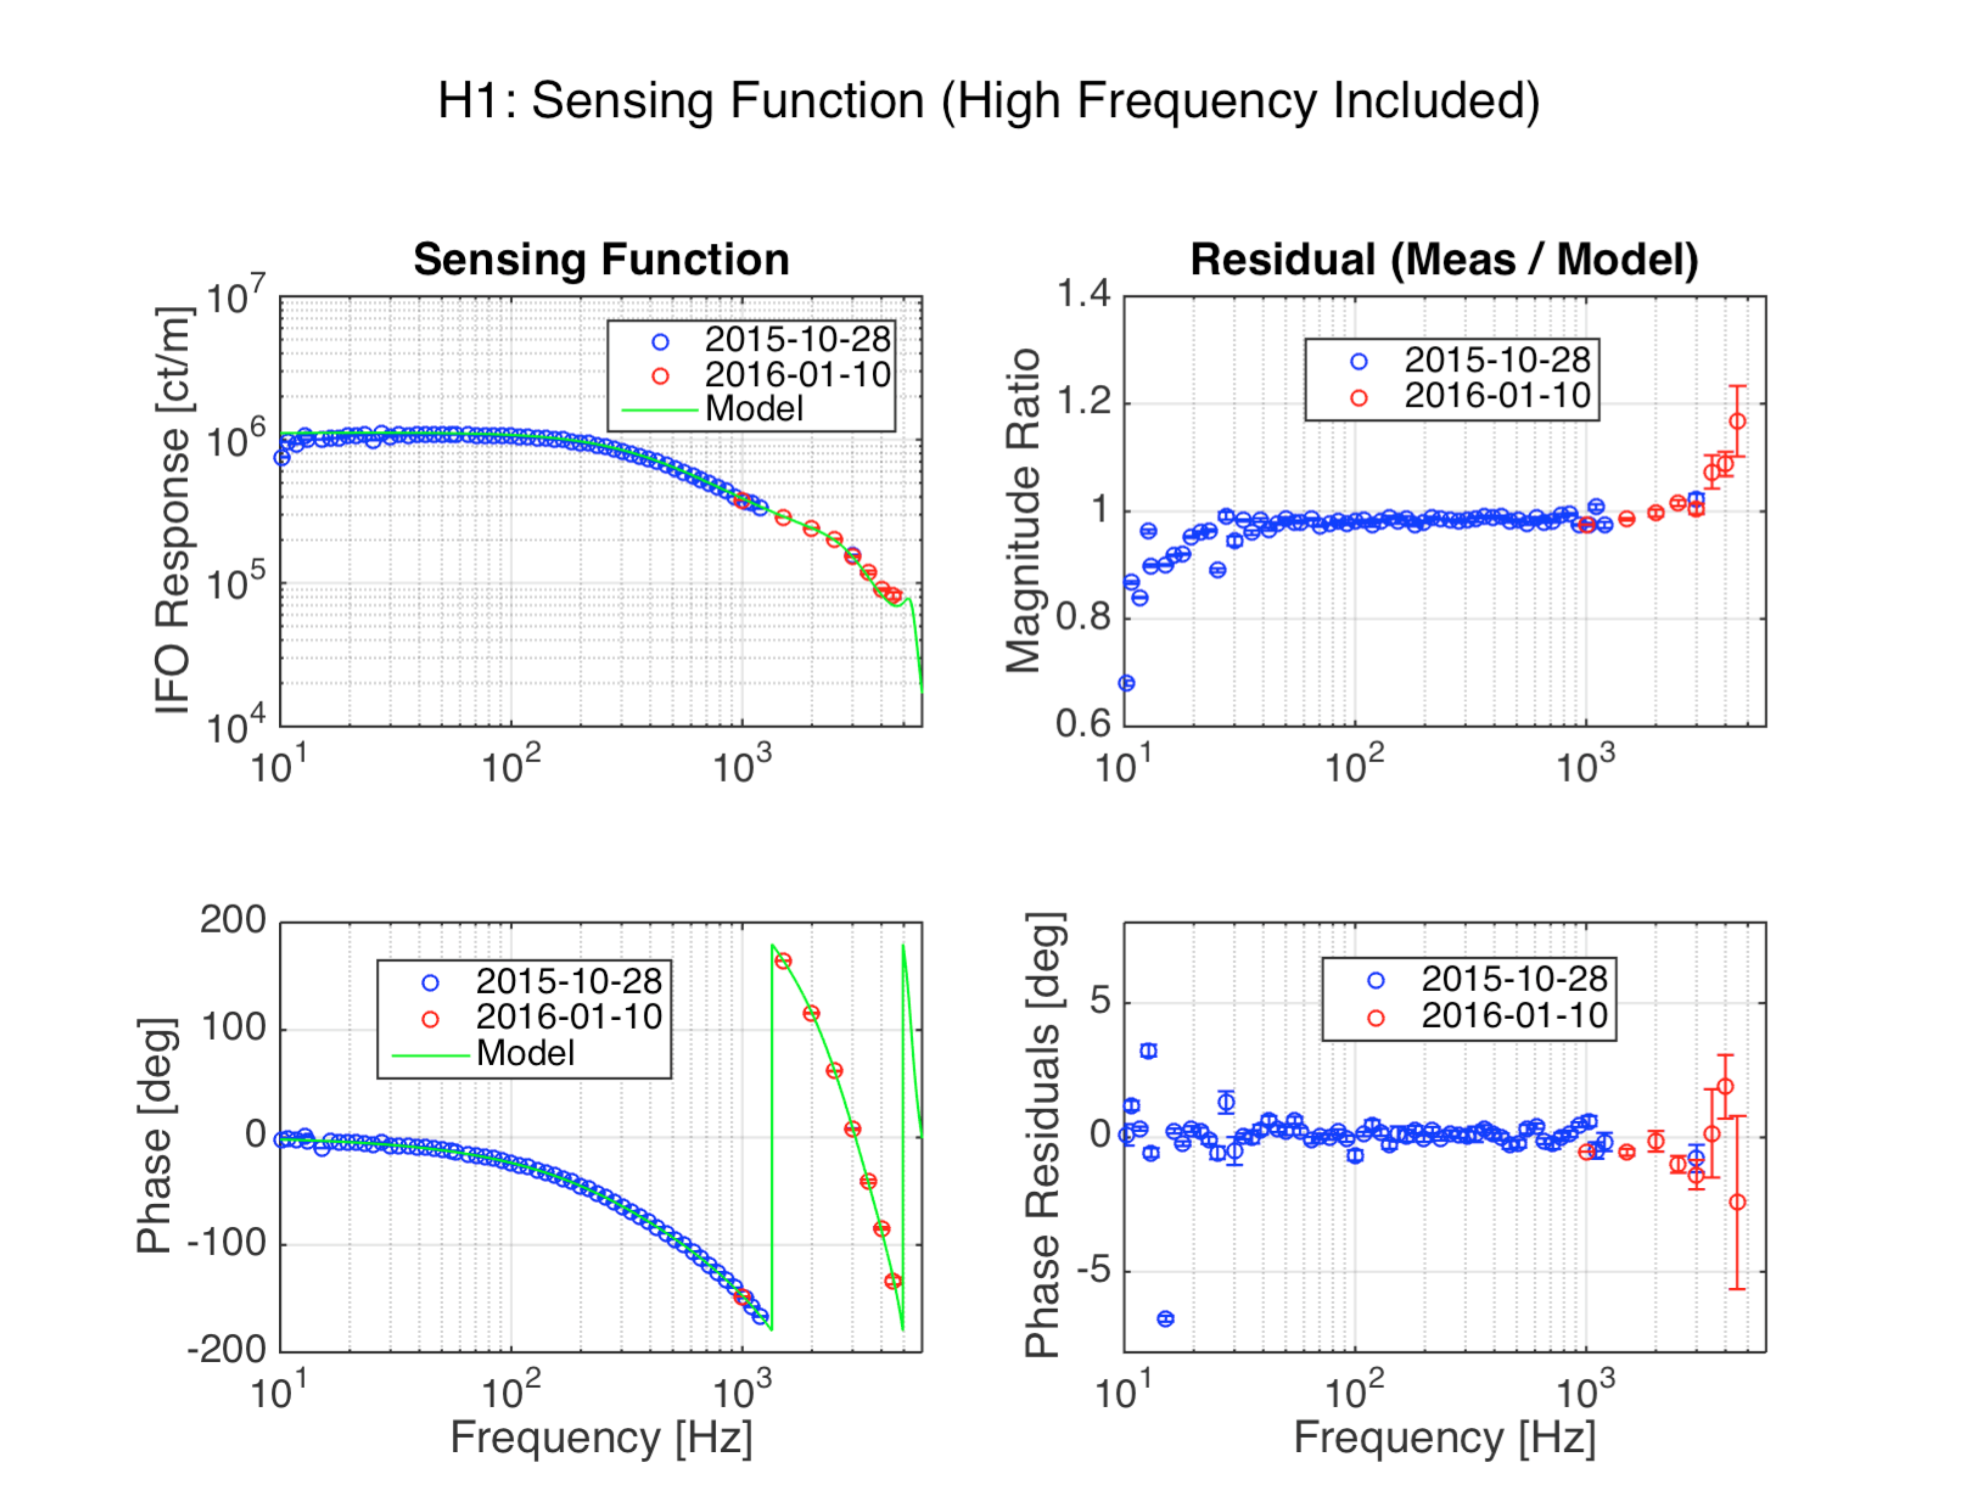
The high freqency calibration lines injected at the end of O1 (alog 24843) were analyzed to estimate the sensing function at those frequencies and compare it to the matlab DARM model. The calibration at frequencies above few kHz shows deviation from the model. The upward trend in the residual, as shown in the plot below, looks like the effect of the bulk elastic deformation of the testmass due to the misalignment of the pcal beams. However, this is not a definitive conclusion because the phase doesnot seems to suffer so much and also the error bars are too large to make a definitive statement. A set of measurement might be necessary to see if this effect is in fact reproducible.

Details:
The SLM tool was used to estimate the line amplitude with FFT duration listed below for each individual lines. The mean of the several data points was taken as the central value and the coherence of the measurement was estimated using magnitude squared coherence:
Coh = (A.B*)2 / A2 * B2
where A and B are amplitude of DARM_ERR and PCAL_PD channels readout.
Freq    Amplitude    Start Time           Stop Time        Duration     FFT       Data points   Optical Gain
(Hz)           (ct)        (mm-dd UTC)     (mm-dd UTC)    (hh:mm)    (mins)      (#'s)             (kappa_C)
------------------------------------------------------------------------------------------------------------------------------------------
1001.3       35k         01-09 22:45     01-10 00:05         01:20         10           8                   0.995

1501.3       35k         01-09 21:12     01-09 22:42         01:30         10           9                   0.995

2001.3       35k         01-09 18:38     01-09 21:03        02:25          10          13                  1.00

2501.3       40k         01-09 12:13     01-09 18:31        06:18          30          12                  0.995

3001.3       35k         01-10 00:09     01-10 04:38        04:29          30           8                   0.99-0.96 (Fluctuating)

3501.3       35k         01-10 04:41     01-10 12:07        05:26          30          10                  0.99

4001.3       40k         01-09 04:11     01-09 12:04        07:55          60           5                   1.00

4501.3       40k         01-10 17:38     01-11 06:02        12:24          60          11                   0.99

5001.3       40k         01-11 06:18     01-11 15:00        ~9:00          60           9                    -----
These additional data points were added to one of the Pcal sweep done earlier during the run. In this case I picked the data from 2015-10-28. The optical gain during this sweep measurement was around 0.985 compared to 0.99-1.00 (from table above) during the high frequency injections. These optical gains were eye-balled from the detchar summary pages so I considered them within the margin of error and thus didnot do any correction. A new parameter file is created to run this as a new set of measurement. The parameter file is stored at the following location:
ligo/svncommon/CalSVN/aligocalibration/trunk/Runs/O1/H1/Scripts/DARMOLGTFs/H1DARMparams_20151028E.m
A script used make the plot attached above and save the output as a mat file is located here:
ligo/svncommon/CalSVN/aligocalibration/trunk/Runs/O1/H1/Scripts/DARMOLGTFs/make_sensing_HF.m
The result of the the above script is saved at the following location and is also attached to this alog.
ligo/svncommon/CalSVN/aligocalibration/trunk/Runs/O1/H1/Resulta/DARMOLGTFs/2015-10-28E_H1DARM_HF_sensing.mat

Hi Sudarshan,
Does your model include the FSR peaks ? In other words, it the DARM sensing a single pole model ? See, for example, G1501316.
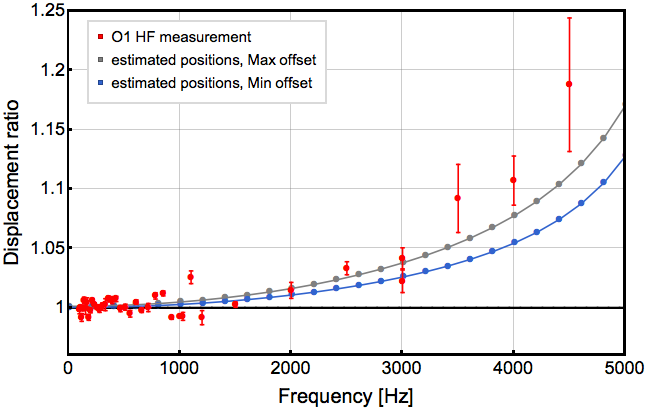
In the attached figure we show the effect of the test mass deformations due to PCal beams on the calibration using COMSOL simulations. For the simulation we used the locations of the PCal's beams from T1600372 and main beam from G1501362 . The two curves in the plot corresponds to maximum and minimum offsets of the beams that we get from these documents. Explicitlly for the main beam we used (5,-5) mm and for PCal beams we usedd the values reported in the table below.
| MAX OFFSET [mm] | MIN OFFSET [mm] | |||
| X | Y | X | Y | |
| Upper beam | 1.8 | 6.1 | -0.2 | 4.1 |
|
Lower Beam |
1.77 | 6.6 | -0.23 | 4.6 |
We normalized the data points so that it will be 1 at low frequencies (the normailzation was 0.983).