We have an oscillation in H1 that has been with us for a long time, is not understood, and can be mitigated by moving alignment offsets, and gets worse at high power. All the information in this alog is elsewhere in the log, this is just a summary.
For about 6 months we didn't change our soft loop offsets because when we did we would get the oscillation, this is how we stayed stable through O1. The main symptom is that the pitch optical levers move at frequencies around 0.45 Hz, all in phase with each other, and if you look at the relative sign of the optical levers it looks like CSOFT motion. the POP and arm transmitted powers also oscillate. Now that our soft loops are working again, we are probably in a position to again tune the soft loop offsets to be stable at 20 Watts, but it seems like this won't be a great solution as we try to increase the power even further.
There have been many alogs about this, but I wanted to summarize some of the recent things we have looked at.
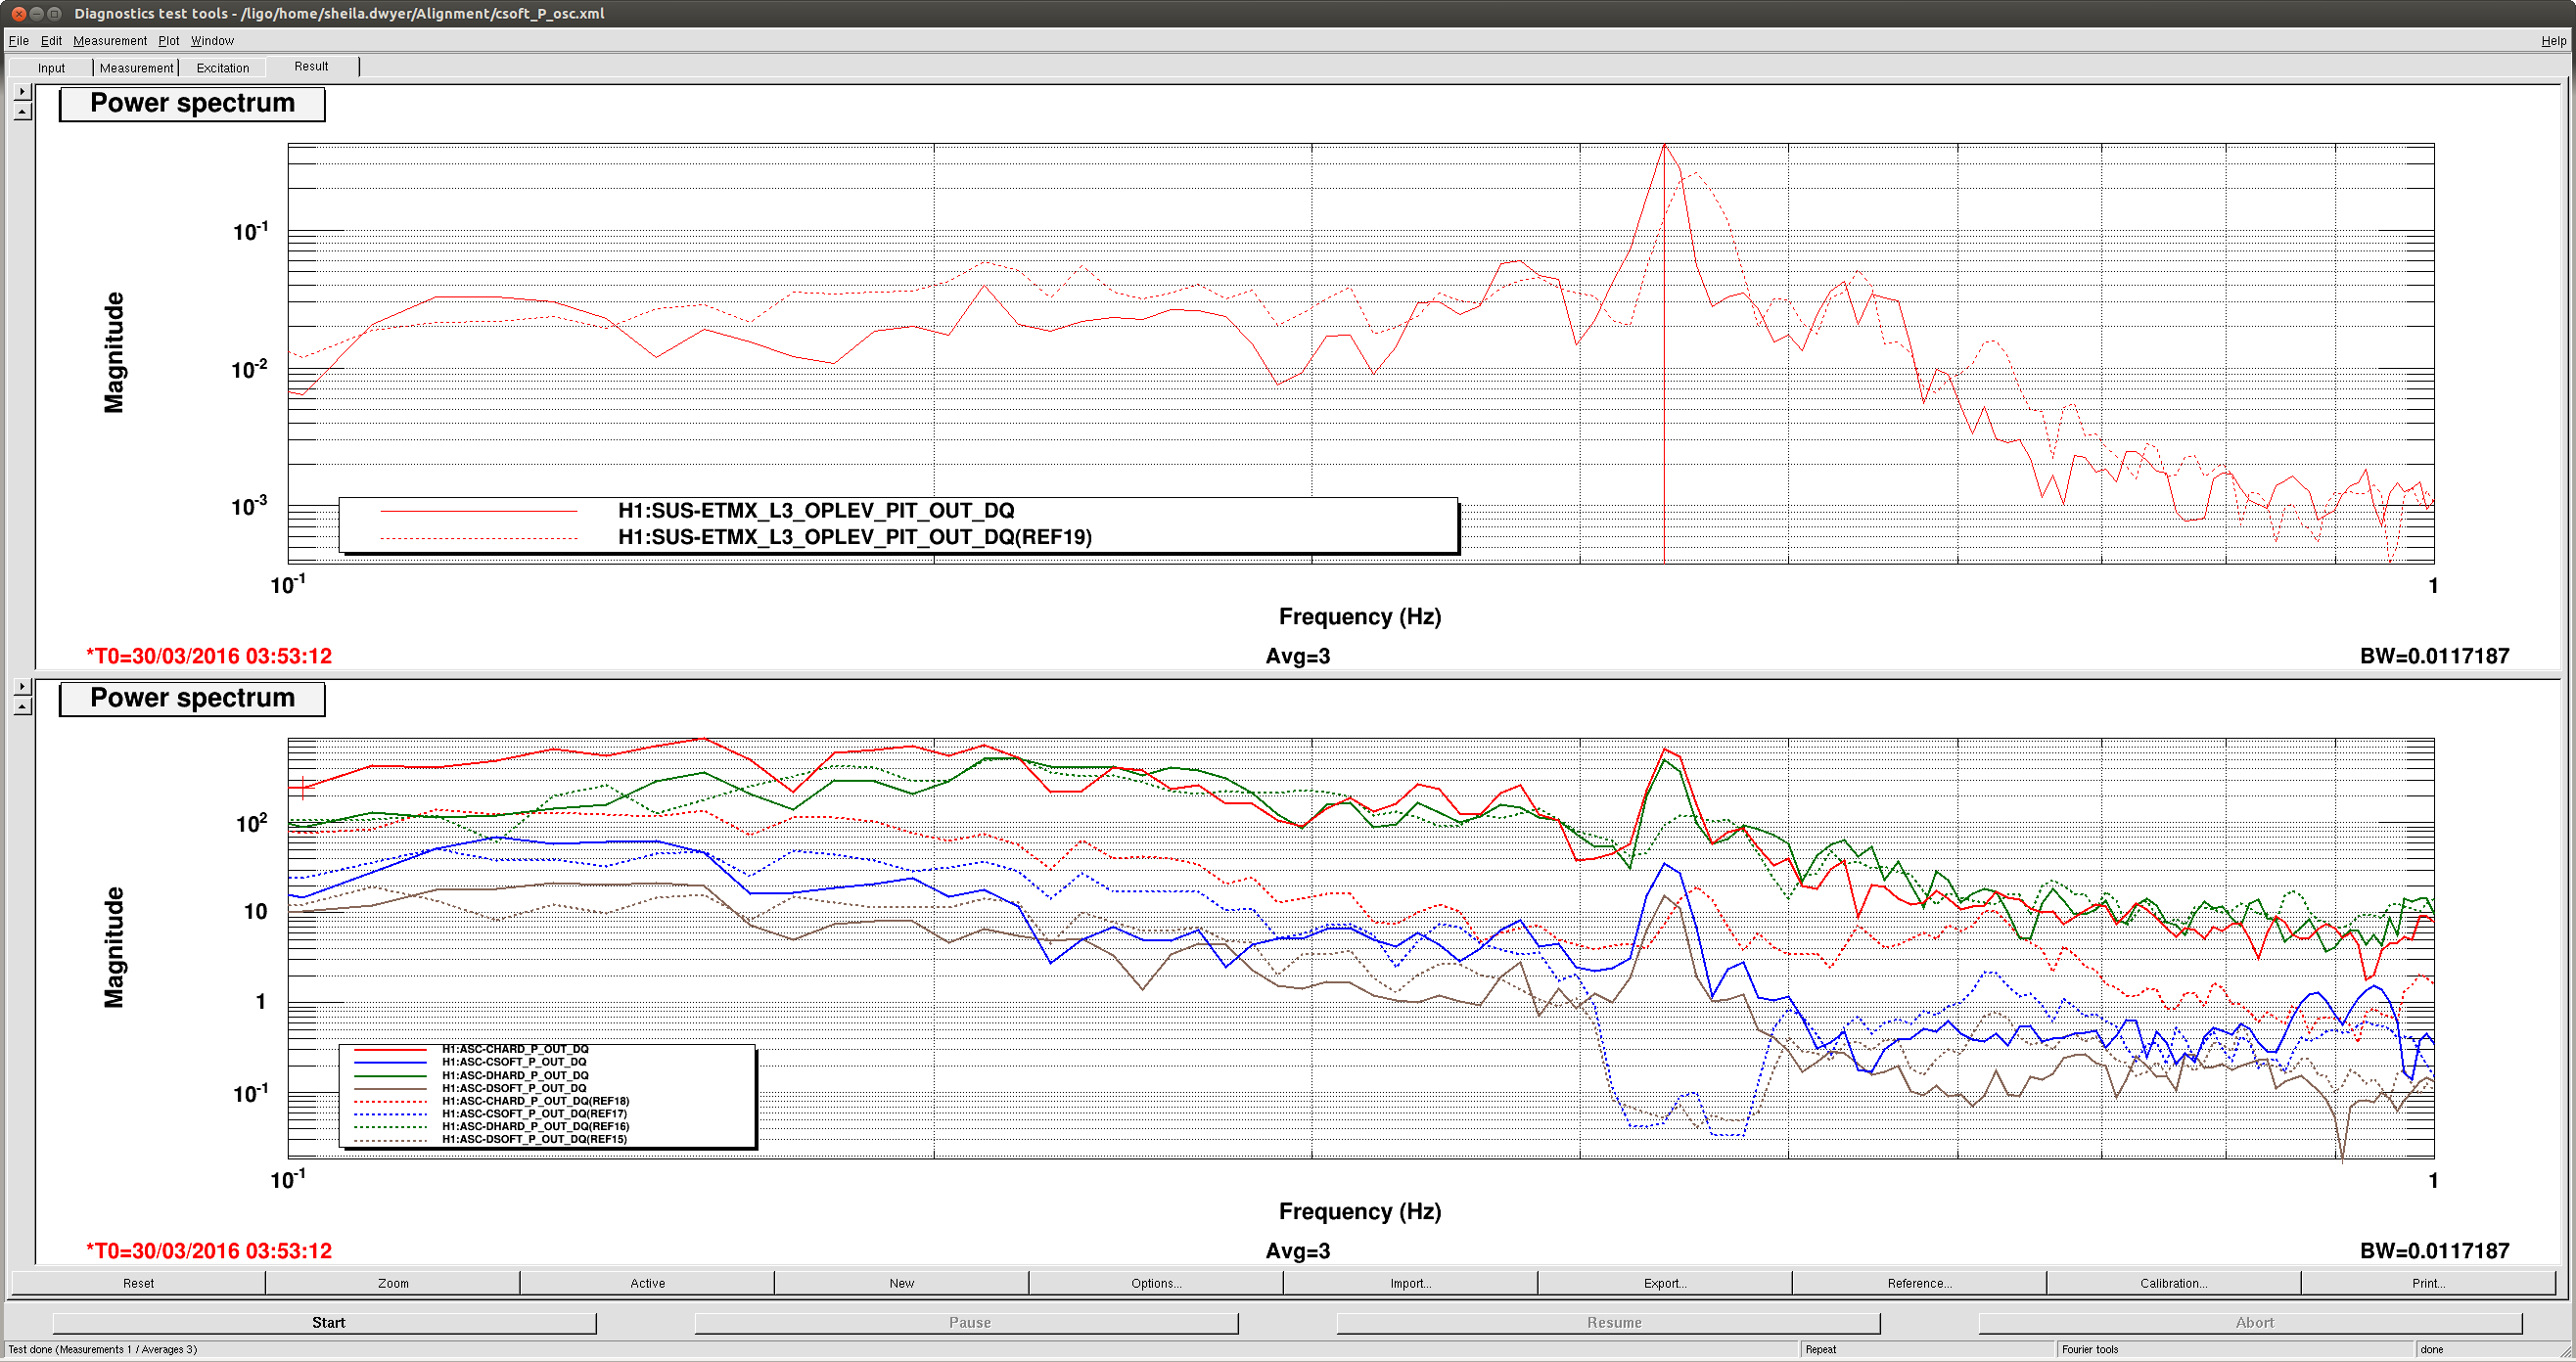
It seems like the torque that moves the test masses isn't coming from any of the arm ASC loops, or the optical lever damping. The first screenshot shows this, this is from Tuesday night when we powered up several times in slightly different configurations and repeatedly saw the same size of oscillation. The solid lines here show what was our normal configuration before Tuesday, with ITM optical lever damping on and ETM optical lever damping off. The dashed lines show the test configuration, where we added notches to the soft loops that reduce the actuation by about a factor of 100 at the oscillation frequency, and lowered the CHARD gains by a factor of 10. You can see that in the test configuration we also have about 5 and a half times less DHARD drive in the test configuration than in the normal one. Since all of these ASC drives are smaller in the test configuration but the oscillation is about the same, it seems like the force that moves the test masses must not be from these control signals.
It seems like the fluctuating radiation pressure due to changes in circulating power alone can't provide enough torque.
In the attached matlab script I estimated the miscentering we would need on each optic so that the approx 900 W changes in circulating power we see during the oscillation could provide the radiation pressure torque. These are way too large, ranging from 8-33 cm on the different optics. As a sanity check I also assumed that the alignment shift we see powering up before the soft loops get a changce to correct is due to radiation pressure (which it may not be). From that I estimate miscenterings ranging from 0.5-3 cm. I used the moment of interias from Evan Hall's alog , which he tells me are slightly wrong but not enough to matter.
The oscillation frequency does seem to depend on circulating power
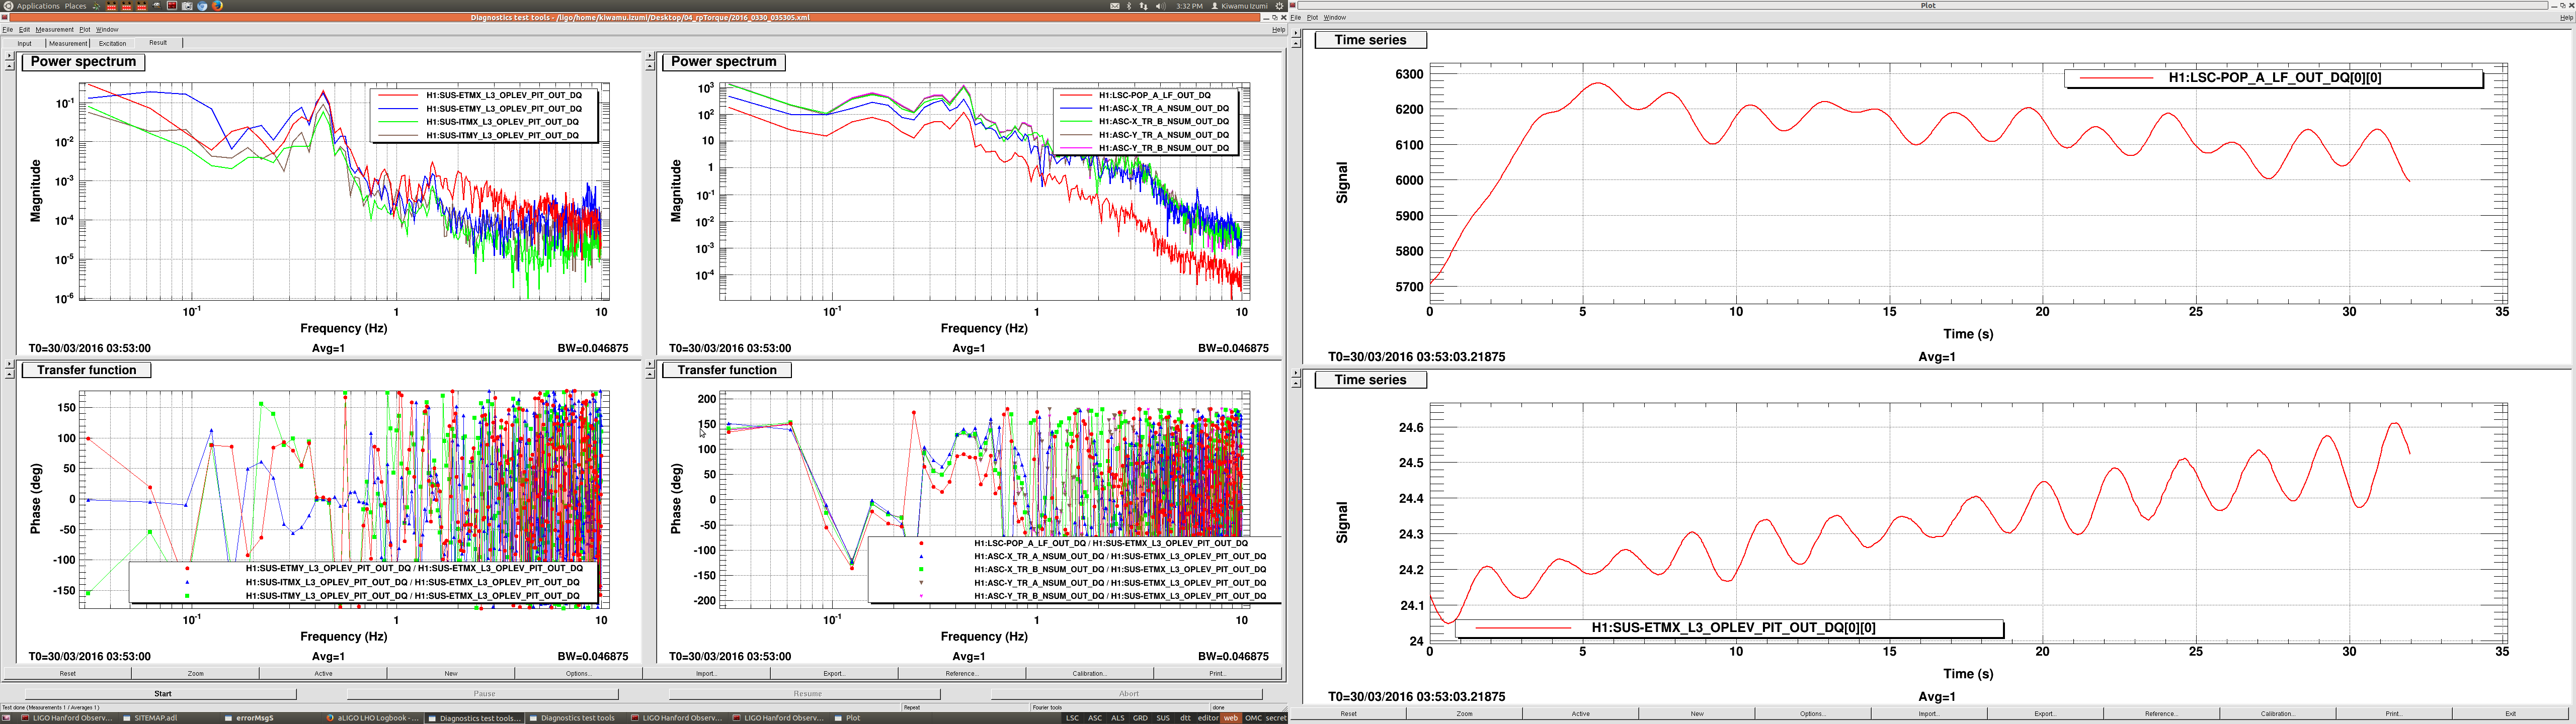
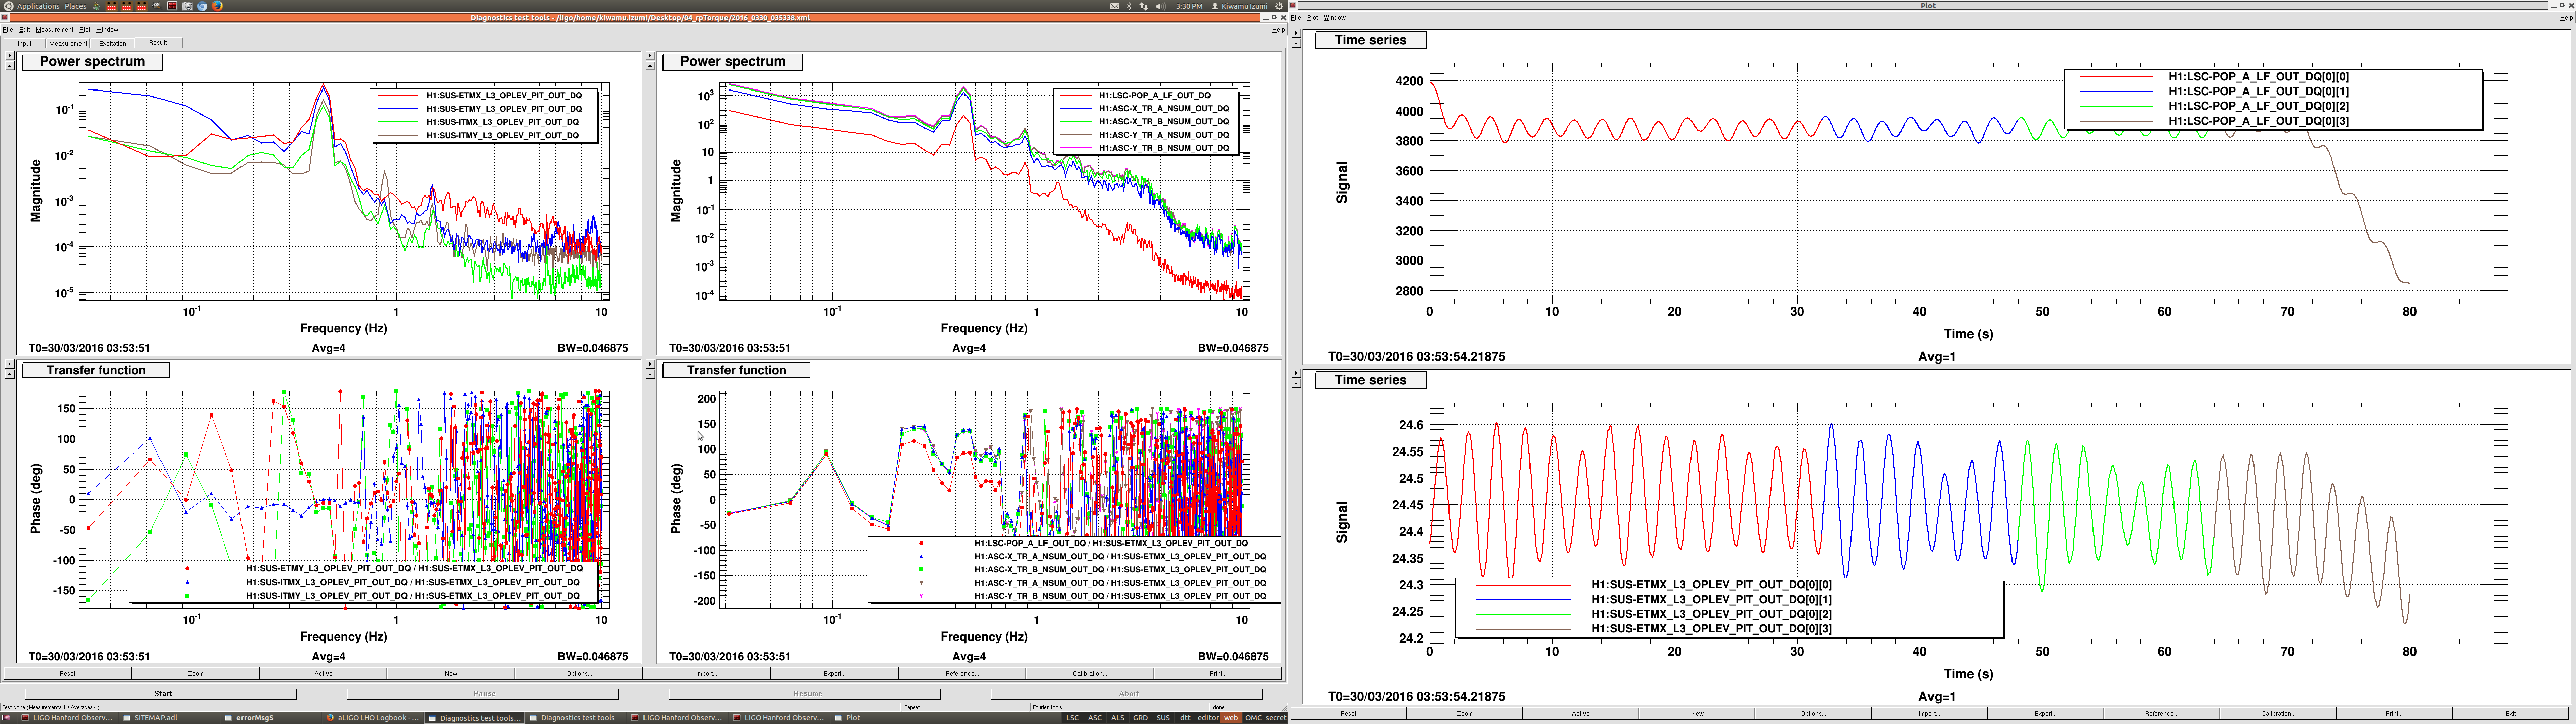
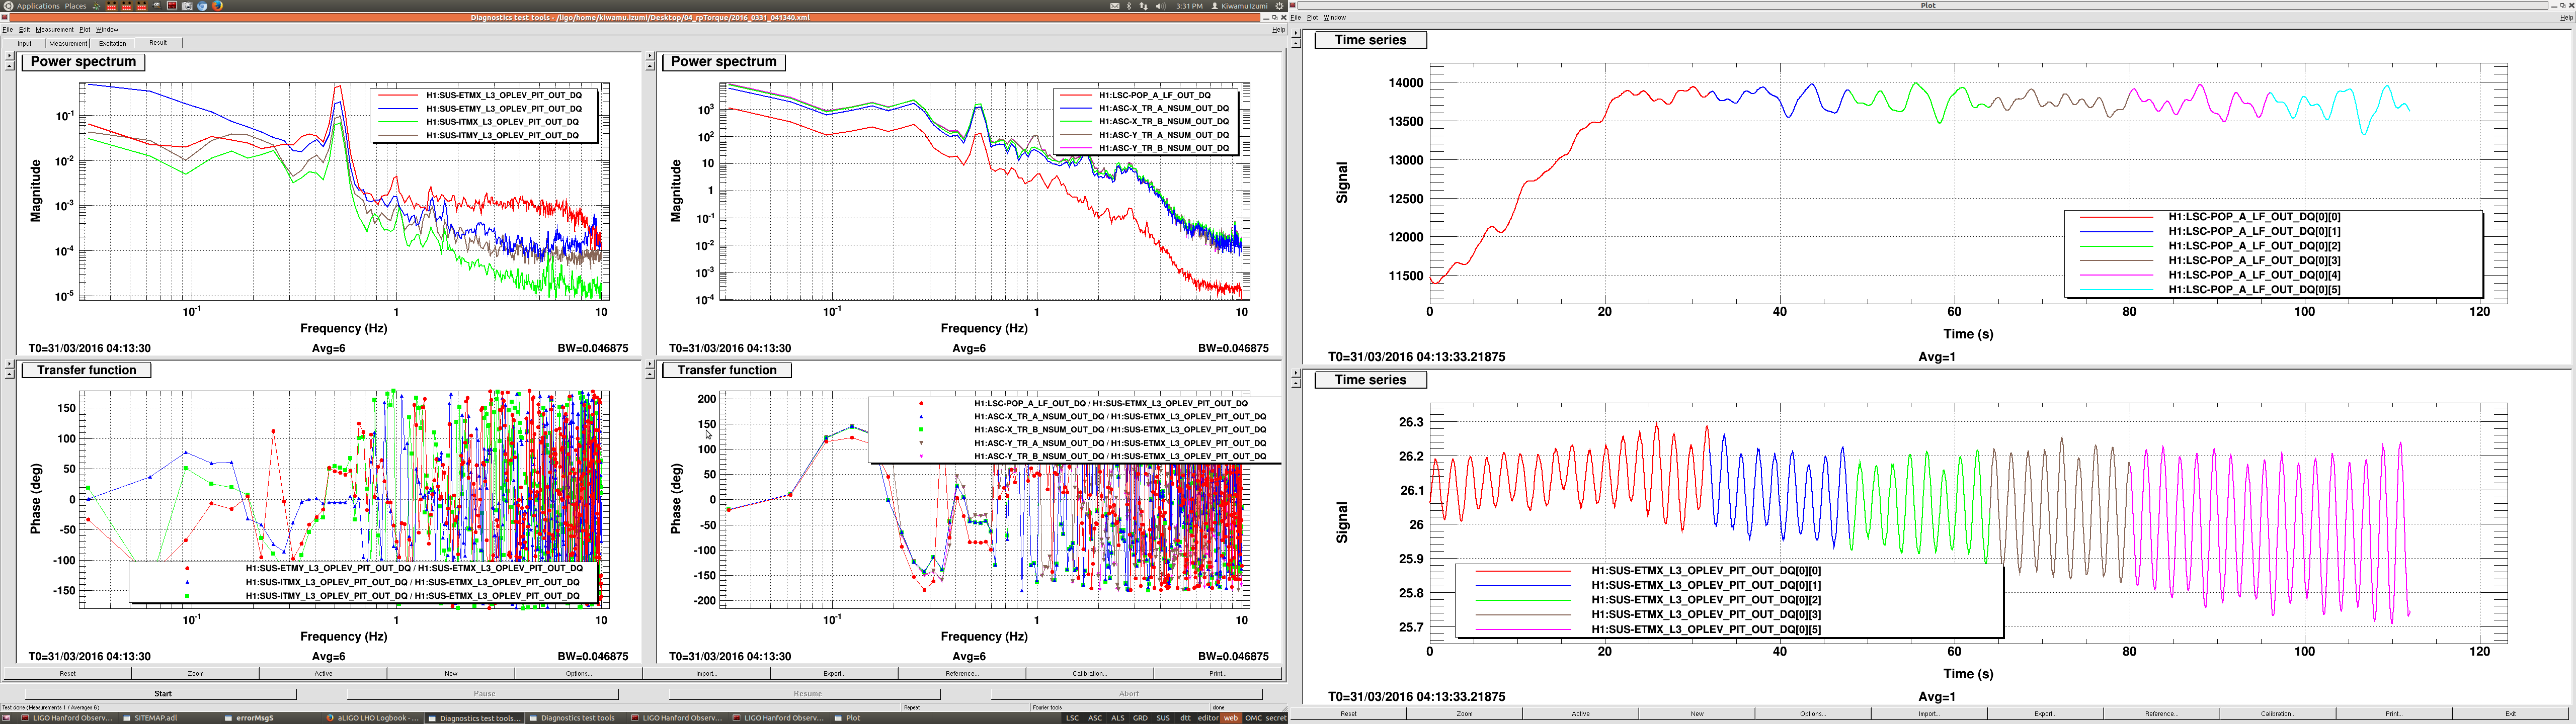
The evidence for this may be a little shaky since it is hard to get enough cycles of the oscillation to get a spectrum with nice resolution, but the second attached screen shot shows a spectrum of ETMX optical lever pit for 3 different circulating powers. These circulating powers are based on Dan Hoak's calibration and the TR XB QPD. The frequency of the lower two powers is the same within the resolution of my spectra. This may not hang together perfectly because I have included a little bit of time when we were powering up or down in the spectrum.
| frequency | circulating power | time |
| 0.44 | 23.6kW | 30/03/2016 03:53:05 |
| 0.44 | 34.3 kW |
30/03/2016 03:53:38 |
| 0.515 | 52.9 kW |
31/03/2016 04:13:30 |
Other ideas?
We have also tried putting a resonant gain the DARM loop(no impact), changing A2L feedforward (no impact), and centering on the ETMs (improvement). One possible test we could try to understand this better would be to drive the laser intensity and see if we can produce angular motion.


Given the observation 1 and 3 (torque moves masses, frequency not dependent on power), the most likely guess is that power modulation changes the feed-back on the fundamental mode of the quad pendulum.
Note that this doesn't require obervation 2 (feed-back through torque alone).
Instead, we need to estimate the effective change in the Q of the fundamental mode:
Q_RP = (Energy in quad pendulum oscillation) / (Energy pumped into the mode due to delayed power fluctuations)
We can estimate all of this:
a)
(Energy in quad pendulum oscillation) =omega^2/2 * SUM_i [ m_i x_i^2 + I_i*theta_i^2 ]
where the sum goes over all 4 masses of one quad (test, penultimate, etc.) , and the amplitudes x_i and theta_i come from the quad model https://awiki.ligo-wa.caltech.edu/aLIGO/Suspensions/OpsManual/QUAD/Models/20140304TMproductionTM , scaled by the observed pitch amplitude.
The dominant term is from the test mass. Neglecting the other masses, and for a pitch amplitude of 3e-7 rad (typical), we get
(Energy in quad pendulum oscillation) = 2.3e-12 Joule
b)
(Energy pumped into the mode due to delayed power fluctuations) = 2*pi*P0/c * (x_disp) * sin(phi)
Here P0 is the amplitude of the power fluctuation in the arm - from Sheila's number's I get 3.84% of the arm build-up, so let's call it 0.0384*50kW = 1.92kW
x_disp is the pendulum movement = effecive_arm * (3e-7 rad) = 1.21e-7 meter (the effective arm comes directly from the Quad page: effecive_arm = 0.244m / 0.602rad = 0.40meter )
phi is the phase delay between the pendulum motion and the power fluctuation. For a 1Hz cavity pole (do we have a more accurate number?) this is about 23deg
All this gives
(Energy pumped into the mode due to delayed power fluctuations) = 1.9e-12 Joule
or
Q_RP = 1.2 (there are enough approximations here that I would't thake the actual value seriously - but the effect is certainly of the right order of magnitude.
This is a follow up study on the angular instability. I have looked at the phase relation between some relevant signals from the data sets that Sheila posted.
Here is a summary:
| relative phase [deg] on 30/03/2016 03:53:05 | relative phase [deg] on 30/03/2016 03:53:38 | relative phase [deg] on 31/03/2016 04:13:30 | |
| ETMX oplev | N/A | N/A | N/A |
| ITMX oplev | -0.7 | + 0.1 | -5.0 |
| ETMY oplev | +2.8 | -5.4 | +43.7 |
| ITMY oplev | -1.05 | -14.8 | +52.3 |
| TR_X (average of A and B) | +136 | +137 | -46.1 |
| TR_Y (average of A and B) | +131 | +134 | -32.0 |
| POP_A_LF | +90 | + 92.0 | -84.8 |
The phases are measured with respect to the ETMX oplev. All the optical levers listed above are for pitch. Also I attach some screen shots of diaggui in which I extracted these phase information by taking passive transfer function measurements.
Interestingly, the first two data sets show qualitatively the same phase relations. However, the last data set showed very different phase relations. For example, all optical levers were almost in-phase in the first two data sets, while the last data indicates that the Y arm moved in advance to the X arm by 50-iish deg. Also, the cavity power signals were in advance with respect to ETMX oplev in the first data sets, while they were delayed in the last data set -- it seems as if they flipped the phase by 180 deg between the first two data sets and the last data set for some reason. This phase flip might be a clue to understand the cause of the instability.