keith.riles@LIGO.ORG - posted 12:42, Monday 11 April 2016 (26527)
Folding of additional H1 corner station magnetometer channels
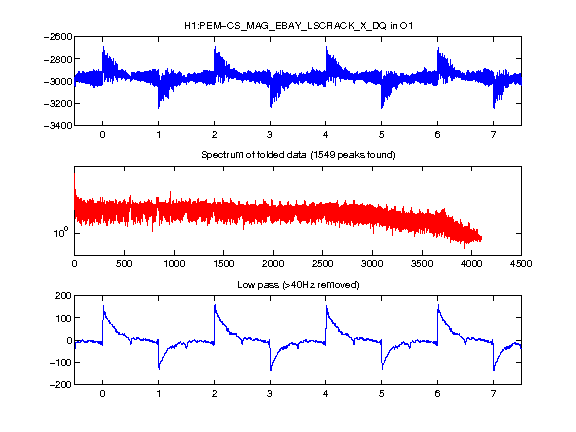
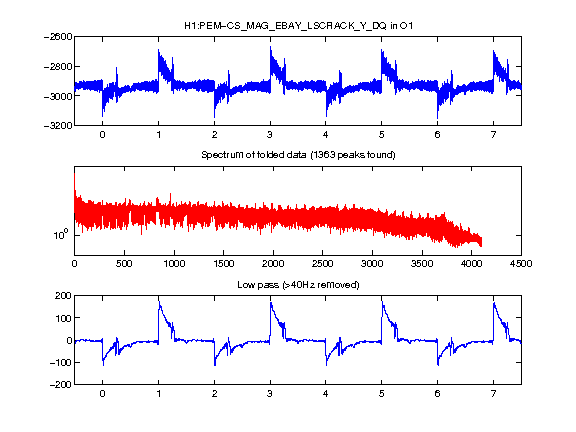
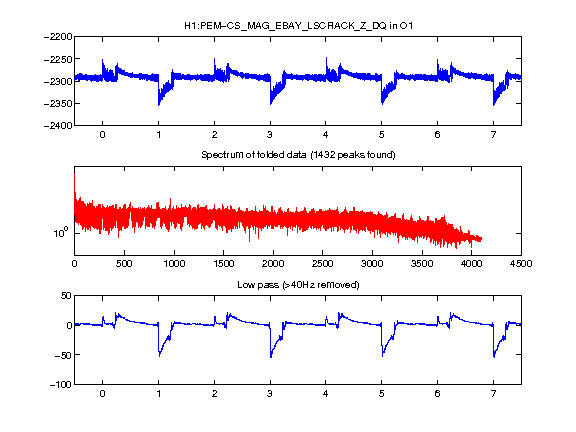
At Bryn Pearlstone's suggestion, Weigang Liu has tried folding data
daily/monthly/O1ly from corner station magnetometer channels
beyond the ones reported on previously, where as before,
data from October 20 (day of unplanned power outage) has been excluded.

Attached are the summary plots, while links to the daily & monthly plots are here:

H1:PEM−CS_MAG_EBAY_LSCRACK_X_DQ
H1:PEM−CS_MAG_EBAY_LSCRACK_Y_DQ
H1:PEM−CS_MAG_EBAY_LSCRACK_Z_DQ

As before, each figure has a top graph with the raw folded (averaged) data,
a middle graph with the spectrum of the folded data, and a bottom graph
which is the inverse FFT of the lowest 40 Hz.

These graphs are qualitatively similar to those seen before for some CS magnetometer channels
in that there is a 2-second periodicity with a positive excursion at a 1-second boundary, followed by
a negative excursion at the next 1-second boundary, and there is additional fine structure,
most notably an extra transient seen at the 0.25-second mark in successive
1-second intervals. In addition, the X channel shows a transient at the 0.5-second mark
of each second, and the Z channel here seems most different in character from
previously examined magnetometer channels. These fine structures are seen throughout O1.
Images attached to this report