john.worden@LIGO.ORG - posted 15:39, Wednesday 13 April 2016 (26575)
VEA/LVEA temperatures
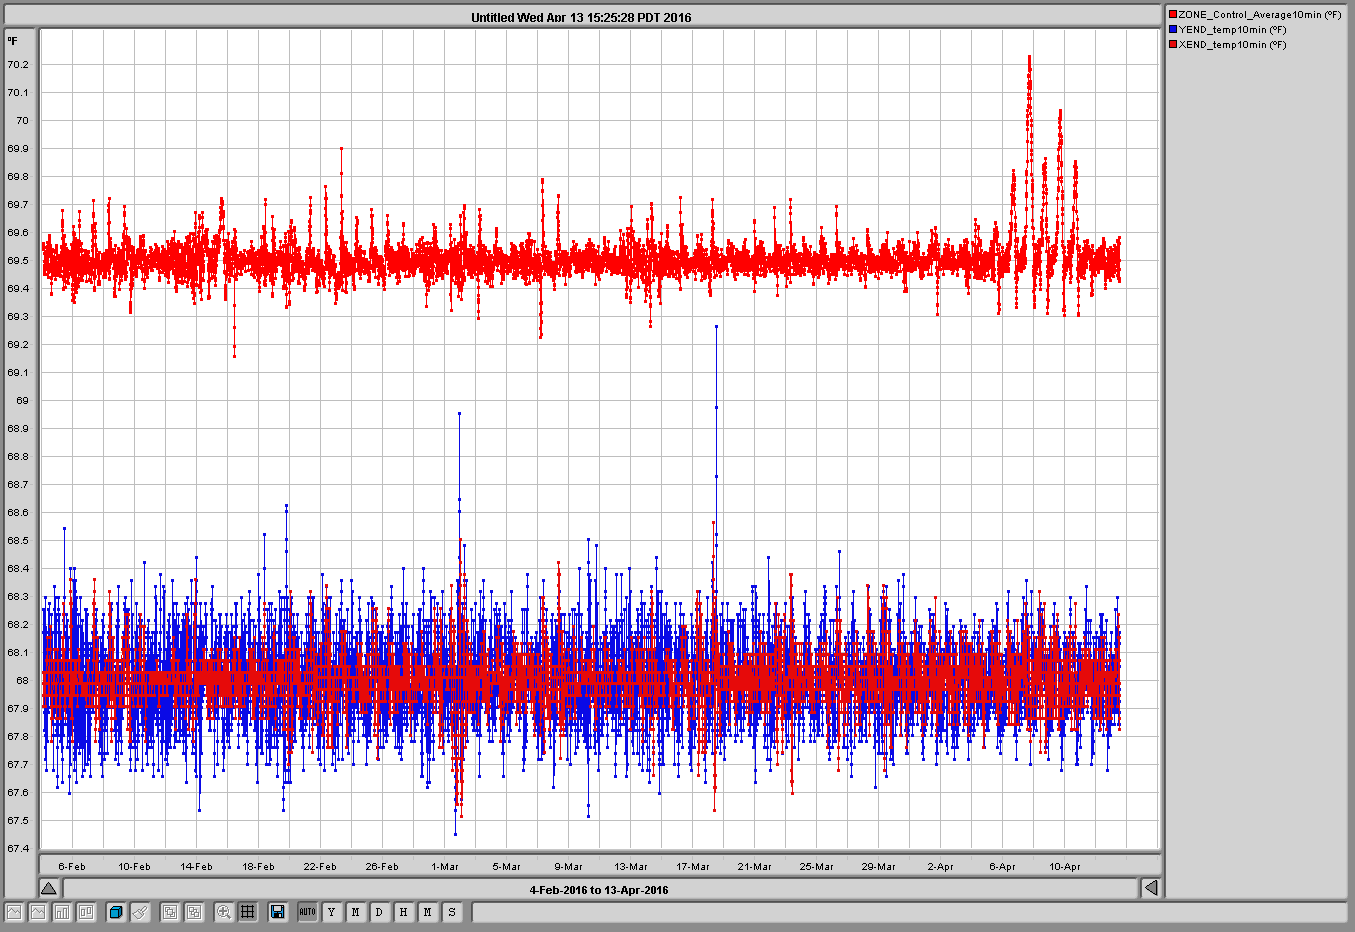
The plot "VEAs" displays the average temperature for the two end station VEAs and the LVEA average (Zone_Control_AVerage)
These are 10 minute samples.
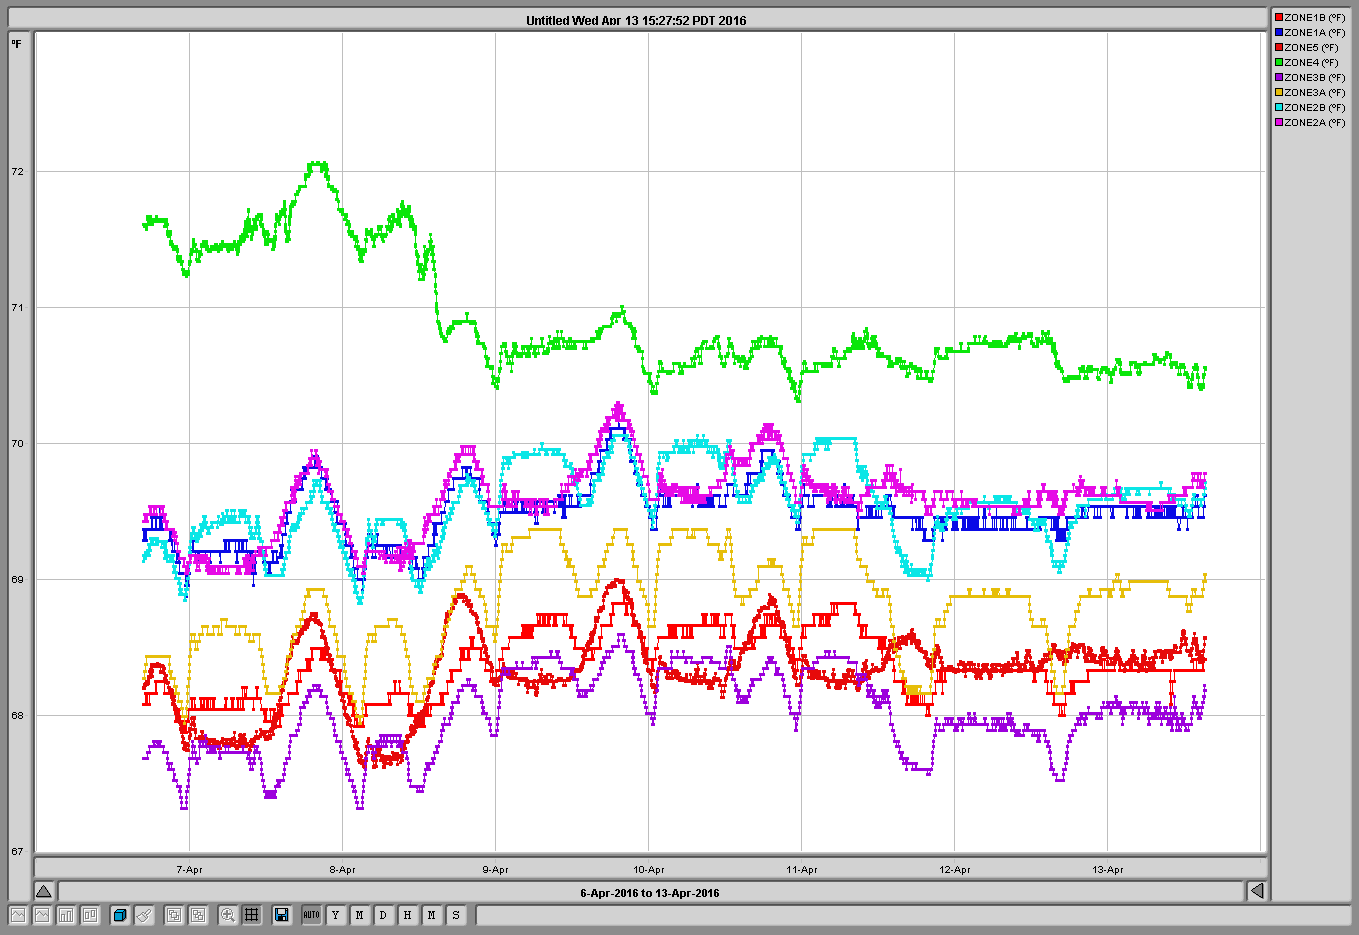
Note that the End VEAs consist of one zone while the LVEA has 8 zones (shown in plot LVEAzones - one minute samples)
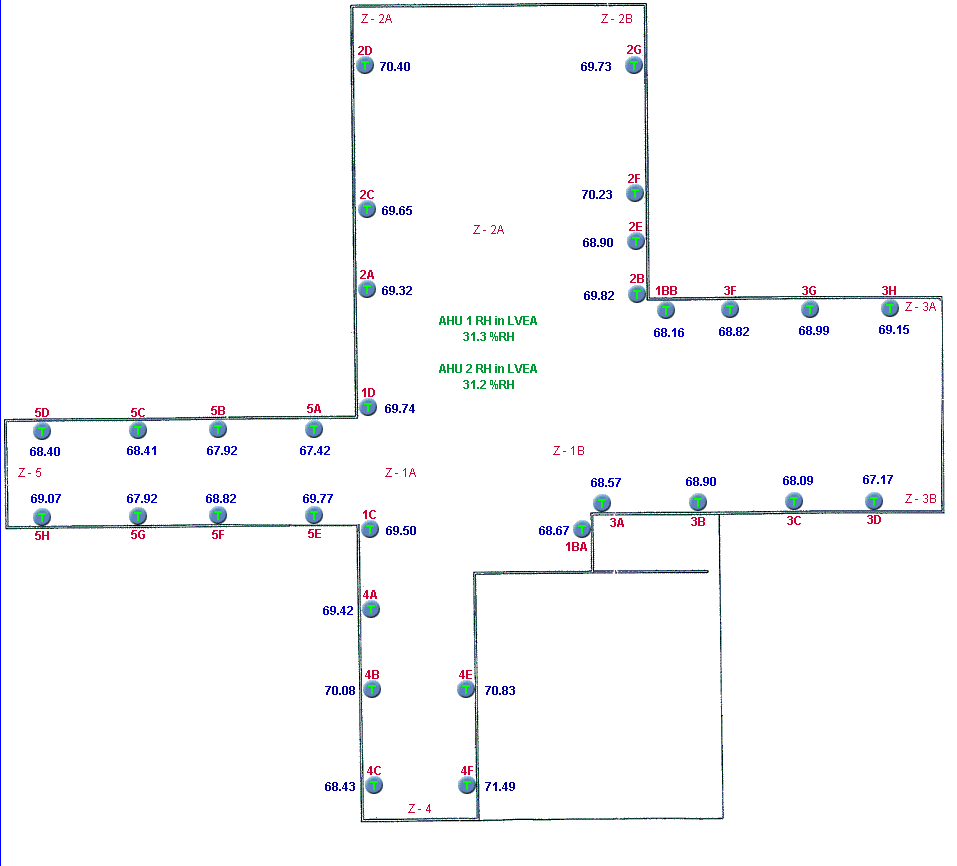
Zonedef shows all the temperature sensors in the LVEA.
At LHO we do not control the zones individually (since disabling the SCR controls years ago) We control to an average Zone_Control_AVerage which averages most of the sensors in the LVEA with the exception of a few outliers. For example, sensor 3D, zone 3B, is excluded since it senses drafts from an exterior door near by.
Images attached to this report