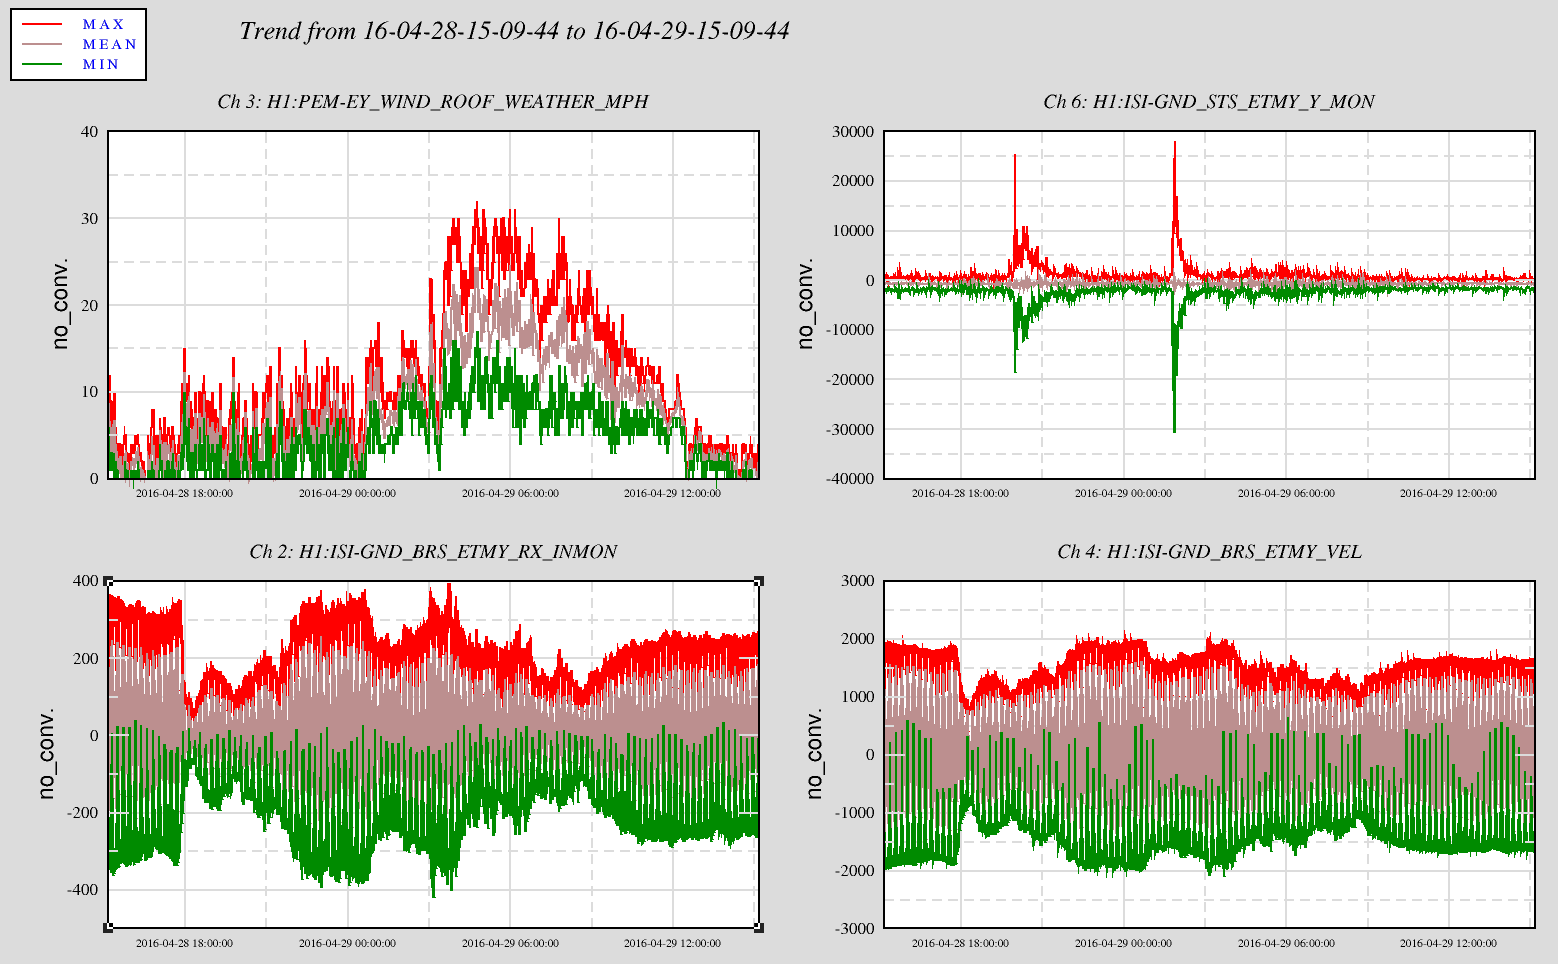
The attached 1 day trend plot shows the BRSY RX (tilt), wind speed, BRS Beam velocity, and the Y STS Seismometer motion. Yesterday at the 1800 hours mark, the tilt and velocity rapid decrease is from when we forced the damping on. Otherwise for the remainder of the plots, the BRS is running on its own. The shape of the trends don't scale with the wind velocity as one might expect...
Remember that BRS_IN is the raw angle of the beam-balance, which is an undamped ~7.6 mHz oscillator with Q of ~2700. The real-time signal will be completely dominated by the resonance - it is like looking at the raw DARM channel and seeing only the violin mode and trying to see if there is a GW signal based on the unfiltered amplitude. To see the real-time ground tilt, you have to looks at (10-100 mHz) BLRMS of BRS_OUT or some such filtered signal.